| Param | Original file | Final file |
|---|---|---|
| Filename | modeM0/AS1G05_105T01_9000000644_05097cztM0_level2.evt | modeM0/AS1G05_105T01_9000000644_05097cztM0_level2_quad_clean.evt |
| Size (bytes) | 551,226,240 | 82,183,680 |
| Size | 525.7 MB | 78.4 MB |
| Events in quadrant A | 3,211,657 | 532,785 |
| Events in quadrant B | 3,666,183 | 528,188 |
| Events in quadrant C | 3,105,851 | 503,087 |
| Events in quadrant D | 6,235,233 | 436,959 |
| Mode SS | |||
|---|---|---|---|
| Quadrant | BADHDUFLAG | Total packets | Discarded packets |
| A | 0 | 144 | 0 |
| B | 0 | 144 | 0 |
| C | 0 | 144 | 0 |
| D | 0 | 144 | 0 |
| Mode M9 | |||
|---|---|---|---|
| Quadrant | BADHDUFLAG | Total packets | Discarded packets |
| A | 0 | 14 | 0 |
| B | 0 | 14 | 0 |
| C | 0 | 14 | 0 |
| D | 0 | 15 | 0 |
| Mode M0 | |||
|---|---|---|---|
| Quadrant | BADHDUFLAG | Total packets | Discarded packets |
| A | 0 | 14428 | 3 |
| B | 0 | 15412 | 2 |
| C | 0 | 14333 | 2 |
| D | 0 | 23408 | 2 |
| Quadrant | Total seconds | Saturated seconds | Saturation percentage |
|---|---|---|---|
| A | 6986 | 153 | 2.190094% |
| B | 6986 | 183 | 2.619525% |
| C | 6986 | 124 | 1.774979% |
| D | 6986 | 1156 | 16.547380% |
Noise dominated data is calculated using 1-second bins in cleaned event files. If a bin has >2000 counts, and if more than 50% of those come from <1% of pixels, then it is considered to be noise-dominated and hence unusable.
| Quadrant | # 1 sec bins | Bins with >0 counts | Bins with >2000 counts | High rate bins dominated by noise | Noise dominated (total time) | Noise dominated (detector-on time) | Marked lightcurve |
|---|---|---|---|---|---|---|---|
| A | 7856 | 6987 | 1 | 1 | 0.01% | 0.01% | 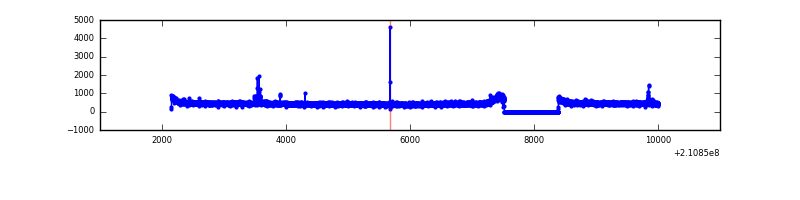 |
| B | 7856 | 6987 | 19 | 19 | 0.24% | 0.27% | 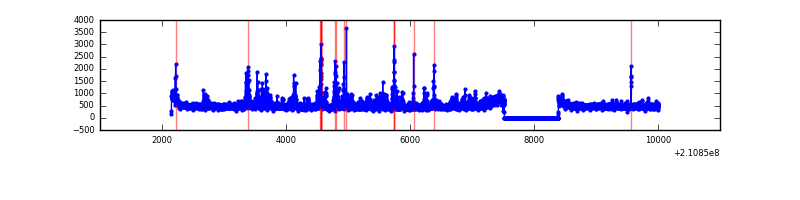 |
| C | 7856 | 6987 | 0 | 0 | 0.00% | 0.00% | 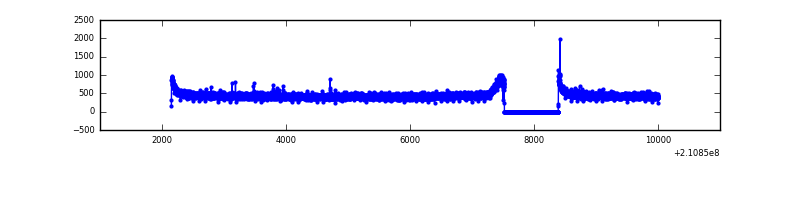 |
| D | 7856 | 6987 | 849 | 849 | 10.81% | 12.15% | 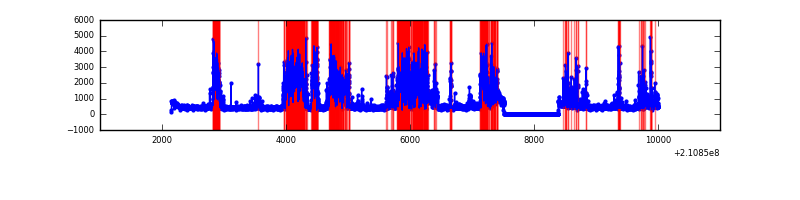 |
Top three noisy pixels from each quadrant. If the there are fewer than three noisy pixels in the level2.evt file, extra rows are filled as -1
| Pixel properties | Quadrant properties | ||||||
|---|---|---|---|---|---|---|---|
| Quadrant | DetID | PixID | Counts | Sigma | Mean | Median | Sigma |
| A | 0 | 50 | 29620 | 173.33 | 824 | 807 | 166.2 |
| A | 12 | 194 | 8176 | 44.33 | 824 | 807 | 166.2 |
| A | 0 | 226 | 7966 | 43.07 | 824 | 807 | 166.2 |
| B | 4 | 80 | 315387 | 1997.59 | 826 | 806 | 157.5 |
| B | 15 | 204 | 92658 | 583.26 | 826 | 806 | 157.5 |
| B | 15 | 54 | 22964 | 140.7 | 826 | 806 | 157.5 |
| C | 12 | 4 | 13714 | 70.89 | 789 | 791 | 182.3 |
| C | 1 | 16 | 8442 | 41.97 | 789 | 791 | 182.3 |
| C | 13 | 61 | 6468 | 31.14 | 789 | 791 | 182.3 |
| D | 13 | 235 | 2450702 | 13572.5 | 739 | 714 | 180.5 |
| D | 13 | 239 | 687852 | 3806.62 | 739 | 714 | 180.5 |
| D | 12 | 233 | 121390 | 668.52 | 739 | 714 | 180.5 |
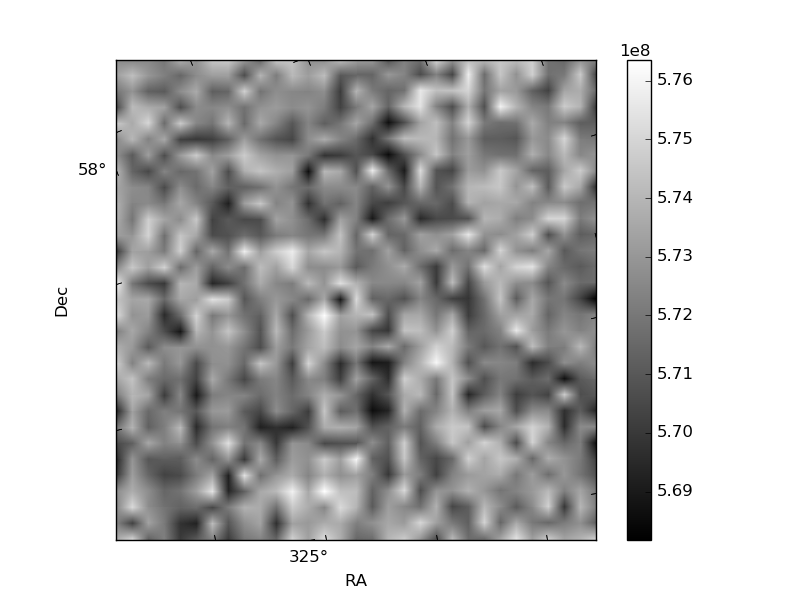
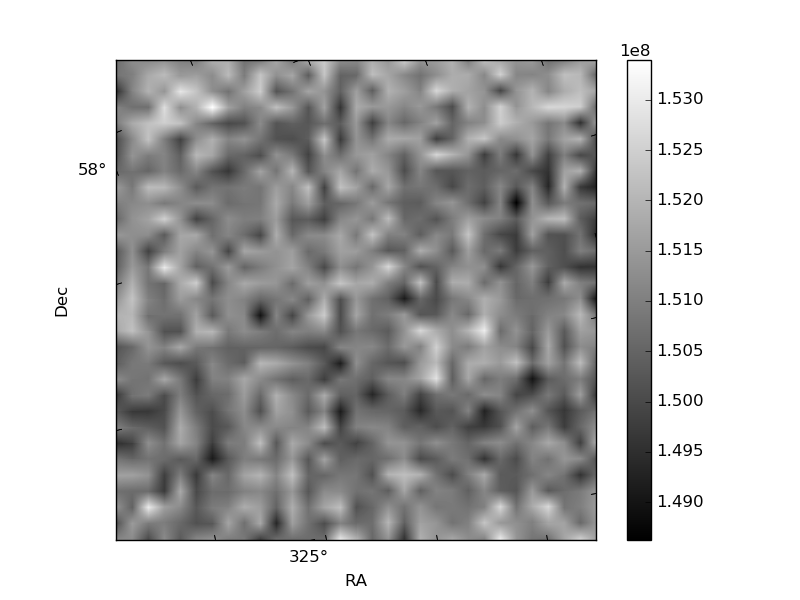
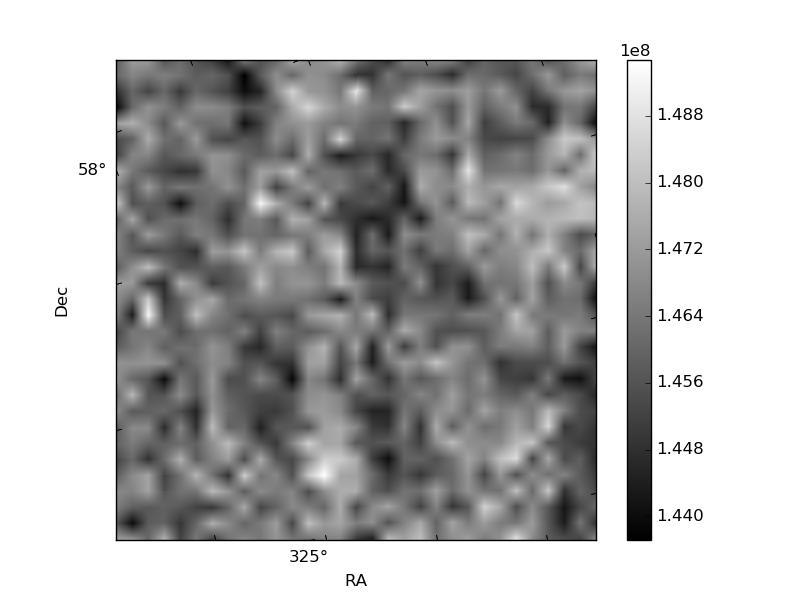
Histogram calculated using DETX and DETY for each event in the final _common_clean file
| Quadrant A | 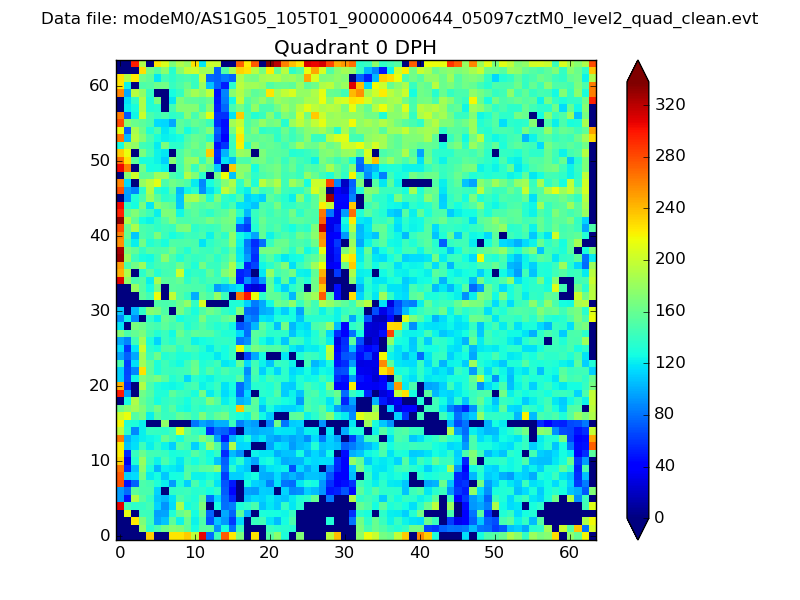 |
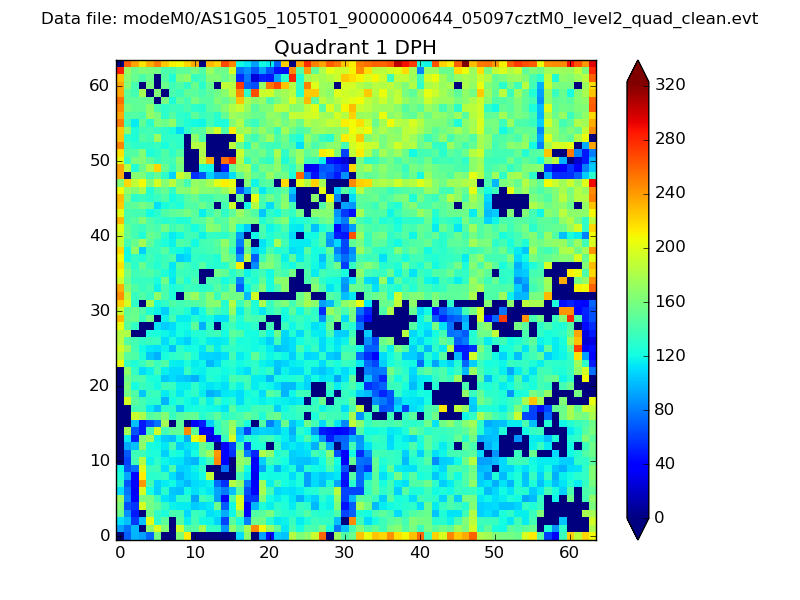 |
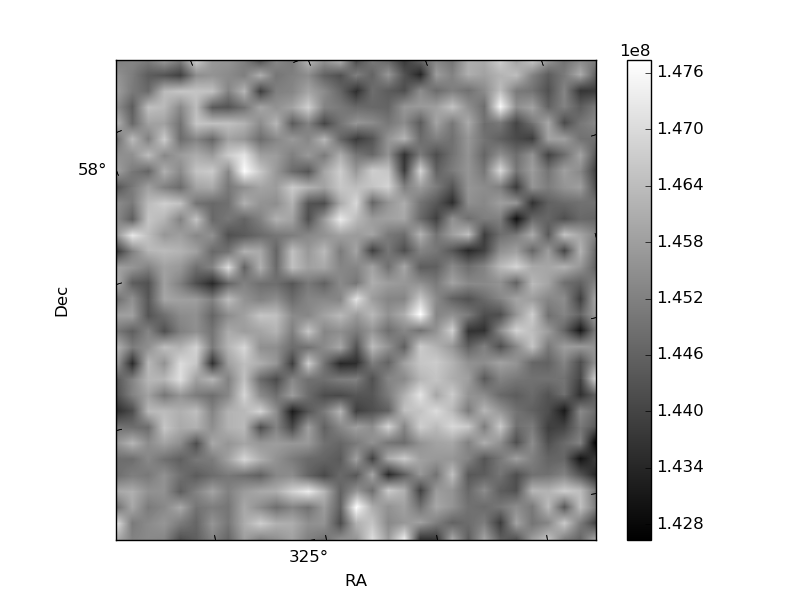
Quadrant B |
|---|---|---|---|
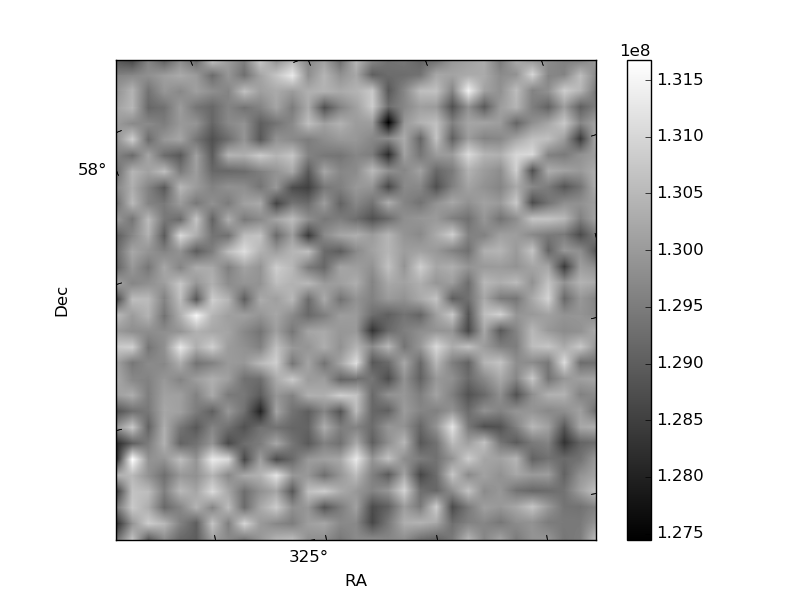
| Quadrant D | 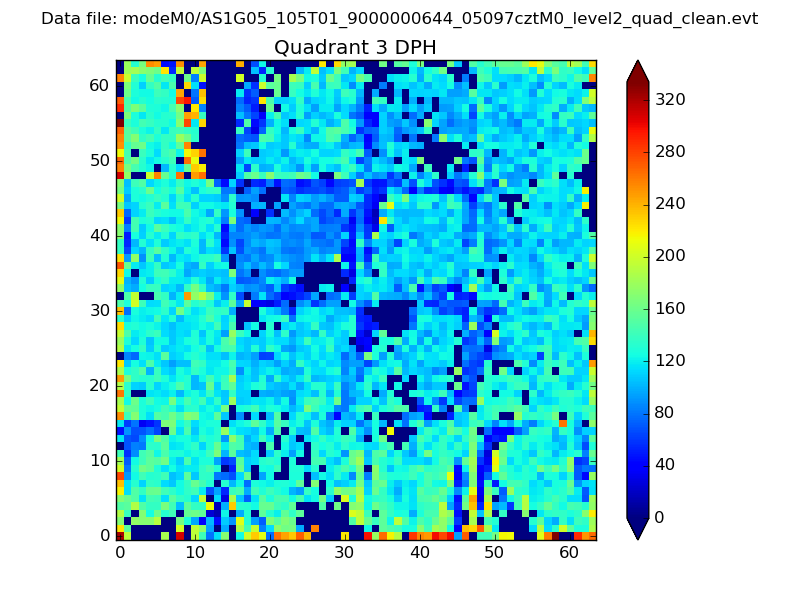 |
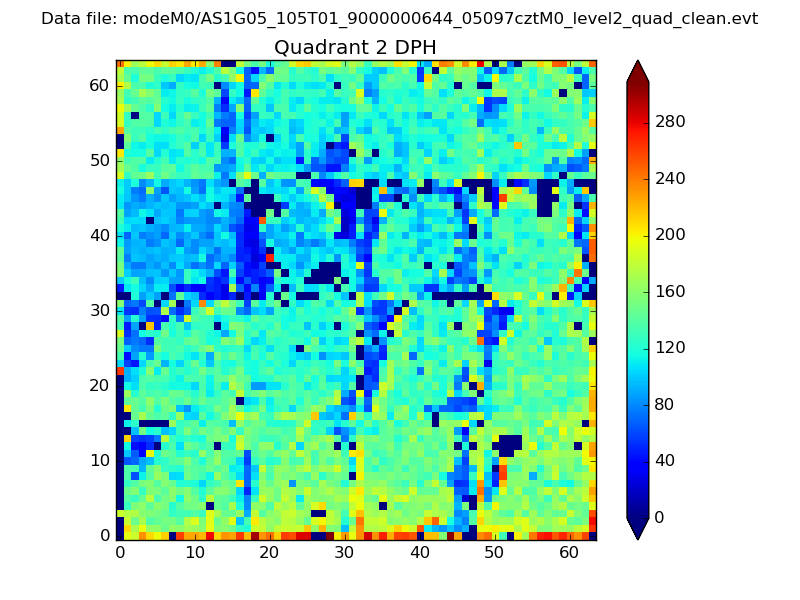 |
Quadrant C |
| Plot type | Count rate plots | Images |
|---|---|---|
| Comparison with Poisson distribution Blue bars denote a histogram of data divided into 1 sec bins. Red curve is a Poisson curve with rate = median count rate of data. |
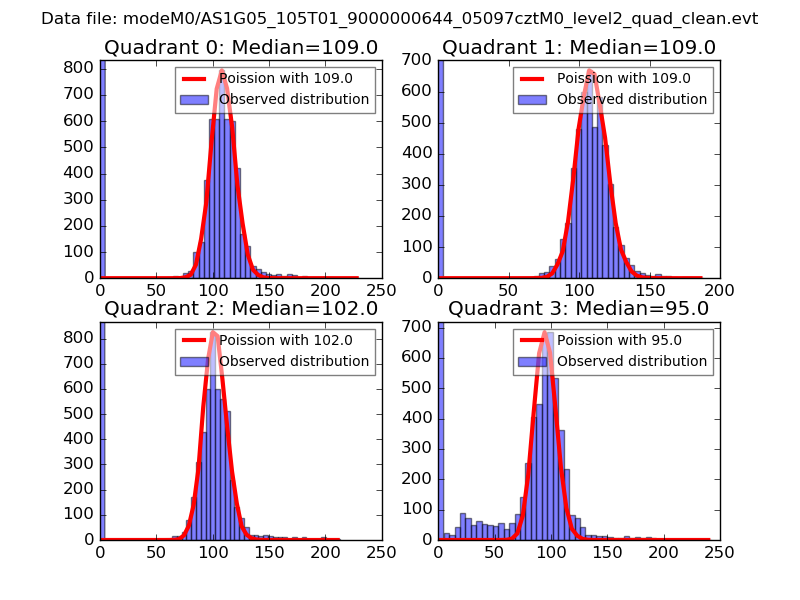 |
 |
| Quadrant-wise count rates Data is divided into 100 sec bins |
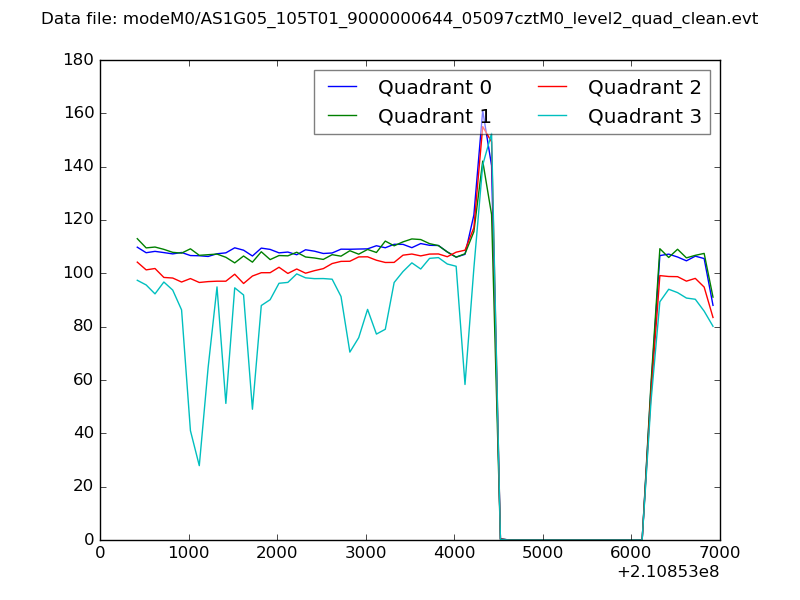 |
|
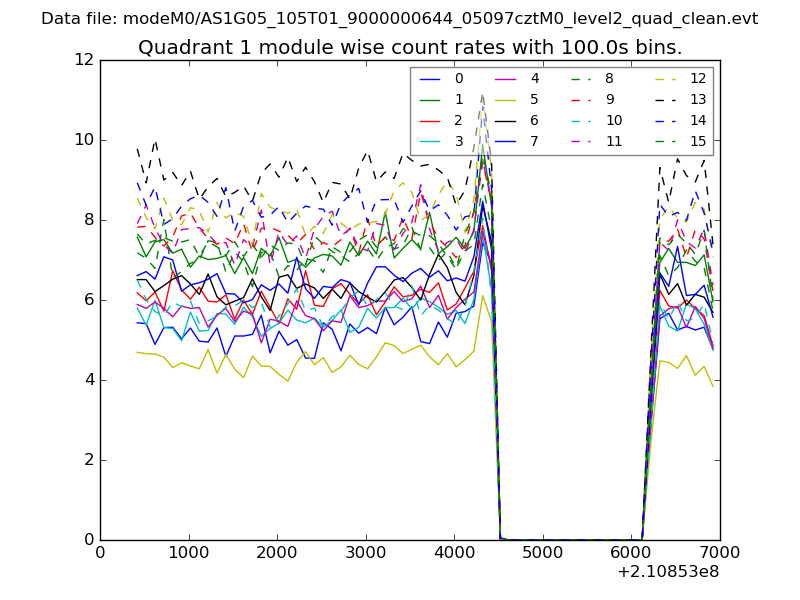
| Module-wise count rates for Quadrant A Data is divided into 100 sec bins |
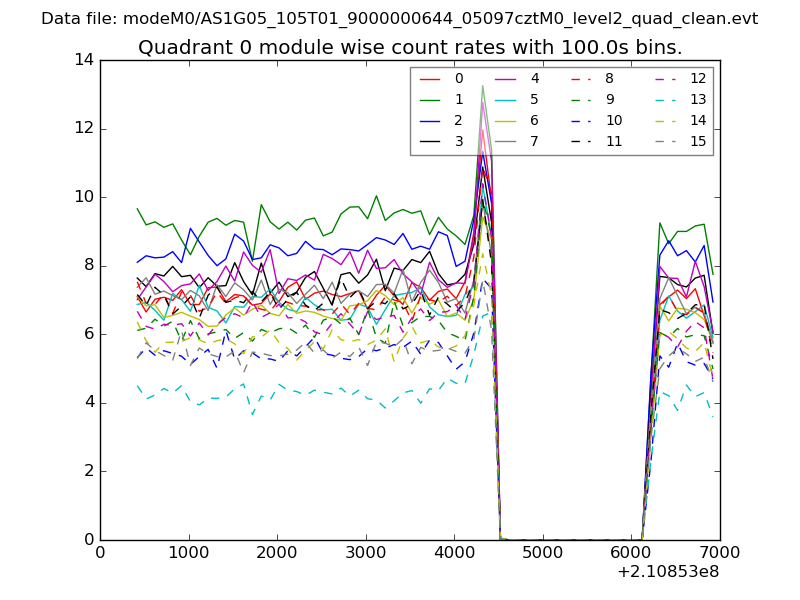 |
 |
| Module-wise count rates for Quadrant B Data is divided into 100 sec bins |
 |
 |
| Module-wise count rates for Quadrant C Data is divided into 100 sec bins |
 |
 |
| Module-wise count rates for Quadrant D Data is divided into 100 sec bins |
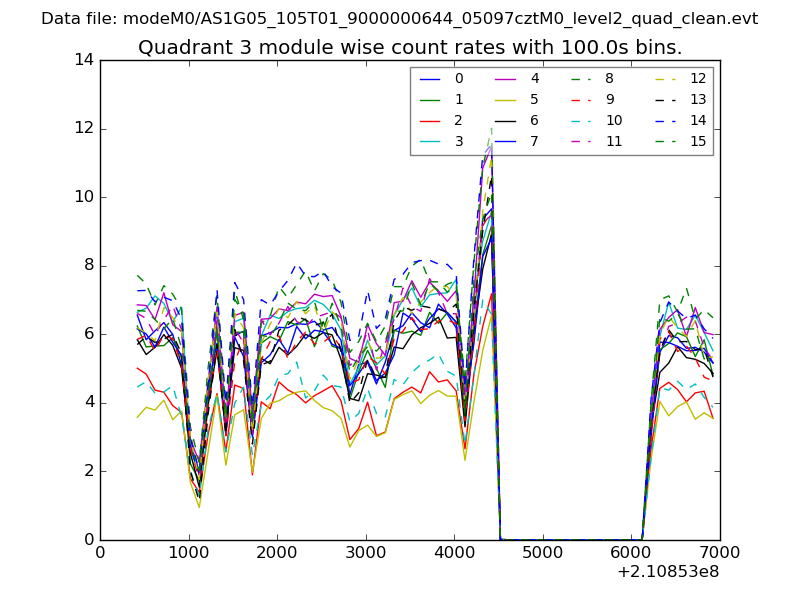 |
 |
| Parameter | Plot |
|---|---|
| CZT HV Monitor | 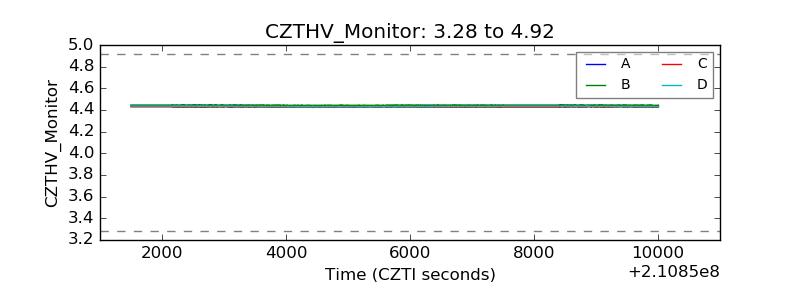 |
| D_VDD | 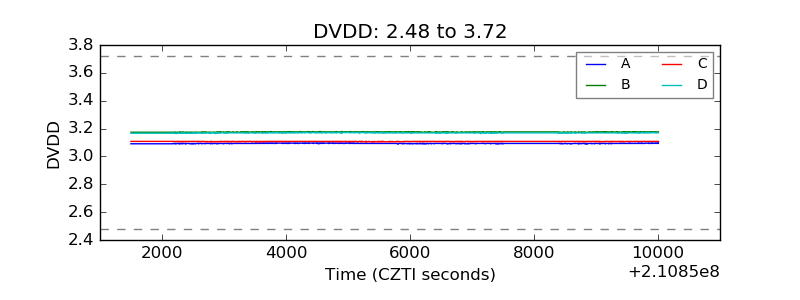 |
| Temperature 1 | 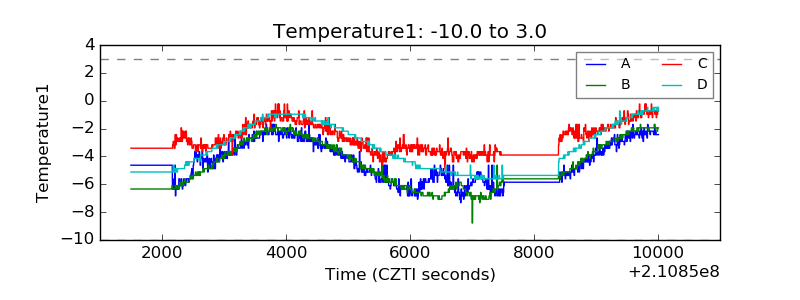 |
| Veto HV Monitor | 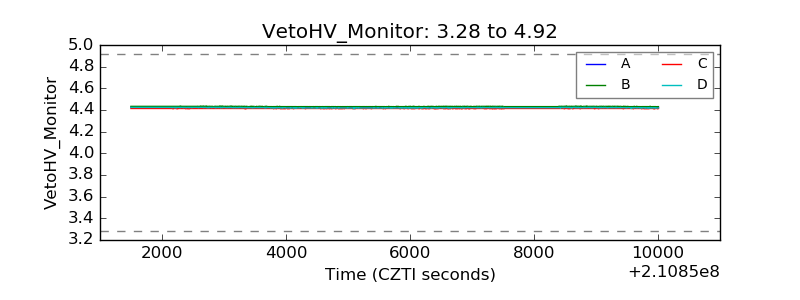 |
| Veto LLD | 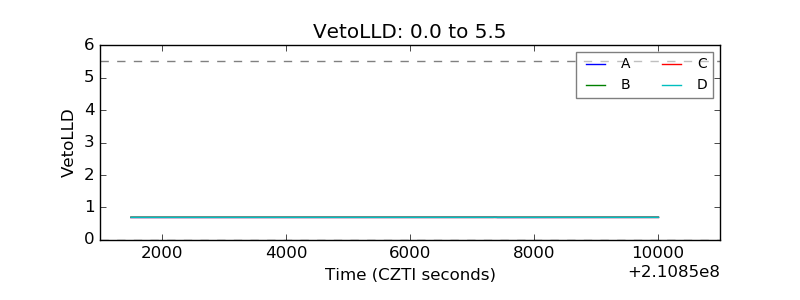 |
| Alpha Counter | 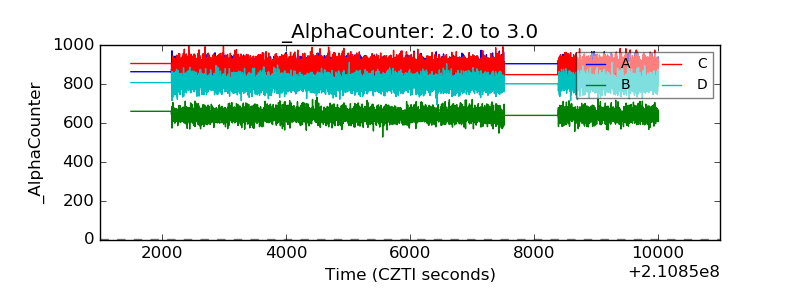 |
| _CPM_Rate | 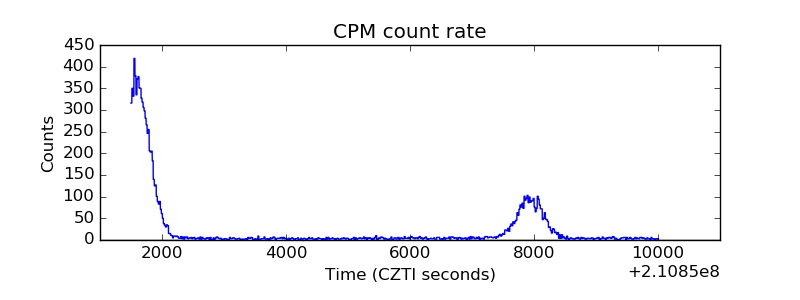 |
| CZT Counter | 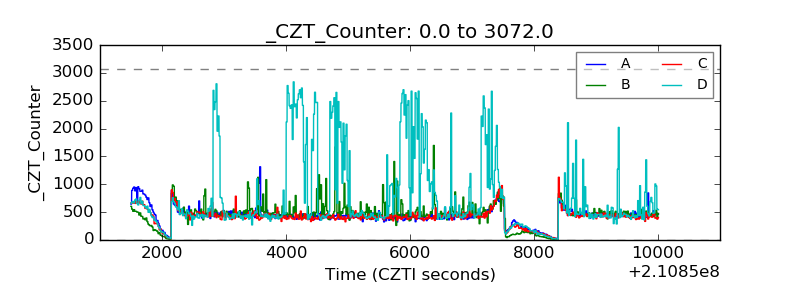 |
| +2.5 Volts monitor |  |
| +5 Volts monitor |  |
| _ROLL_ROT | 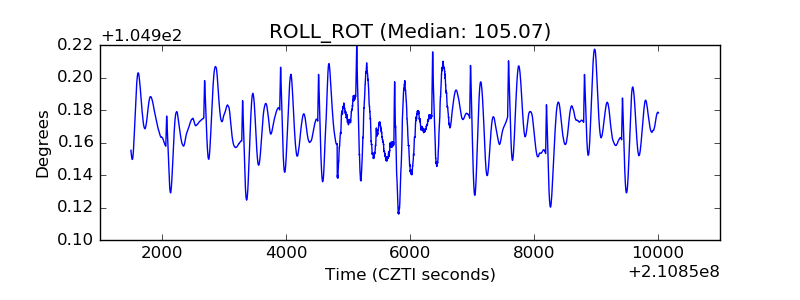 |
| _Roll_DEC | 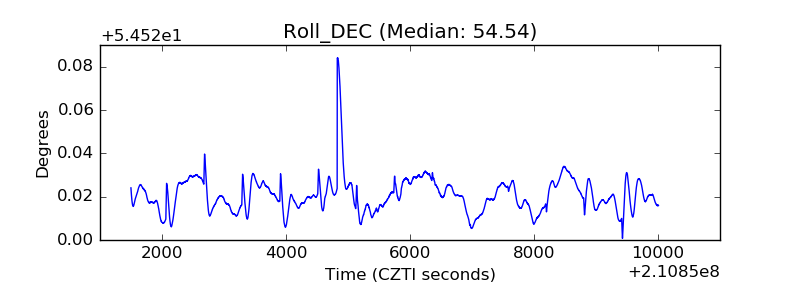 |
| _Roll_RA | 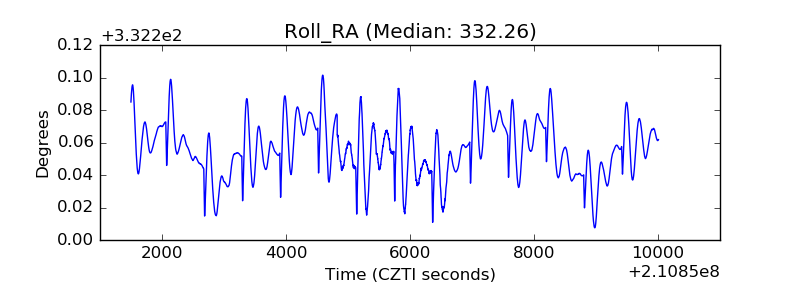 |
| Veto Counter | 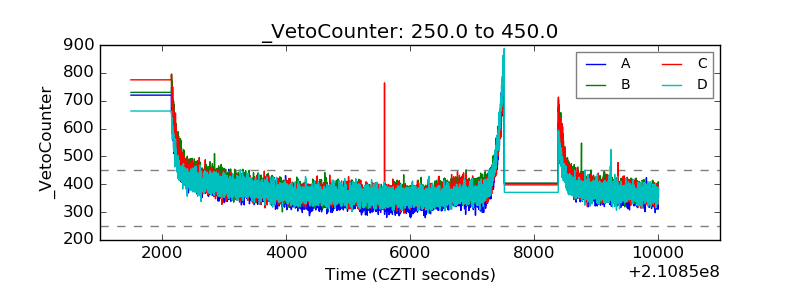 |