| Param | Original file | Final file |
|---|---|---|
| Filename | modeM0/AS1G05_105T01_9000000644_05098cztM0_level2.evt | modeM0/AS1G05_105T01_9000000644_05098cztM0_level2_quad_clean.evt |
| Size (bytes) | 600,431,040 | 82,301,760 |
| Size | 572.6 MB | 78.5 MB |
| Events in quadrant A | 2,951,040 | 559,784 |
| Events in quadrant B | 3,037,124 | 562,445 |
| Events in quadrant C | 2,805,026 | 530,464 |
| Events in quadrant D | 8,949,096 | 384,506 |
| Mode SS | |||
|---|---|---|---|
| Quadrant | BADHDUFLAG | Total packets | Discarded packets |
| A | 0 | 134 | 0 |
| B | 0 | 134 | 0 |
| C | 0 | 134 | 0 |
| D | 0 | 134 | 0 |
| Mode M9 | |||
|---|---|---|---|
| Quadrant | BADHDUFLAG | Total packets | Discarded packets |
| A | 0 | 4 | 0 |
| B | 0 | 4 | 0 |
| C | 0 | 4 | 0 |
| D | 0 | 4 | 0 |
| Mode M0 | |||
|---|---|---|---|
| Quadrant | BADHDUFLAG | Total packets | Discarded packets |
| A | 0 | 13434 | 2 |
| B | 0 | 13515 | 1 |
| C | 0 | 13250 | 1 |
| D | 0 | 31052 | 1 |
| Quadrant | Total seconds | Saturated seconds | Saturation percentage |
|---|---|---|---|
| A | 6504 | 107 | 1.645141% |
| B | 6504 | 105 | 1.614391% |
| C | 6504 | 77 | 1.183887% |
| D | 6504 | 2319 | 35.654982% |
Noise dominated data is calculated using 1-second bins in cleaned event files. If a bin has >2000 counts, and if more than 50% of those come from <1% of pixels, then it is considered to be noise-dominated and hence unusable.
| Quadrant | # 1 sec bins | Bins with >0 counts | Bins with >2000 counts | High rate bins dominated by noise | Noise dominated (total time) | Noise dominated (detector-on time) | Marked lightcurve |
|---|---|---|---|---|---|---|---|
| A | 6959 | 6505 | 10 | 10 | 0.14% | 0.15% | 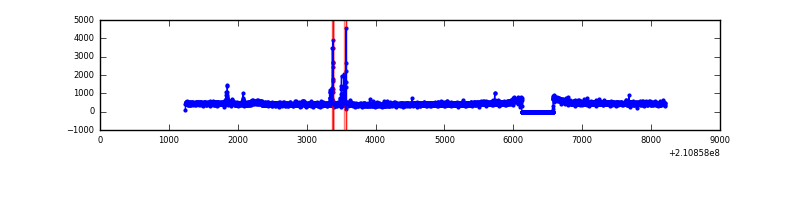 |
| B | 6959 | 6505 | 7 | 7 | 0.10% | 0.11% | 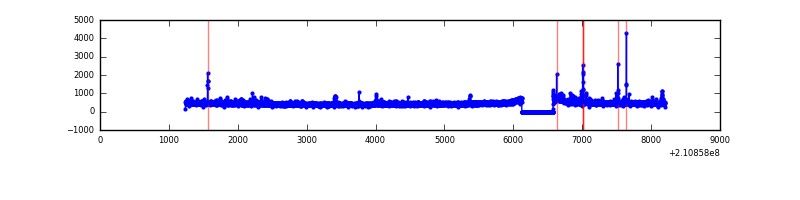 |
| C | 6959 | 6505 | 0 | 0 | 0.00% | 0.00% | 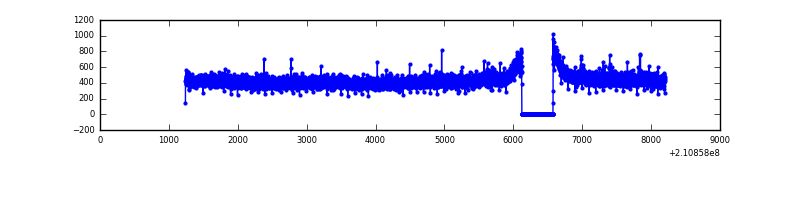 |
| D | 6959 | 6505 | 1890 | 1890 | 27.16% | 29.05% | 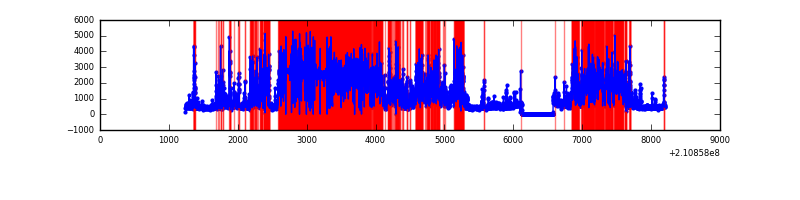 |
Top three noisy pixels from each quadrant. If the there are fewer than three noisy pixels in the level2.evt file, extra rows are filled as -1
| Pixel properties | Quadrant properties | ||||||
|---|---|---|---|---|---|---|---|
| Quadrant | DetID | PixID | Counts | Sigma | Mean | Median | Sigma |
| A | 0 | 50 | 66428 | 432.81 | 740 | 722 | 151.8 |
| A | 13 | 251 | 35784 | 230.95 | 740 | 722 | 151.8 |
| A | 12 | 194 | 7501 | 44.65 | 740 | 722 | 151.8 |
| B | 4 | 80 | 52668 | 365.19 | 745 | 726 | 142.2 |
| B | 15 | 54 | 24531 | 167.37 | 745 | 726 | 142.2 |
| B | 4 | 48 | 20673 | 140.24 | 745 | 726 | 142.2 |
| C | 12 | 4 | 7839 | 43.15 | 713 | 715 | 165.1 |
| C | 8 | 128 | 6496 | 35.01 | 713 | 715 | 165.1 |
| C | 13 | 61 | 5888 | 31.33 | 713 | 715 | 165.1 |
| D | 12 | 22 | 4875390 | 33724.12 | 584 | 563 | 144.6 |
| D | 13 | 235 | 1115012 | 7709.77 | 584 | 563 | 144.6 |
| D | 13 | 239 | 323951 | 2237.2 | 584 | 563 | 144.6 |
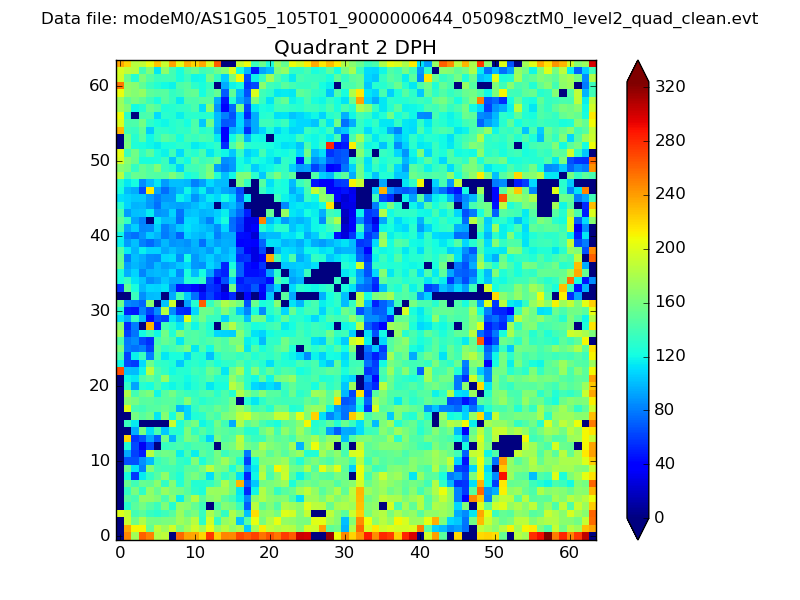
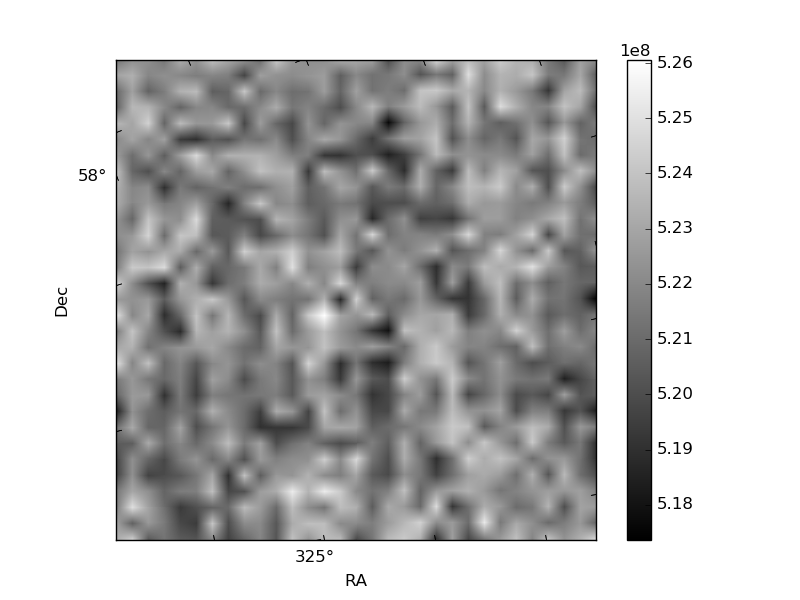
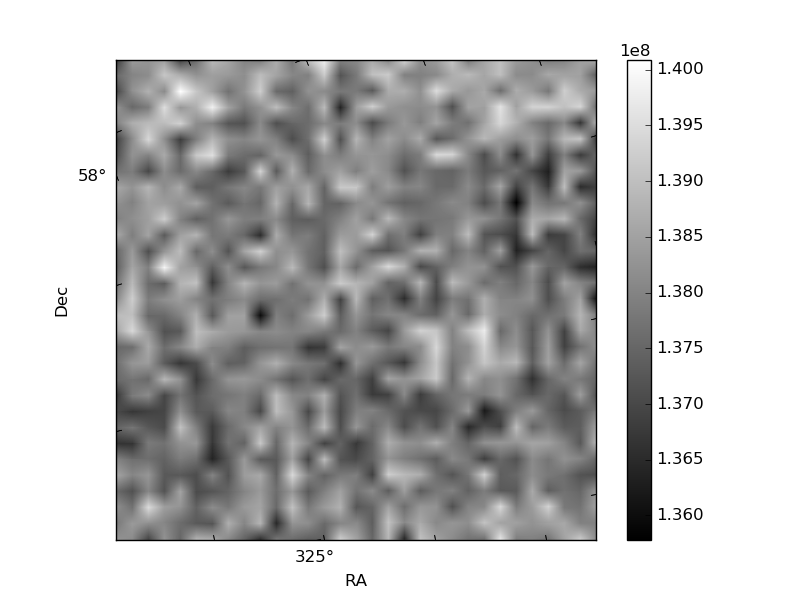
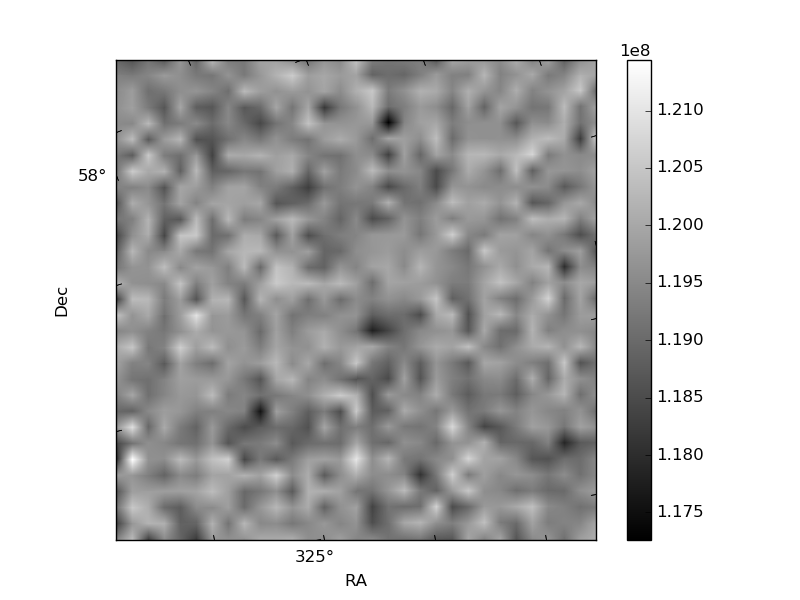
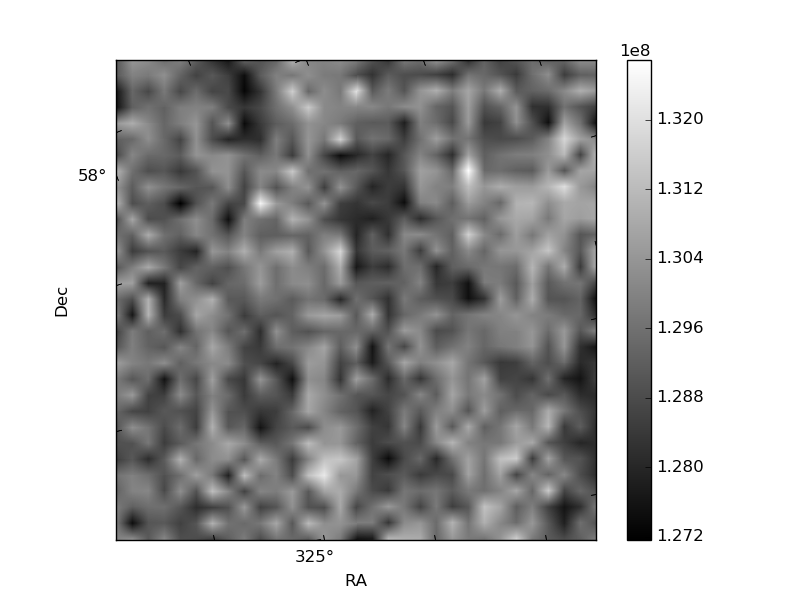
Histogram calculated using DETX and DETY for each event in the final _common_clean file
| Quadrant A | 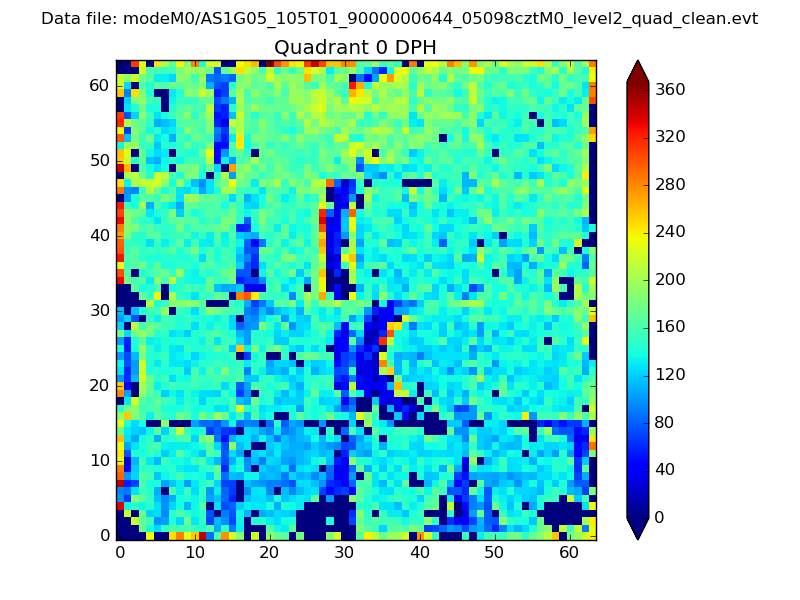 |
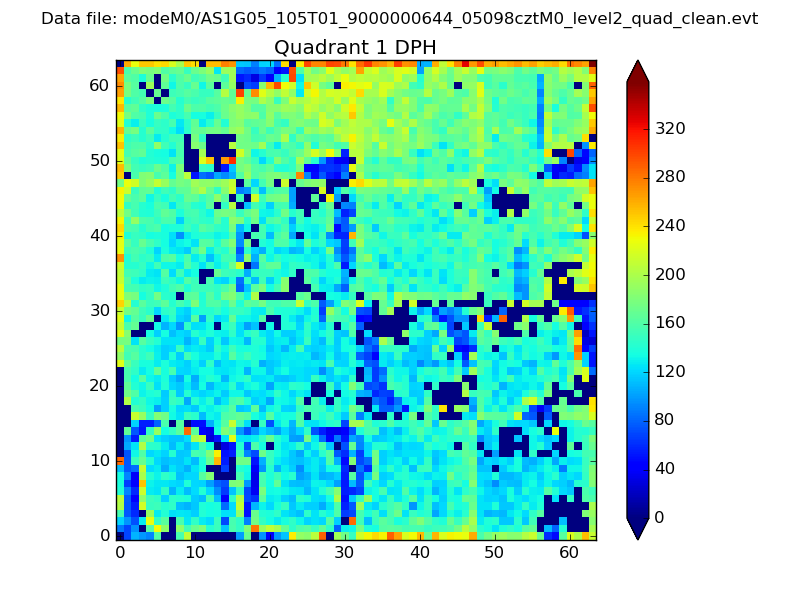 |
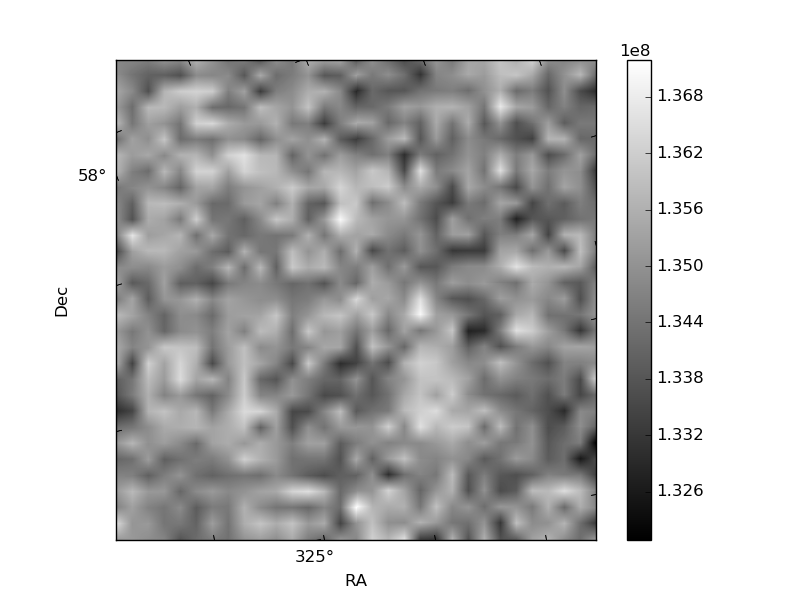
Quadrant B |
|---|---|---|---|
| Quadrant D | 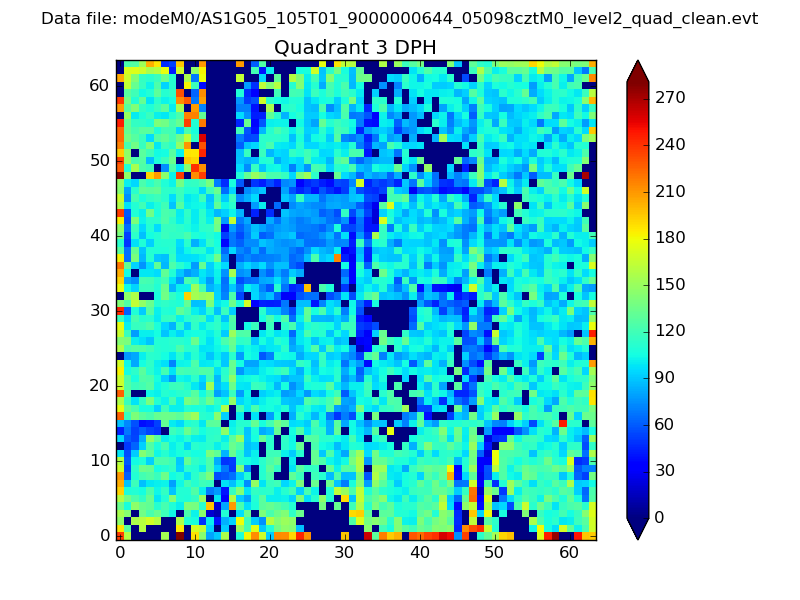 |
 |
Quadrant C |
| Plot type | Count rate plots | Images |
|---|---|---|
| Comparison with Poisson distribution Blue bars denote a histogram of data divided into 1 sec bins. Red curve is a Poisson curve with rate = median count rate of data. |
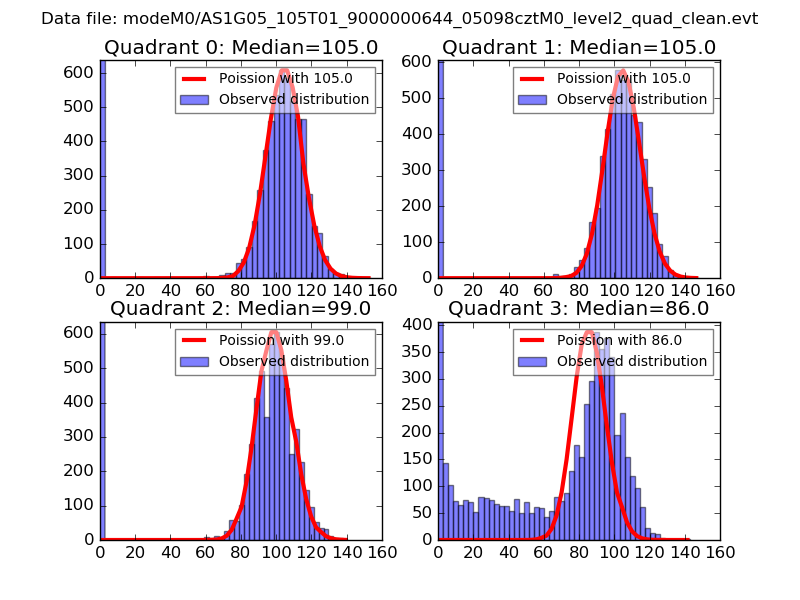 |
 |
| Quadrant-wise count rates Data is divided into 100 sec bins |
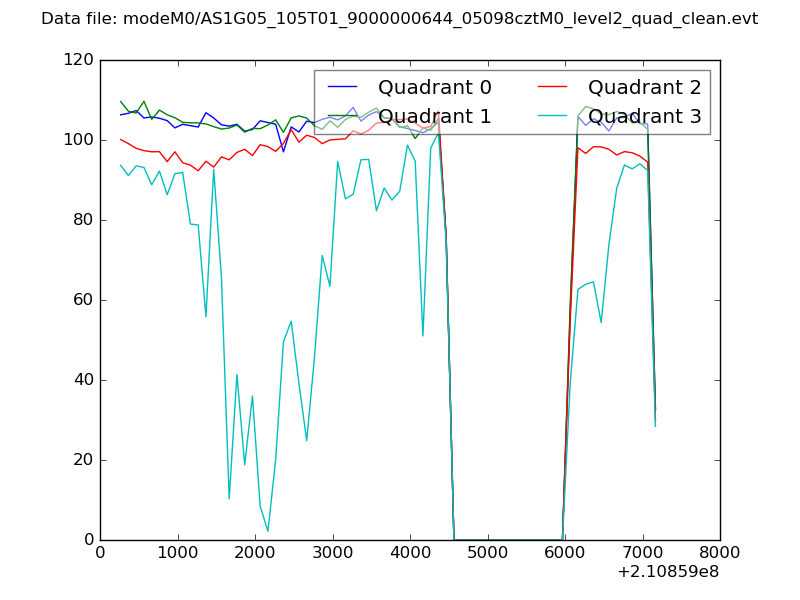 |
|
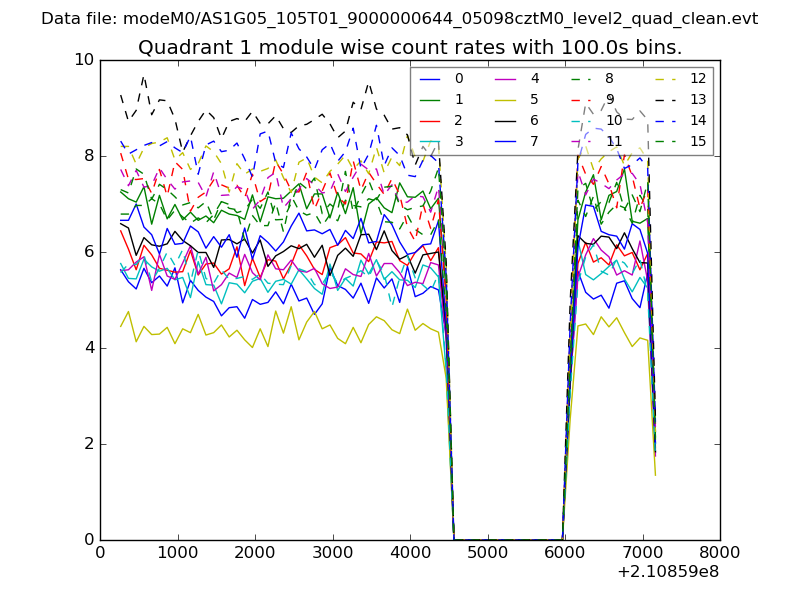
| Module-wise count rates for Quadrant A Data is divided into 100 sec bins |
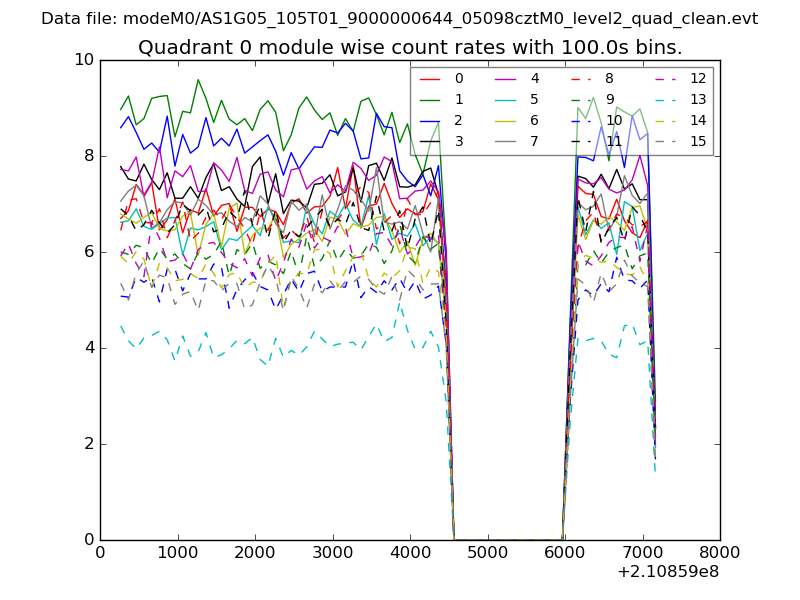 |
 |
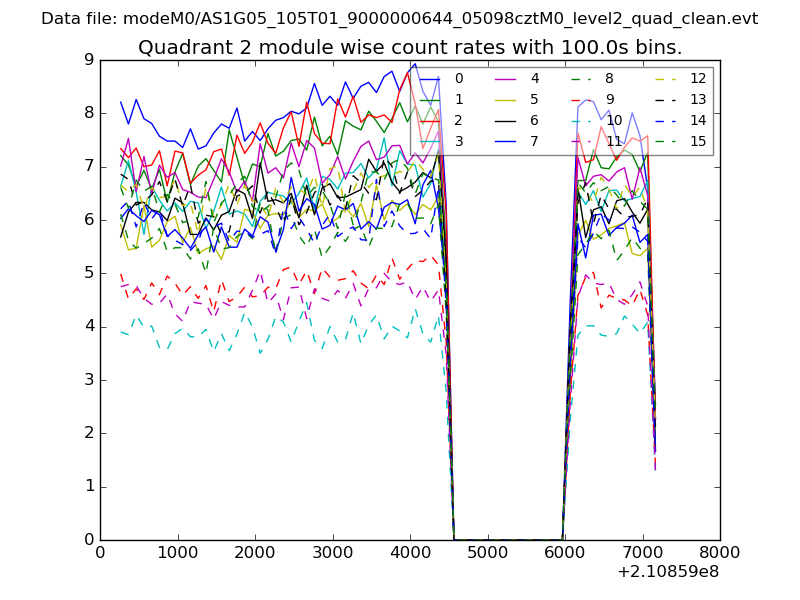
| Module-wise count rates for Quadrant B Data is divided into 100 sec bins |
 |
 |
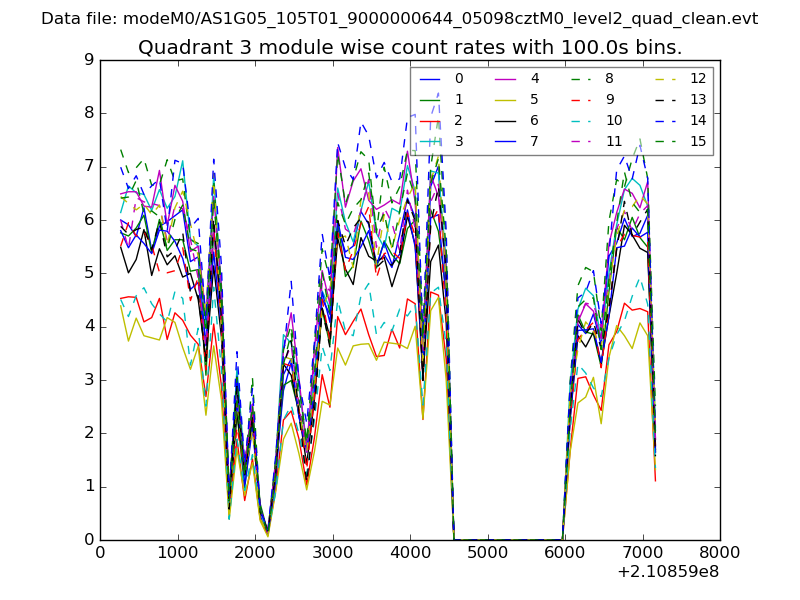
| Module-wise count rates for Quadrant C Data is divided into 100 sec bins |
 |
 |
| Module-wise count rates for Quadrant D Data is divided into 100 sec bins |
 |
 |
| Parameter | Plot |
|---|---|
| CZT HV Monitor | 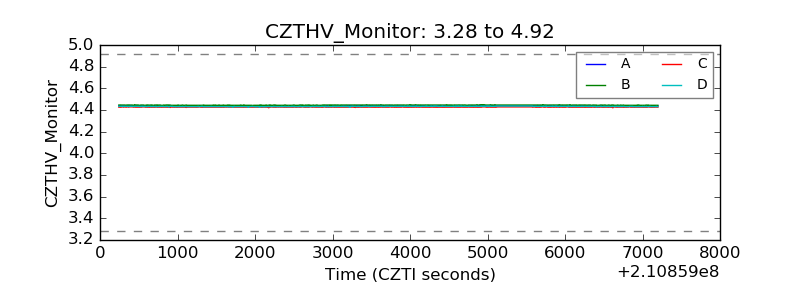 |
| D_VDD | 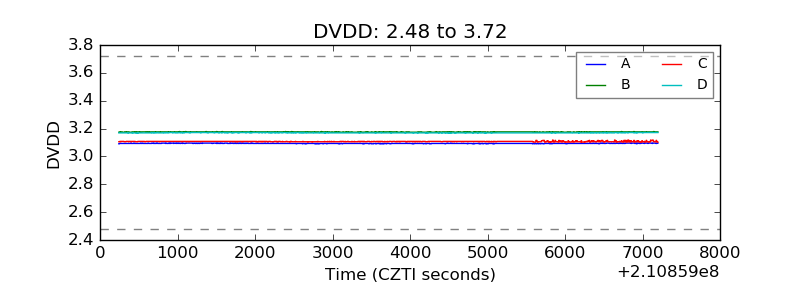 |
| Temperature 1 | 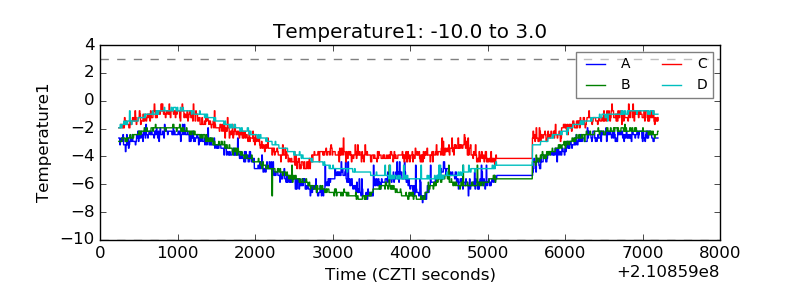 |
| Veto HV Monitor | 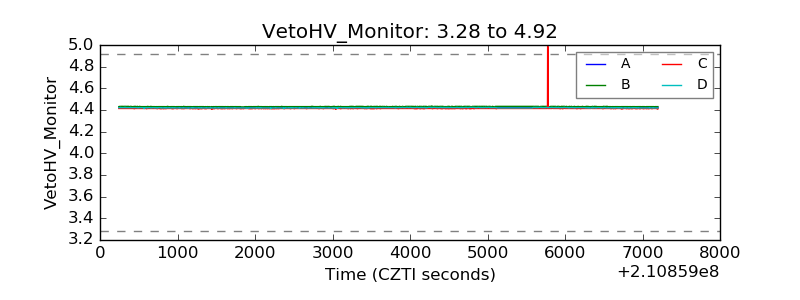 |
| Veto LLD | 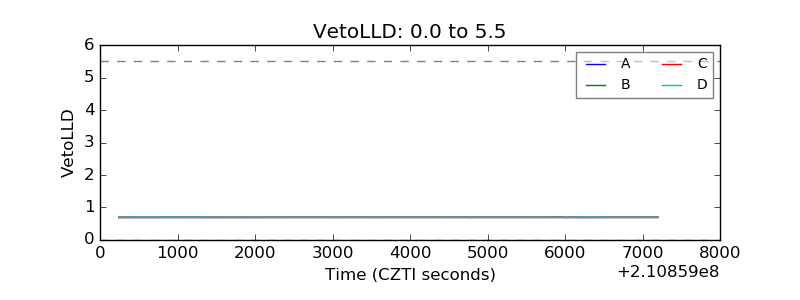 |
| Alpha Counter | 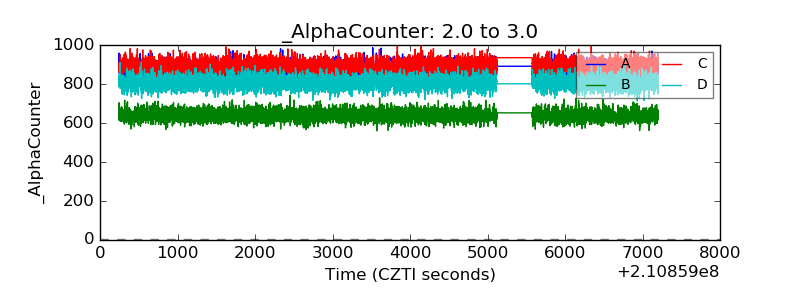 |
| _CPM_Rate | 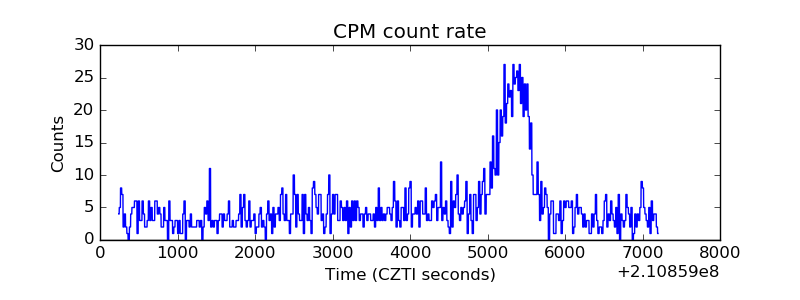 |
| CZT Counter | 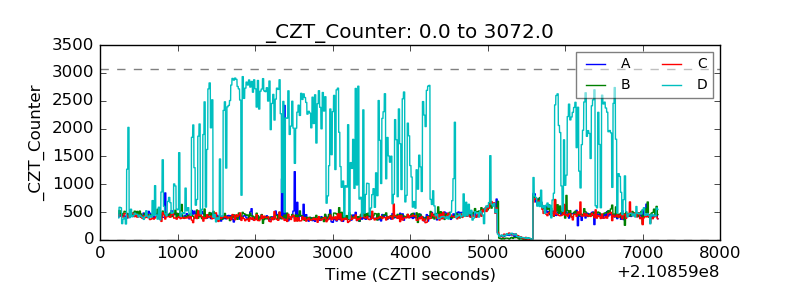 |
| +2.5 Volts monitor |  |
| +5 Volts monitor |  |
| _ROLL_ROT | 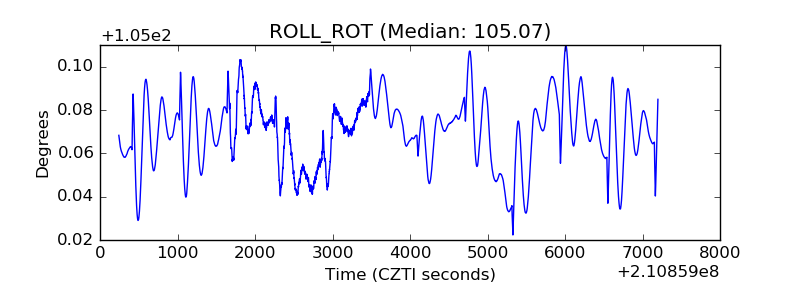 |
| _Roll_DEC | 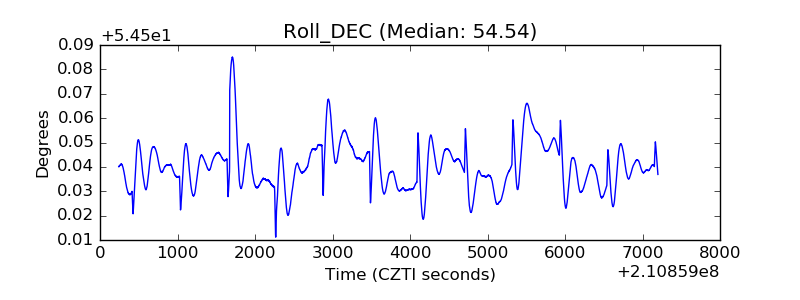 |
| _Roll_RA | 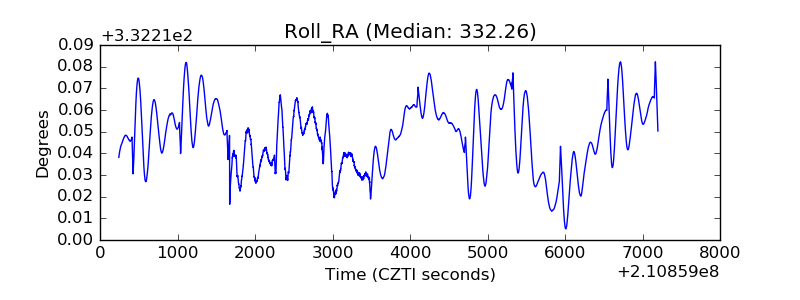 |
| Veto Counter | 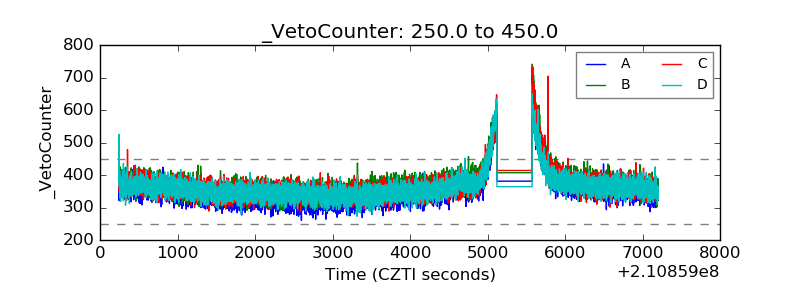 |