| Param | Original file | Final file |
|---|---|---|
| Filename | modeM0/AS1G05_105T01_9000000644_05099cztM0_level2.evt | modeM0/AS1G05_105T01_9000000644_05099cztM0_level2_quad_clean.evt |
| Size (bytes) | 580,176,000 | 88,513,920 |
| Size | 553.3 MB | 84.4 MB |
| Events in quadrant A | 3,373,197 | 574,372 |
| Events in quadrant B | 3,584,220 | 578,945 |
| Events in quadrant C | 3,162,482 | 548,385 |
| Events in quadrant D | 6,968,872 | 484,257 |
| Mode SS | |||
|---|---|---|---|
| Quadrant | BADHDUFLAG | Total packets | Discarded packets |
| A | 0 | 142 | 0 |
| B | 0 | 142 | 0 |
| C | 0 | 142 | 0 |
| D | 0 | 142 | 0 |
| Mode M9 | |||
|---|---|---|---|
| Quadrant | BADHDUFLAG | Total packets | Discarded packets |
| A | 0 | 1 | 0 |
| B | 0 | 1 | 0 |
| C | 0 | 1 | 0 |
| D | 0 | 1 | 0 |
| Mode M0 | |||
|---|---|---|---|
| Quadrant | BADHDUFLAG | Total packets | Discarded packets |
| A | 0 | 15124 | 3 |
| B | 0 | 15454 | 2 |
| C | 0 | 14670 | 2 |
| D | 0 | 25708 | 2 |
| Quadrant | Total seconds | Saturated seconds | Saturation percentage |
|---|---|---|---|
| A | 7103 | 187 | 2.632690% |
| B | 7103 | 162 | 2.280726% |
| C | 7103 | 119 | 1.675348% |
| D | 7103 | 1456 | 20.498381% |
Noise dominated data is calculated using 1-second bins in cleaned event files. If a bin has >2000 counts, and if more than 50% of those come from <1% of pixels, then it is considered to be noise-dominated and hence unusable.
| Quadrant | # 1 sec bins | Bins with >0 counts | Bins with >2000 counts | High rate bins dominated by noise | Noise dominated (total time) | Noise dominated (detector-on time) | Marked lightcurve |
|---|---|---|---|---|---|---|---|
| A | 7178 | 7105 | 46 | 46 | 0.64% | 0.65% | 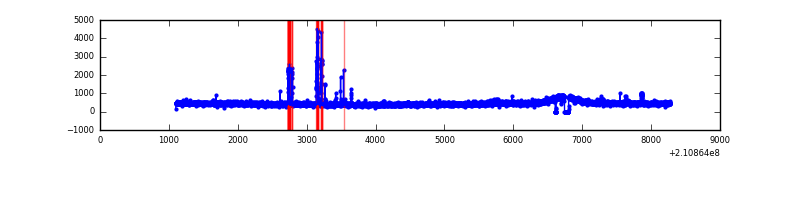 |
| B | 7178 | 7105 | 22 | 22 | 0.31% | 0.31% | 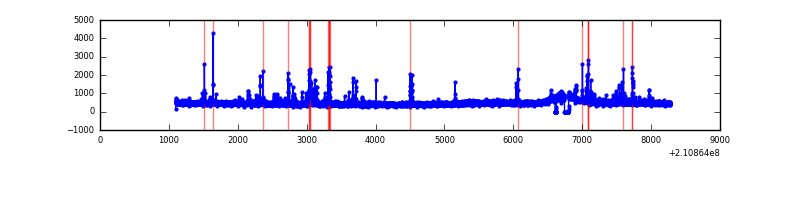 |
| C | 7178 | 7105 | 0 | 0 | 0.00% | 0.00% | 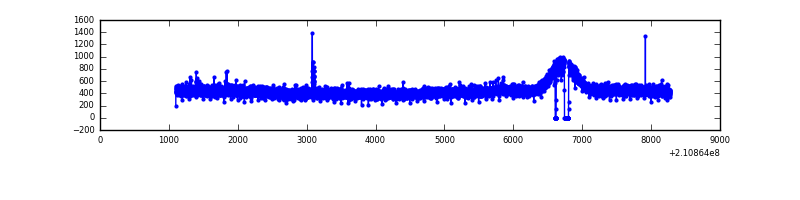 |
| D | 7178 | 7105 | 985 | 985 | 13.72% | 13.86% | 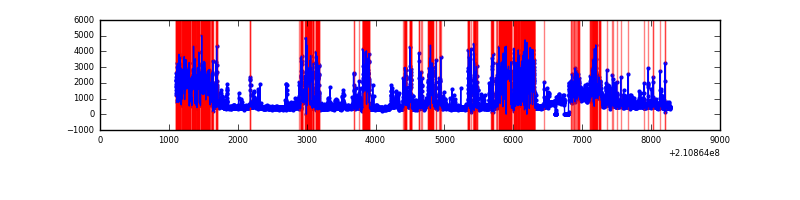 |
Top three noisy pixels from each quadrant. If the there are fewer than three noisy pixels in the level2.evt file, extra rows are filled as -1
| Pixel properties | Quadrant properties | ||||||
|---|---|---|---|---|---|---|---|
| Quadrant | DetID | PixID | Counts | Sigma | Mean | Median | Sigma |
| A | 0 | 50 | 111912 | 661.35 | 821 | 801 | 168.0 |
| A | 13 | 251 | 101623 | 600.1 | 821 | 801 | 168.0 |
| A | 12 | 194 | 8151 | 43.75 | 821 | 801 | 168.0 |
| B | 4 | 80 | 163835 | 1022.78 | 828 | 808 | 159.4 |
| B | 4 | 48 | 117338 | 731.07 | 828 | 808 | 159.4 |
| B | 4 | 200 | 30044 | 183.42 | 828 | 808 | 159.4 |
| C | 8 | 128 | 19959 | 103.45 | 797 | 798 | 185.2 |
| C | 12 | 4 | 13296 | 67.48 | 797 | 798 | 185.2 |
| C | 8 | 112 | 9105 | 44.85 | 797 | 798 | 185.2 |
| D | 12 | 22 | 1416931 | 8029.1 | 717 | 694 | 176.4 |
| D | 13 | 239 | 1384353 | 7844.41 | 717 | 694 | 176.4 |
| D | 13 | 235 | 772185 | 4373.83 | 717 | 694 | 176.4 |
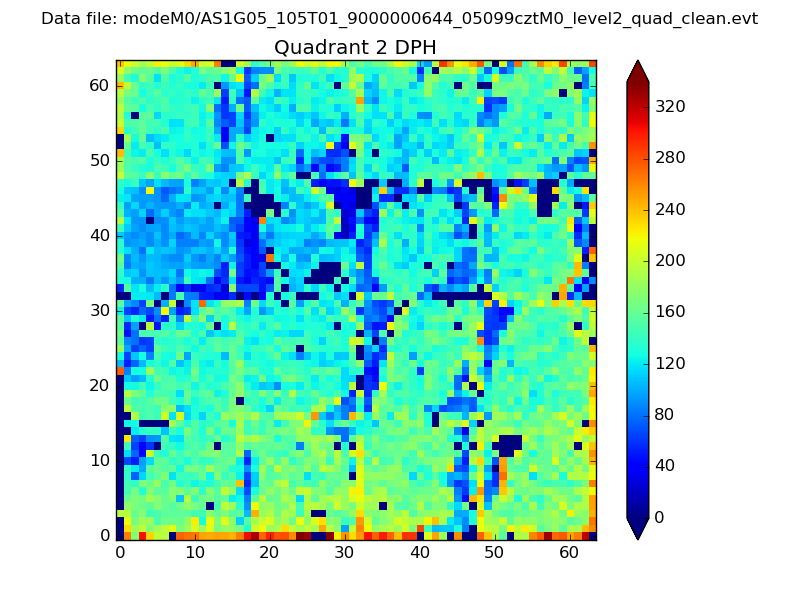
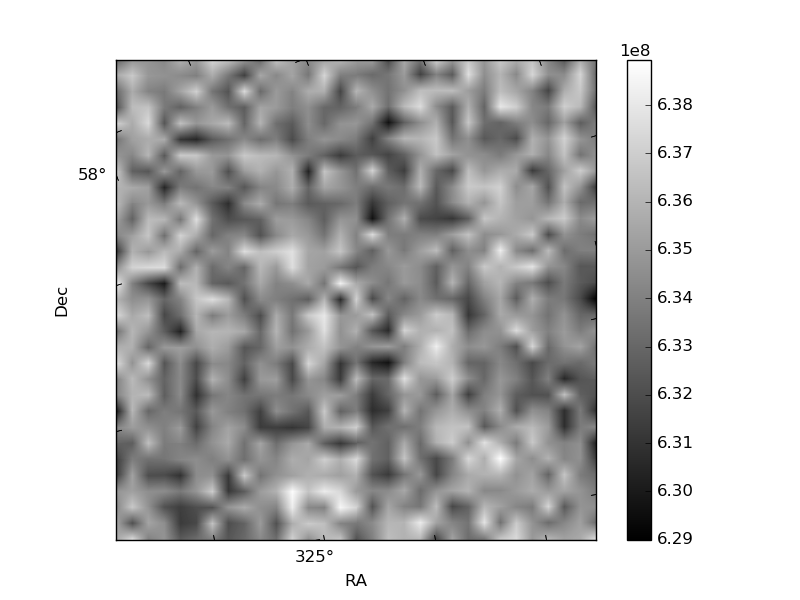
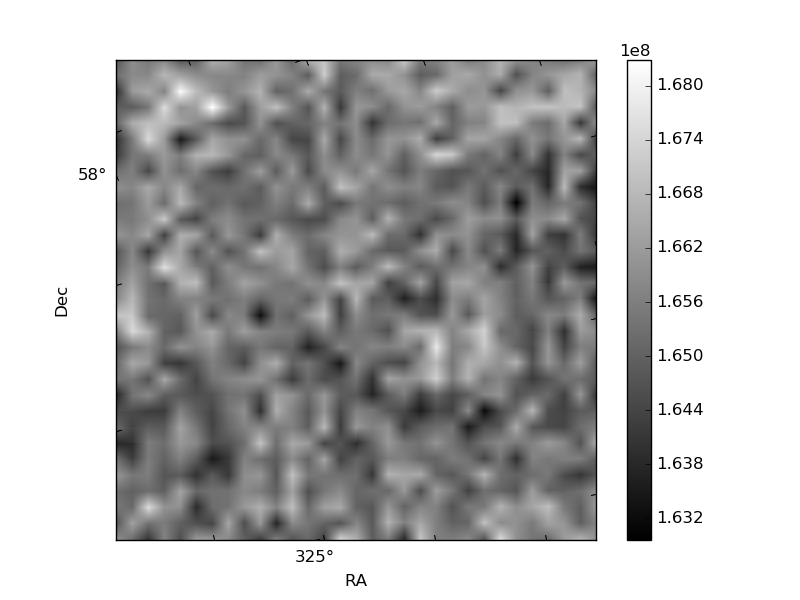
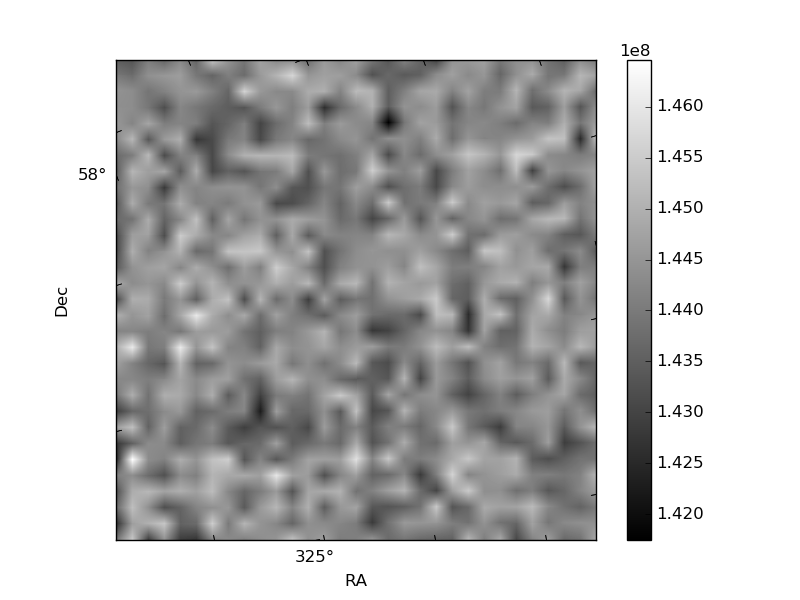
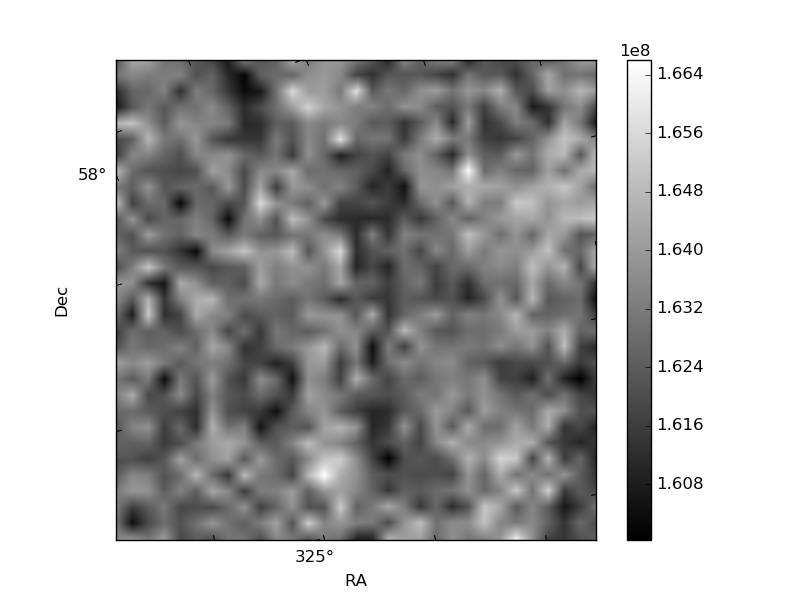
Histogram calculated using DETX and DETY for each event in the final _common_clean file
| Quadrant A | 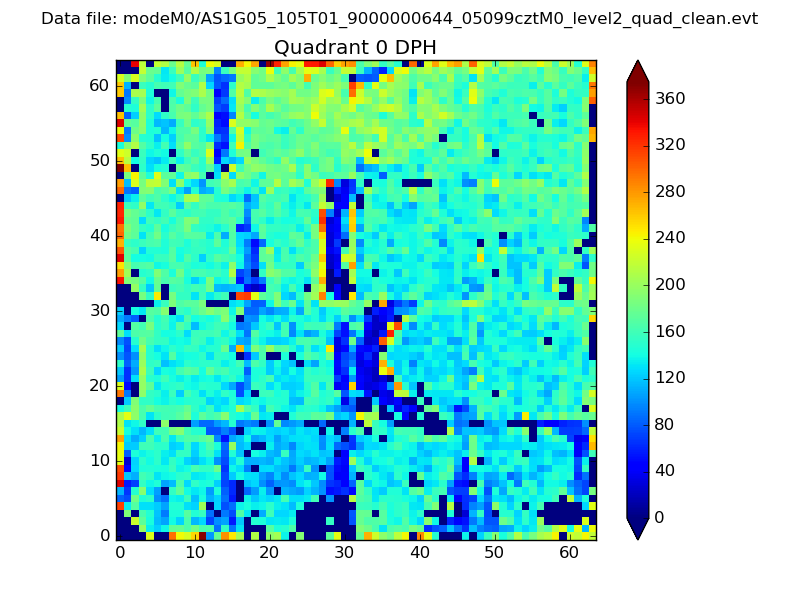 |
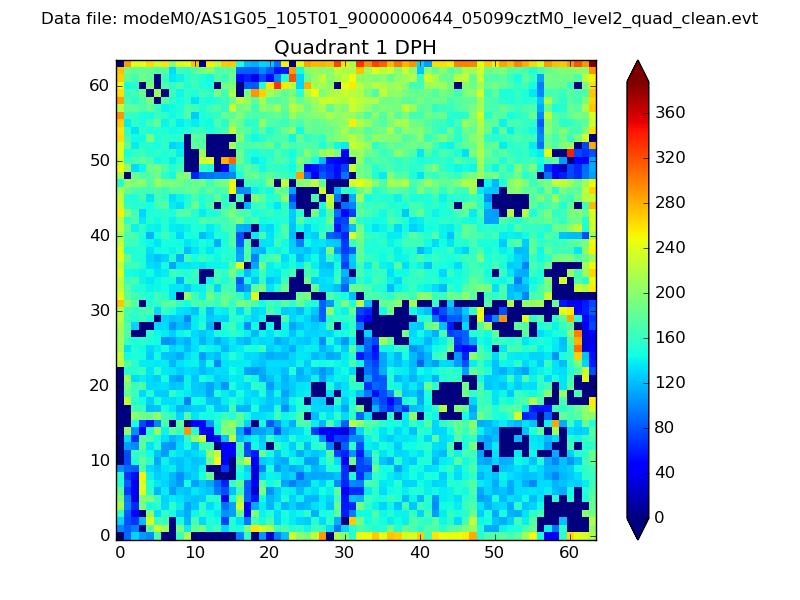 |
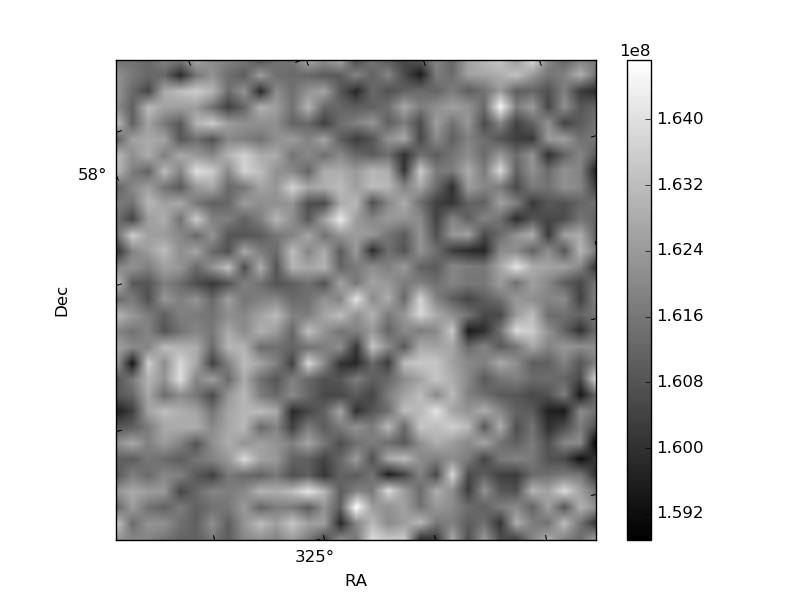
Quadrant B |
|---|---|---|---|
| Quadrant D | 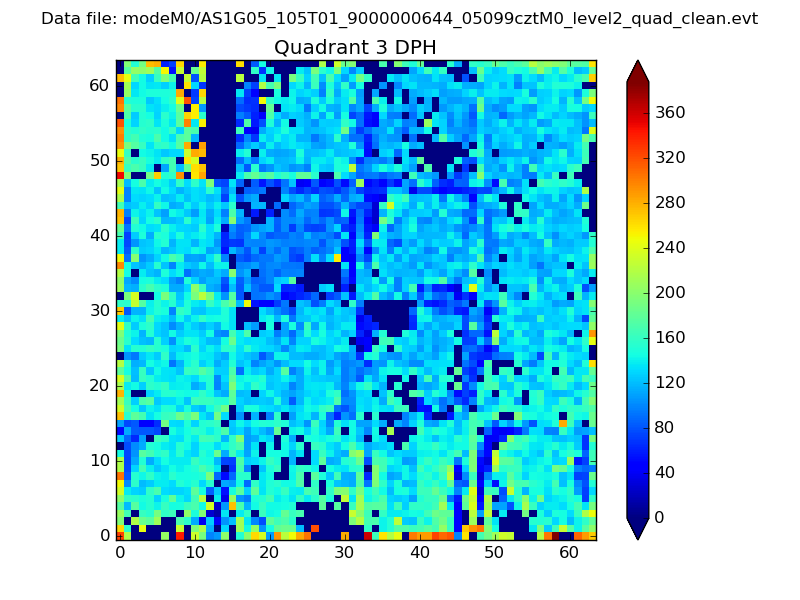 |
 |
Quadrant C |
| Plot type | Count rate plots | Images |
|---|---|---|
| Comparison with Poisson distribution Blue bars denote a histogram of data divided into 1 sec bins. Red curve is a Poisson curve with rate = median count rate of data. |
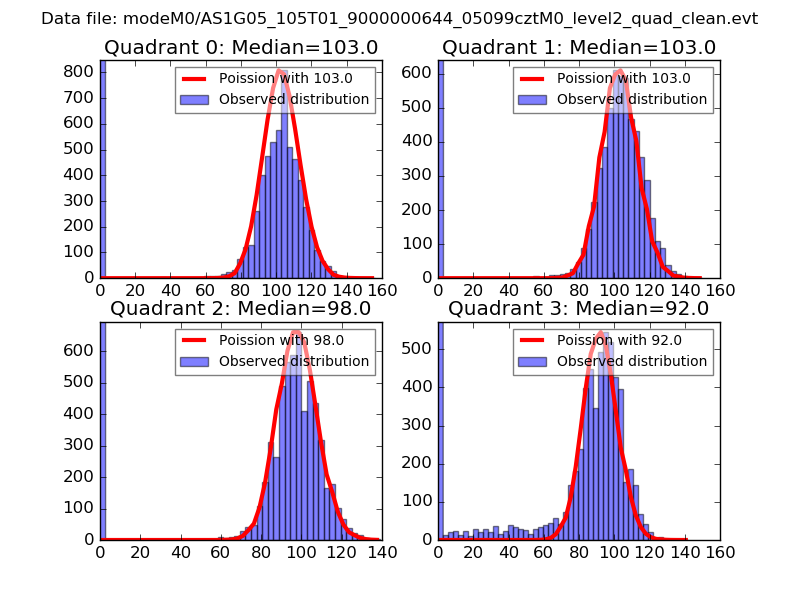 |
 |
| Quadrant-wise count rates Data is divided into 100 sec bins |
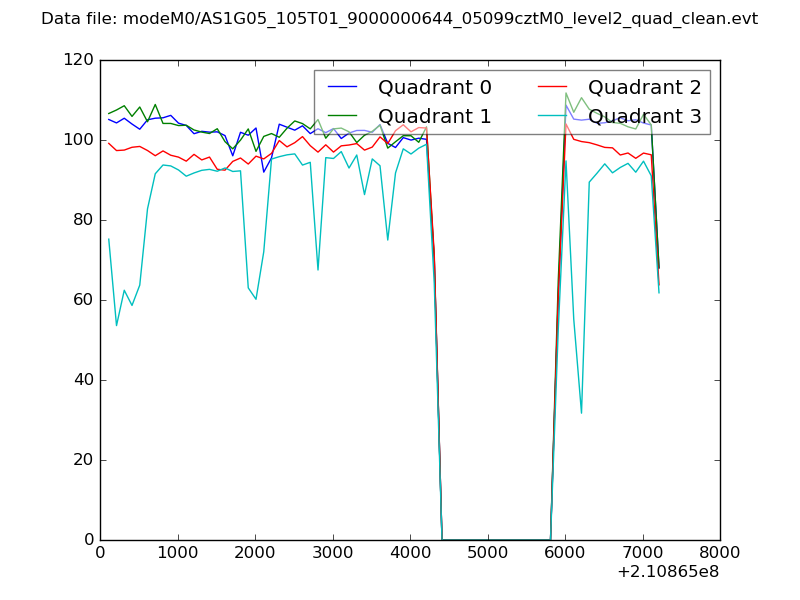 |
|
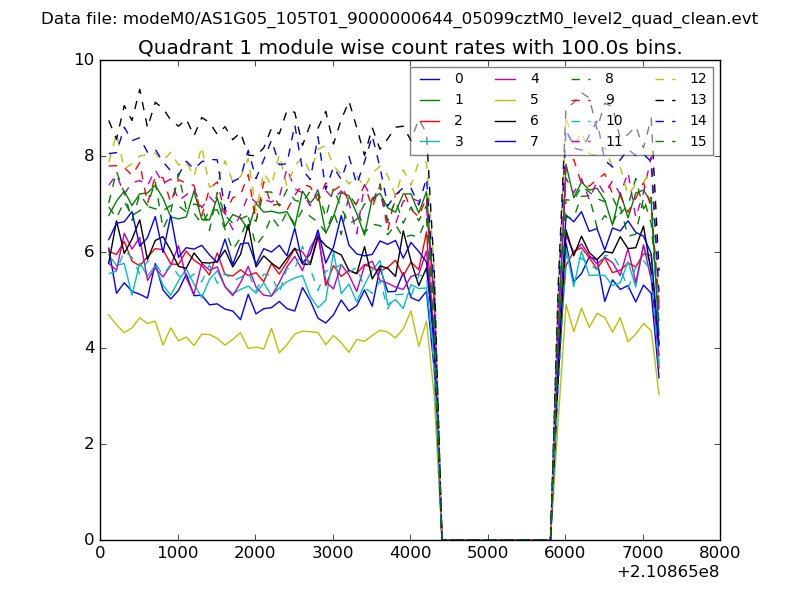
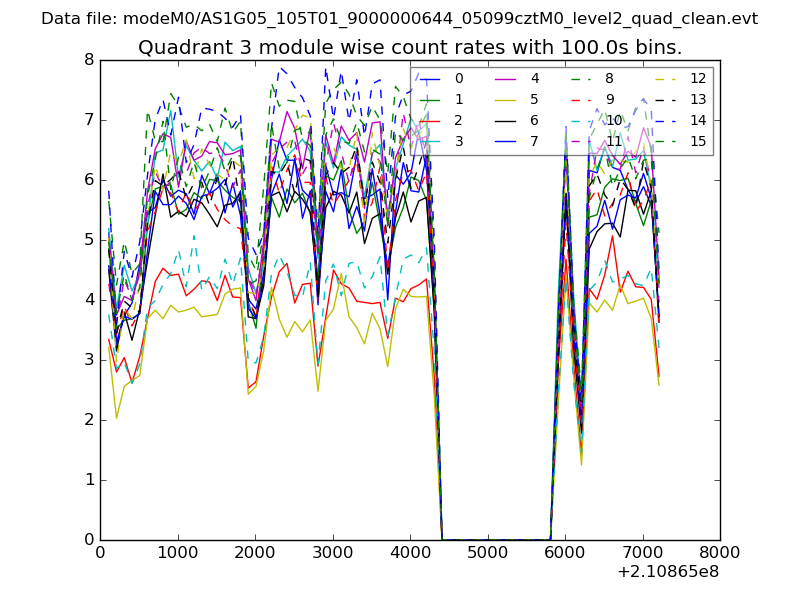
| Module-wise count rates for Quadrant A Data is divided into 100 sec bins |
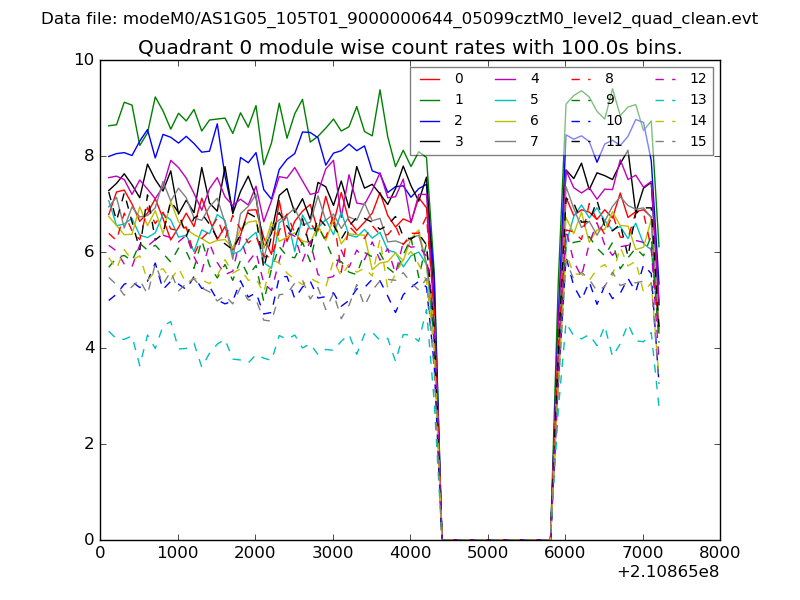 |
 |
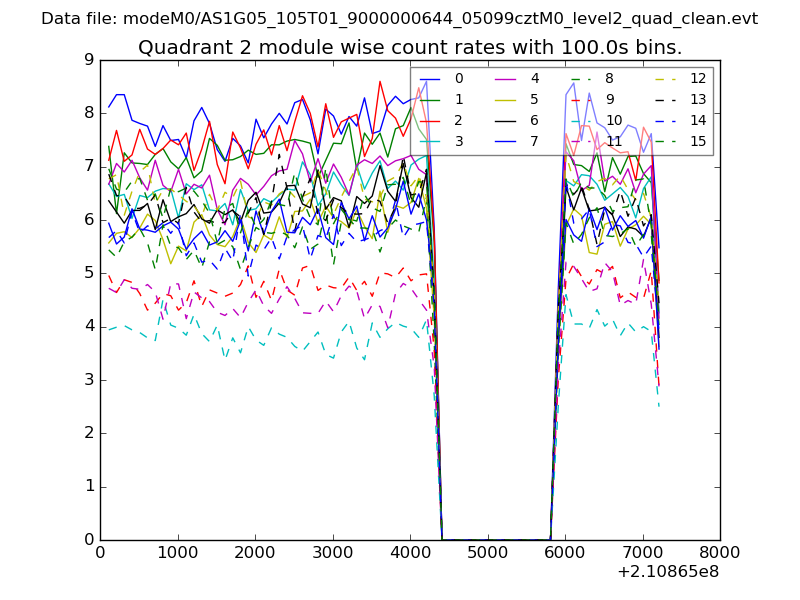
| Module-wise count rates for Quadrant B Data is divided into 100 sec bins |
 |
 |
| Module-wise count rates for Quadrant C Data is divided into 100 sec bins |
 |
 |
| Module-wise count rates for Quadrant D Data is divided into 100 sec bins |
 |
 |
| Parameter | Plot |
|---|---|
| CZT HV Monitor | 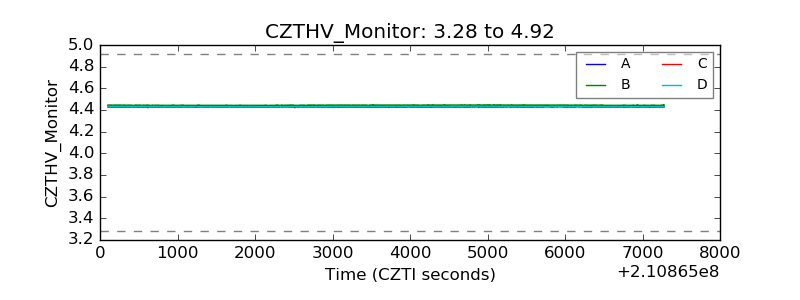 |
| D_VDD | 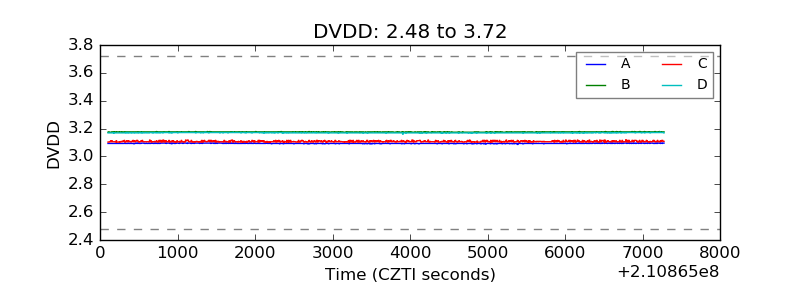 |
| Temperature 1 | 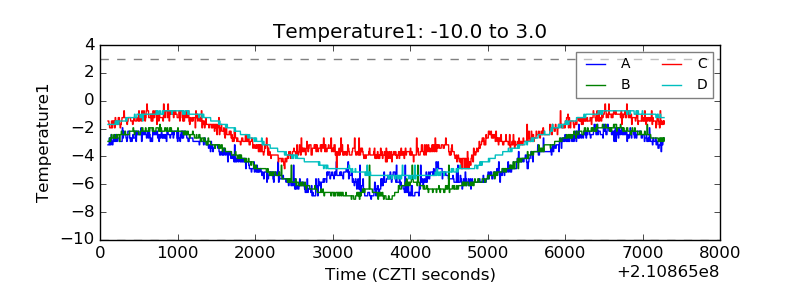 |
| Veto HV Monitor | 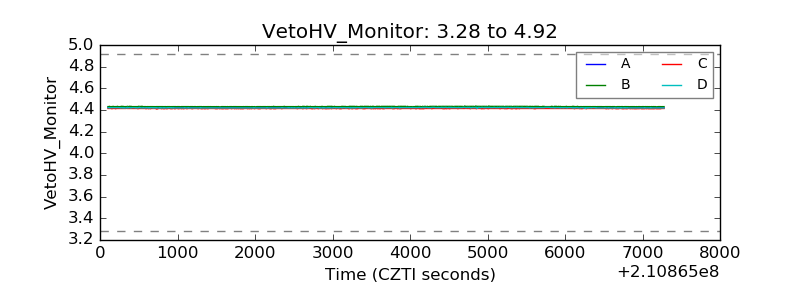 |
| Veto LLD | 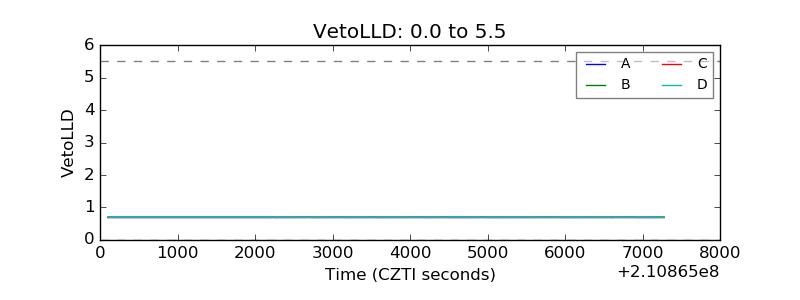 |
| Alpha Counter | 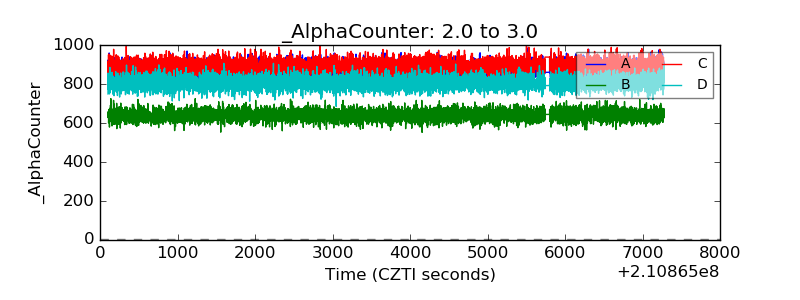 |
| _CPM_Rate | 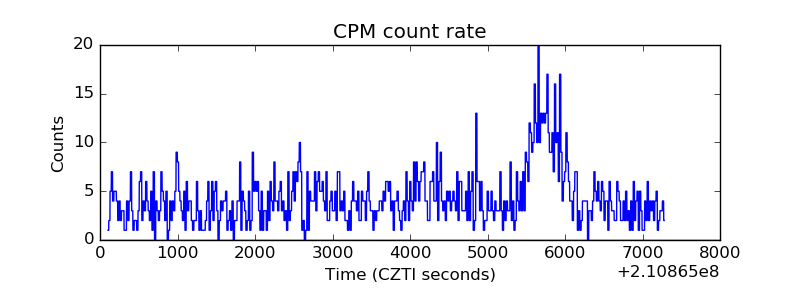 |
| CZT Counter | 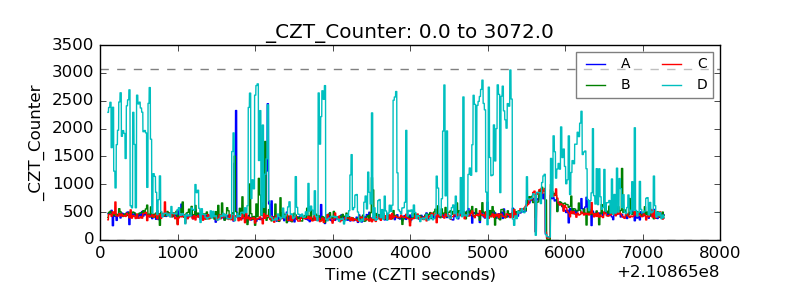 |
| +2.5 Volts monitor |  |
| +5 Volts monitor | 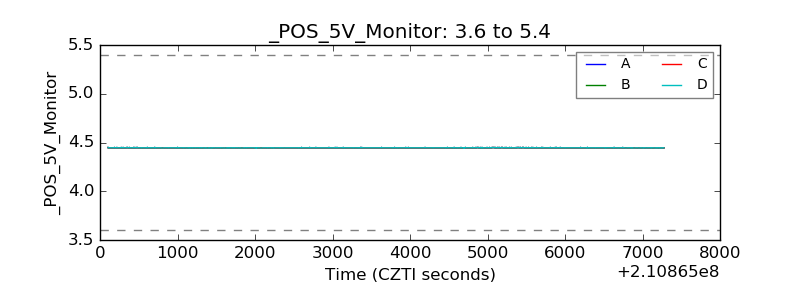 |
| _ROLL_ROT | 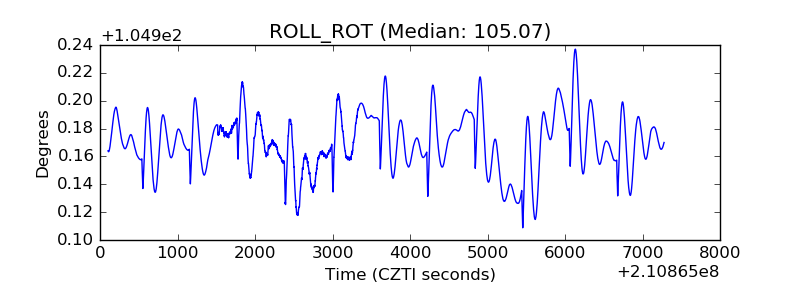 |
| _Roll_DEC | 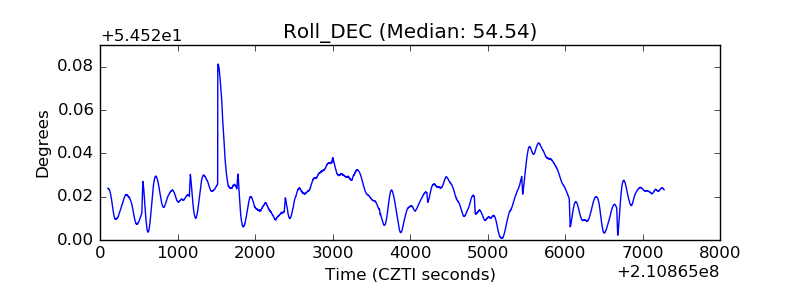 |
| _Roll_RA | 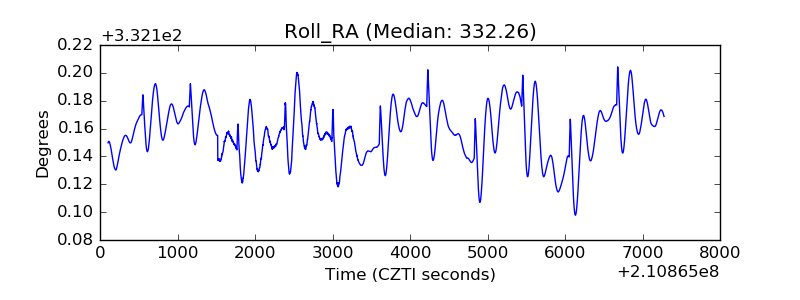 |
| Veto Counter | 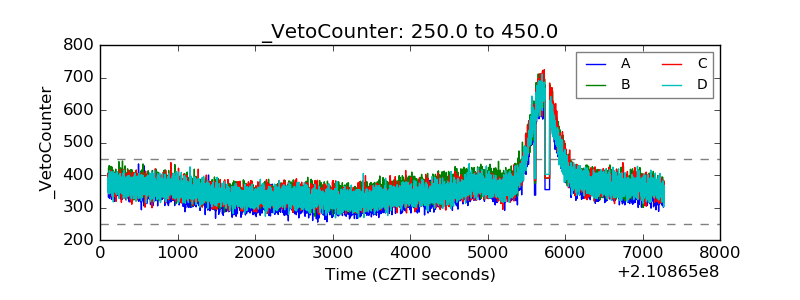 |