| Param | Original file | Final file |
|---|---|---|
| Filename | modeM0/AS1G05_105T01_9000000644_05100cztM0_level2.evt | modeM0/AS1G05_105T01_9000000644_05100cztM0_level2_quad_clean.evt |
| Size (bytes) | 638,285,760 | 94,541,760 |
| Size | 608.7 MB | 90.2 MB |
| Events in quadrant A | 3,510,245 | 620,640 |
| Events in quadrant B | 3,801,976 | 621,225 |
| Events in quadrant C | 3,367,774 | 591,464 |
| Events in quadrant D | 8,136,393 | 501,620 |
| Mode SS | |||
|---|---|---|---|
| Quadrant | BADHDUFLAG | Total packets | Discarded packets |
| A | 0 | 152 | 0 |
| B | 0 | 152 | 0 |
| C | 0 | 152 | 0 |
| D | 0 | 152 | 0 |
| Mode M9 | |||
|---|---|---|---|
| Quadrant | BADHDUFLAG | Total packets | Discarded packets |
| A | 0 | 2 | 0 |
| B | 0 | 2 | 0 |
| C | 0 | 2 | 0 |
| D | 0 | 2 | 0 |
| Mode M0 | |||
|---|---|---|---|
| Quadrant | BADHDUFLAG | Total packets | Discarded packets |
| A | 0 | 15916 | 2 |
| B | 0 | 16529 | 1 |
| C | 0 | 15614 | 1 |
| D | 0 | 29447 | 1 |
| Quadrant | Total seconds | Saturated seconds | Saturation percentage |
|---|---|---|---|
| A | 7584 | 117 | 1.542722% |
| B | 7584 | 156 | 2.056962% |
| C | 7584 | 93 | 1.226266% |
| D | 7584 | 1656 | 21.835443% |
Noise dominated data is calculated using 1-second bins in cleaned event files. If a bin has >2000 counts, and if more than 50% of those come from <1% of pixels, then it is considered to be noise-dominated and hence unusable.
| Quadrant | # 1 sec bins | Bins with >0 counts | Bins with >2000 counts | High rate bins dominated by noise | Noise dominated (total time) | Noise dominated (detector-on time) | Marked lightcurve |
|---|---|---|---|---|---|---|---|
| A | 7759 | 7585 | 11 | 11 | 0.14% | 0.15% | 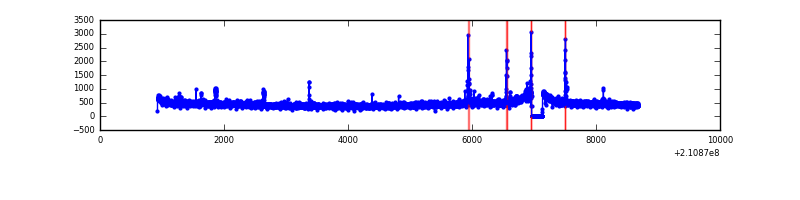 |
| B | 7759 | 7585 | 26 | 26 | 0.34% | 0.34% | 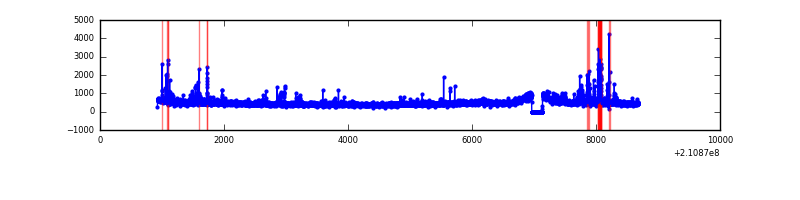 |
| C | 7759 | 7585 | 0 | 0 | 0.00% | 0.00% | 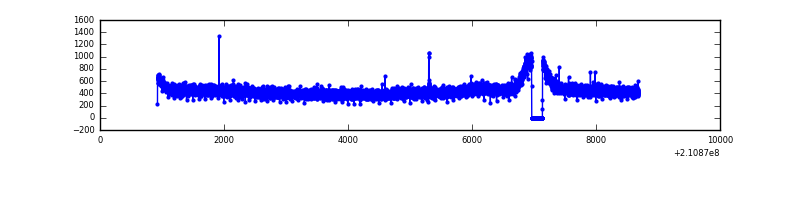 |
| D | 7759 | 7585 | 1146 | 1146 | 14.77% | 15.11% | 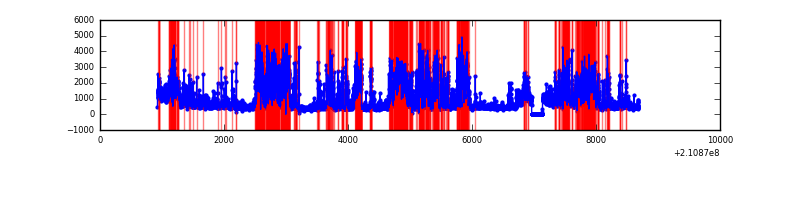 |
Top three noisy pixels from each quadrant. If the there are fewer than three noisy pixels in the level2.evt file, extra rows are filled as -1
| Pixel properties | Quadrant properties | ||||||
|---|---|---|---|---|---|---|---|
| Quadrant | DetID | PixID | Counts | Sigma | Mean | Median | Sigma |
| A | 0 | 50 | 44027 | 238.37 | 880 | 860 | 181.1 |
| A | 13 | 251 | 38827 | 209.65 | 880 | 860 | 181.1 |
| A | 0 | 247 | 22499 | 119.49 | 880 | 860 | 181.1 |
| B | 4 | 80 | 142663 | 822.92 | 888 | 866 | 172.3 |
| B | 10 | 16 | 106146 | 610.99 | 888 | 866 | 172.3 |
| B | 15 | 204 | 55250 | 315.62 | 888 | 866 | 172.3 |
| C | 8 | 128 | 16193 | 77.43 | 853 | 854 | 198.1 |
| C | 8 | 112 | 7886 | 35.5 | 853 | 854 | 198.1 |
| C | 13 | 61 | 6971 | 30.88 | 853 | 854 | 198.1 |
| D | 12 | 22 | 2683562 | 14086.98 | 775 | 750 | 190.4 |
| D | 13 | 239 | 1418033 | 7441.9 | 775 | 750 | 190.4 |
| D | 13 | 235 | 549842 | 2883.19 | 775 | 750 | 190.4 |
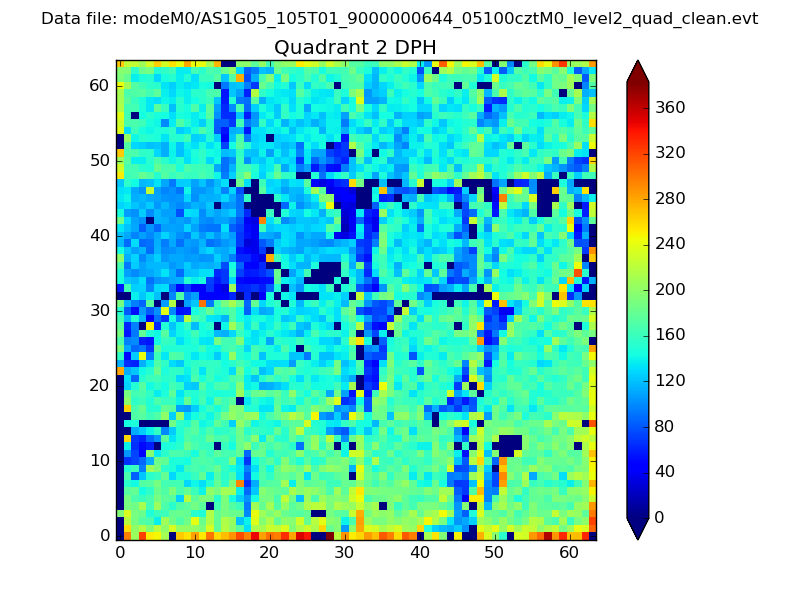
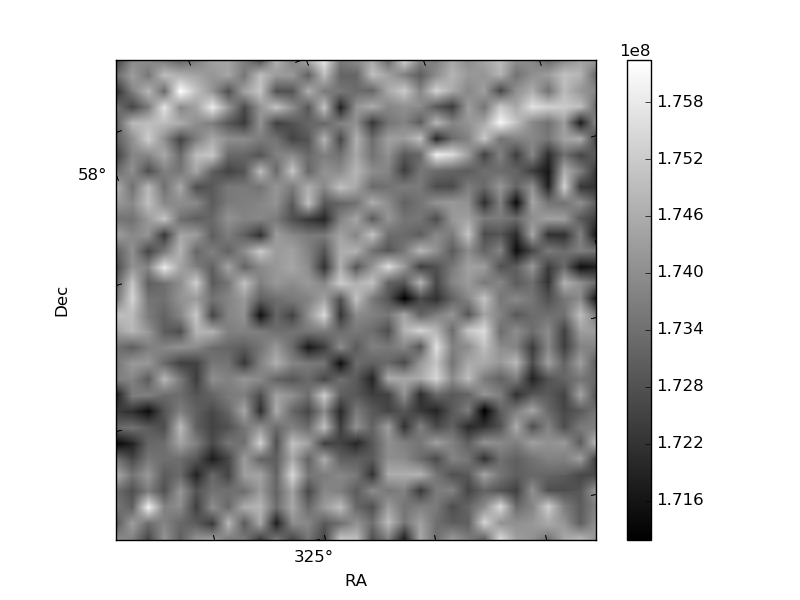
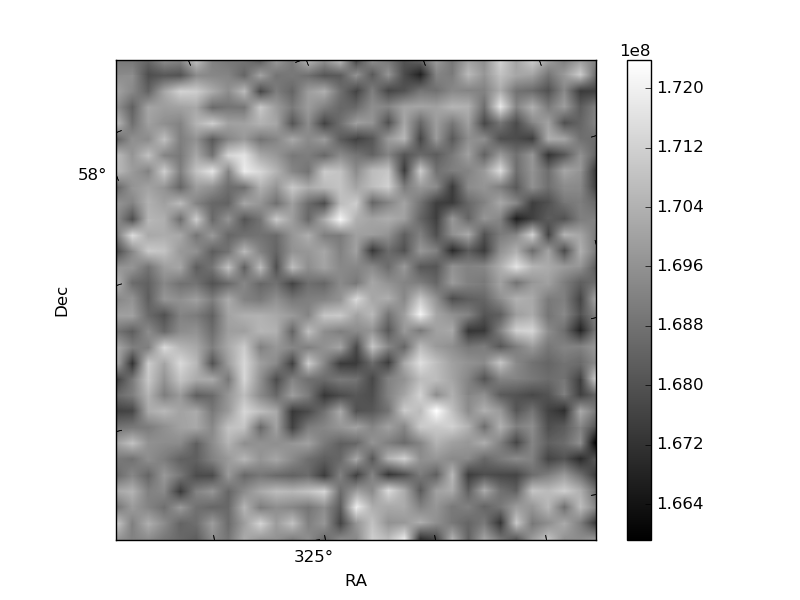
Histogram calculated using DETX and DETY for each event in the final _common_clean file
| Quadrant A | 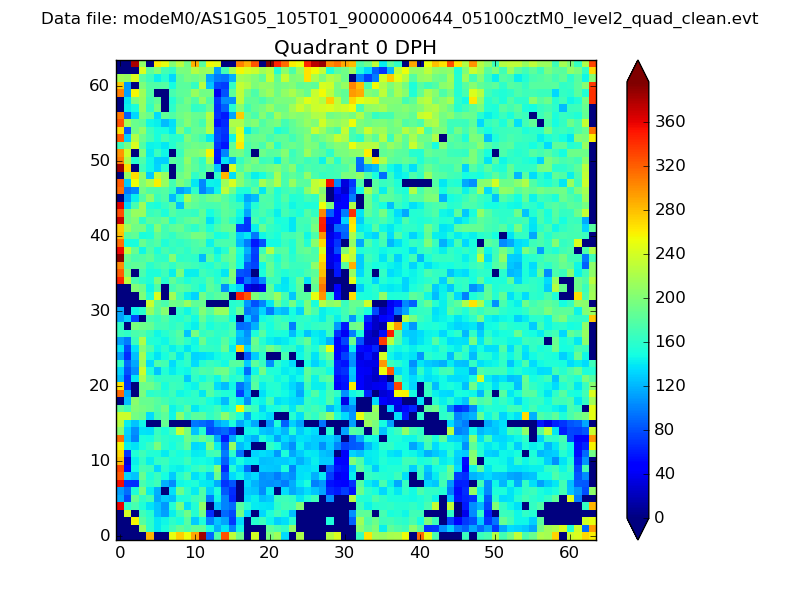 |
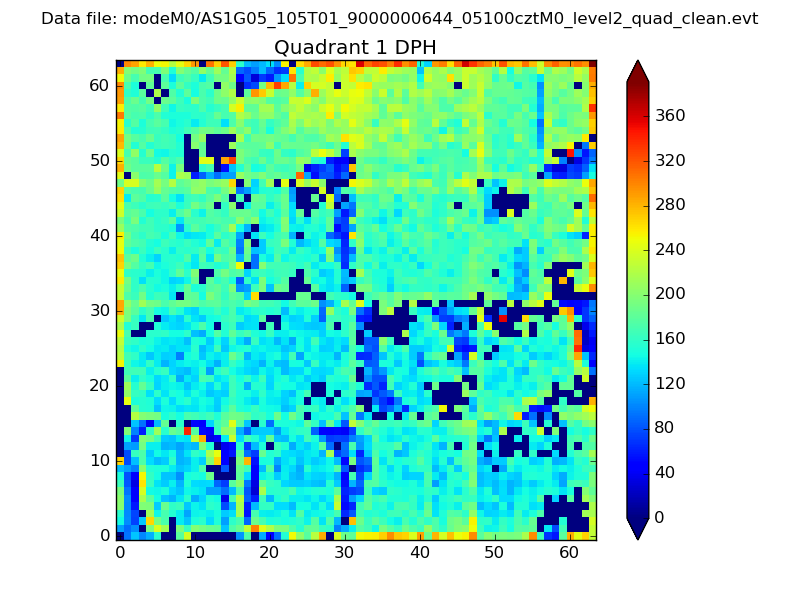 |
Quadrant B |
|---|---|---|---|
| Quadrant D | 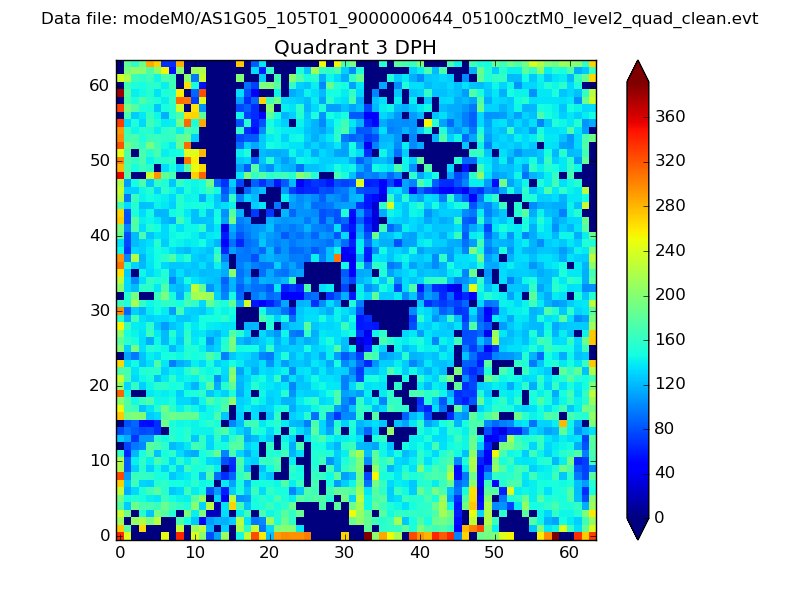 |
 |
Quadrant C |
| Plot type | Count rate plots | Images |
|---|---|---|
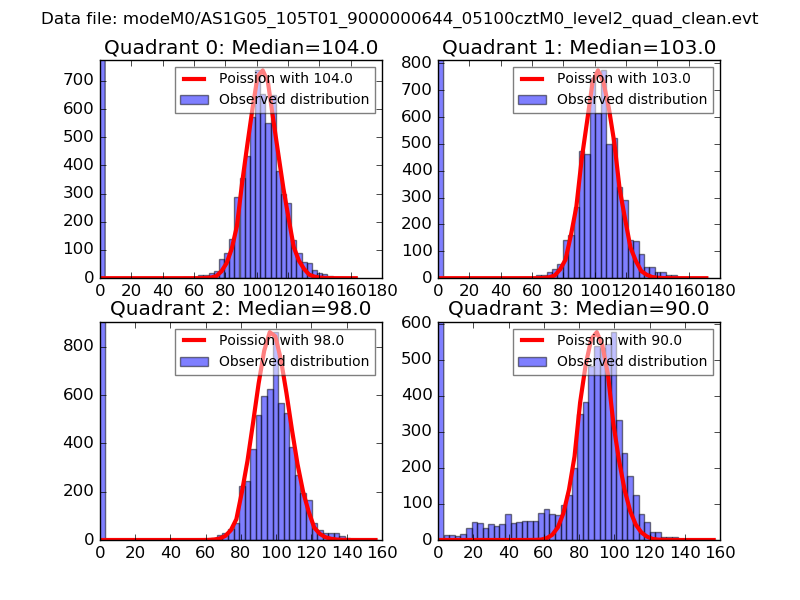
| Comparison with Poisson distribution Blue bars denote a histogram of data divided into 1 sec bins. Red curve is a Poisson curve with rate = median count rate of data. |
 |
 |
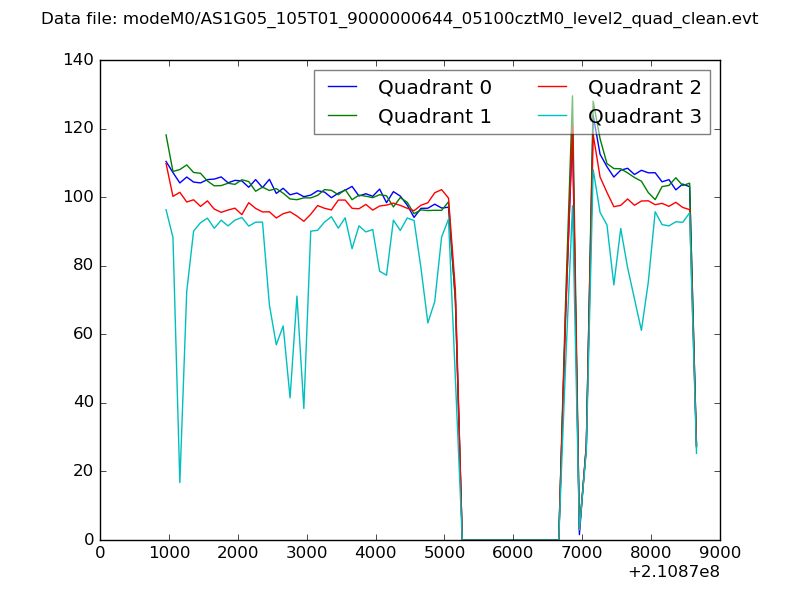
| Quadrant-wise count rates Data is divided into 100 sec bins |
 |
|
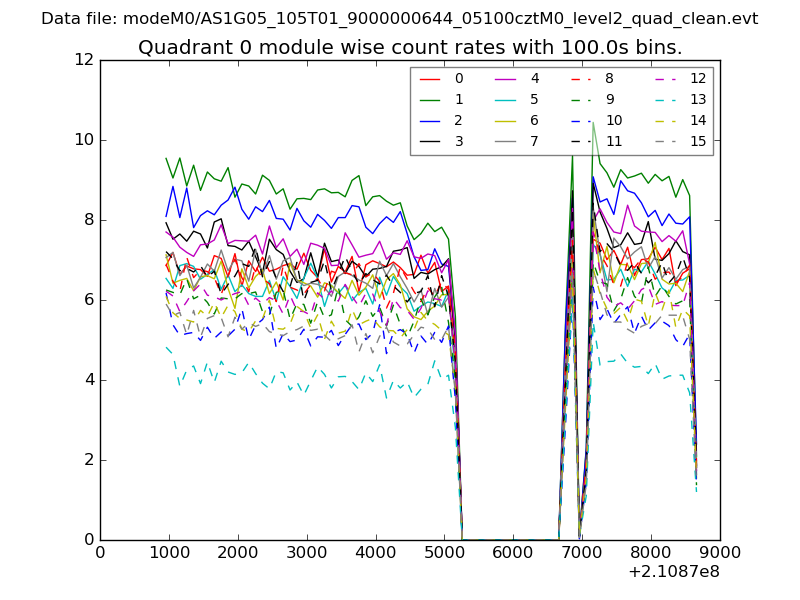
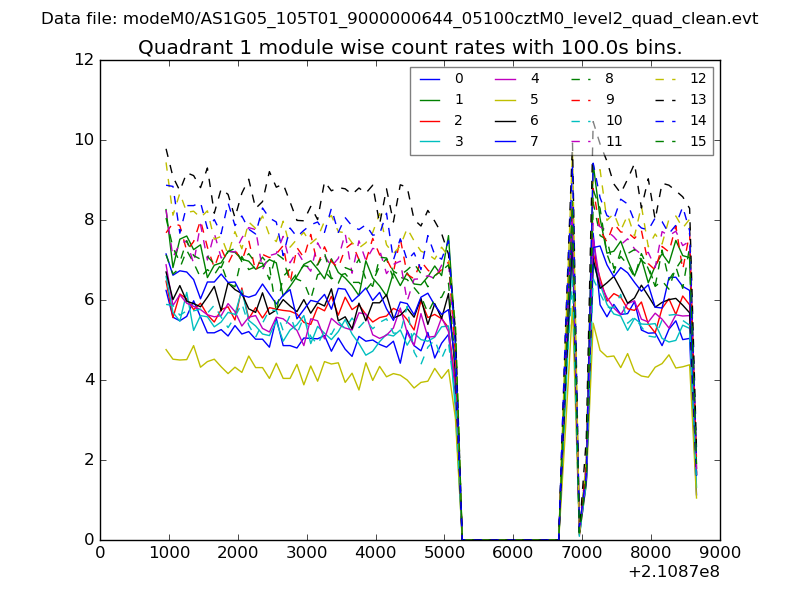
| Module-wise count rates for Quadrant A Data is divided into 100 sec bins |
 |
 |
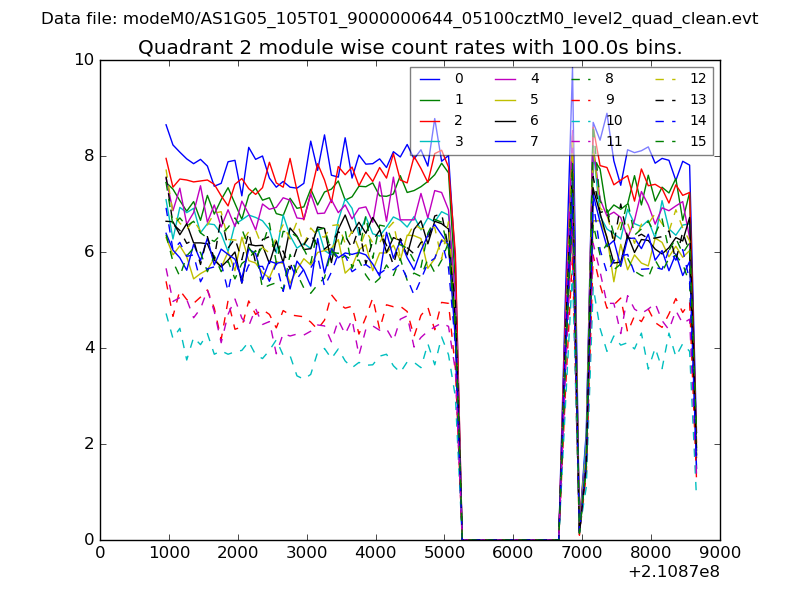
| Module-wise count rates for Quadrant B Data is divided into 100 sec bins |
 |
 |
| Module-wise count rates for Quadrant C Data is divided into 100 sec bins |
 |
 |
| Module-wise count rates for Quadrant D Data is divided into 100 sec bins |
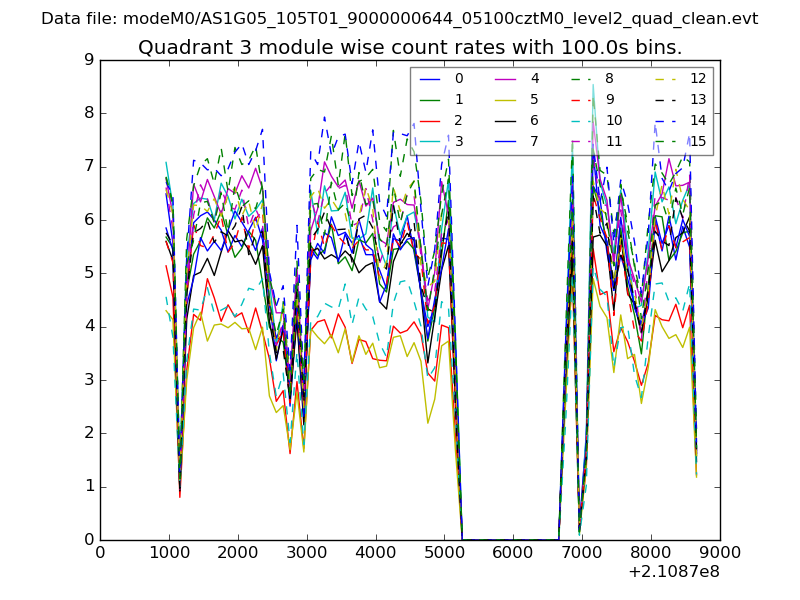 |
 |
| Parameter | Plot |
|---|---|
| CZT HV Monitor | 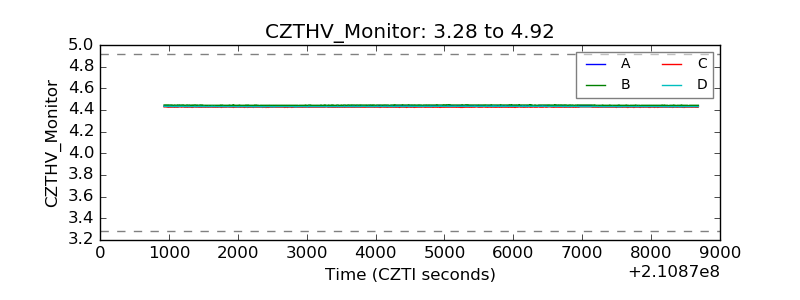 |
| D_VDD | 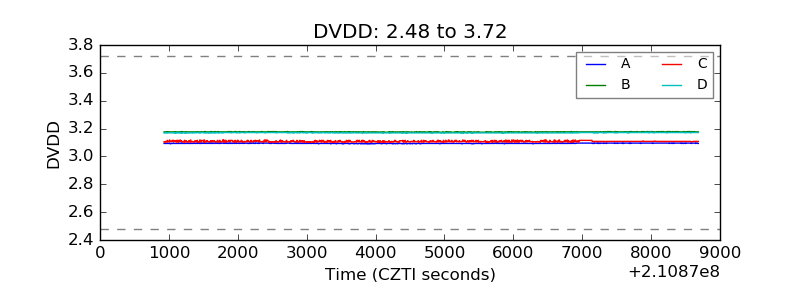 |
| Temperature 1 | 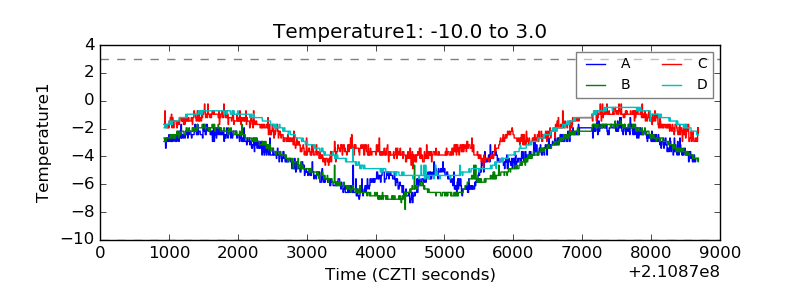 |
| Veto HV Monitor | 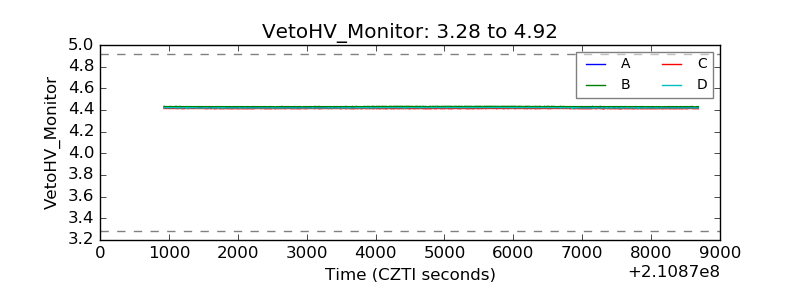 |
| Veto LLD | 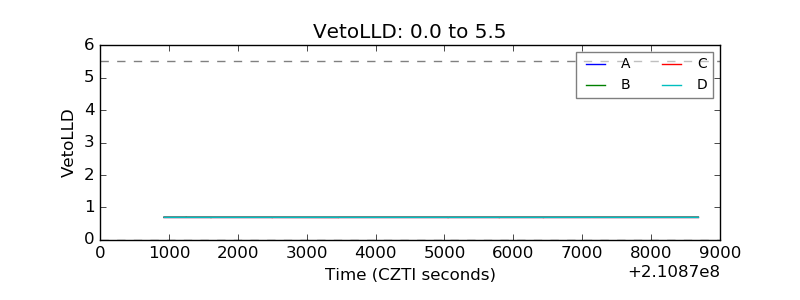 |
| Alpha Counter | 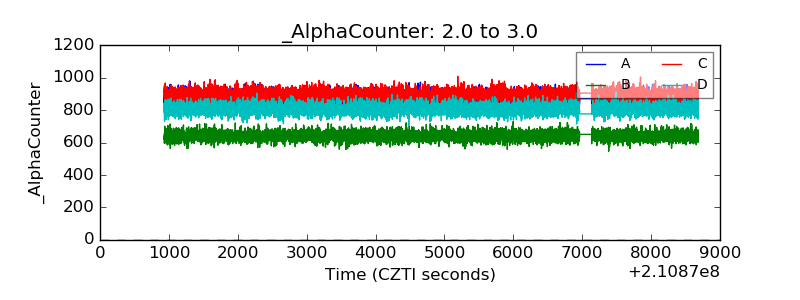 |
| _CPM_Rate | 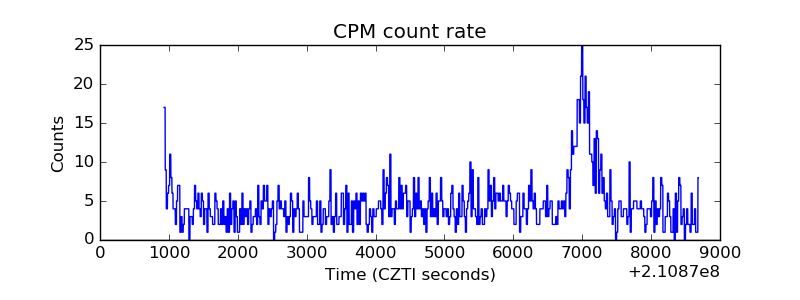 |
| CZT Counter | 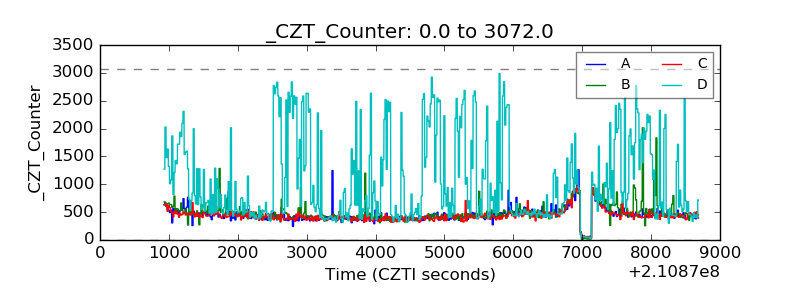 |
| +2.5 Volts monitor |  |
| +5 Volts monitor | 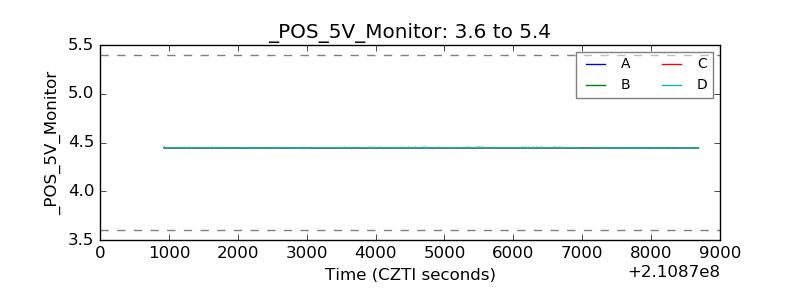 |
| _ROLL_ROT | 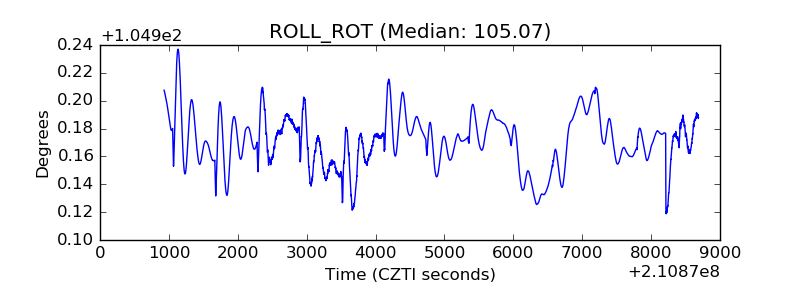 |
| _Roll_DEC | 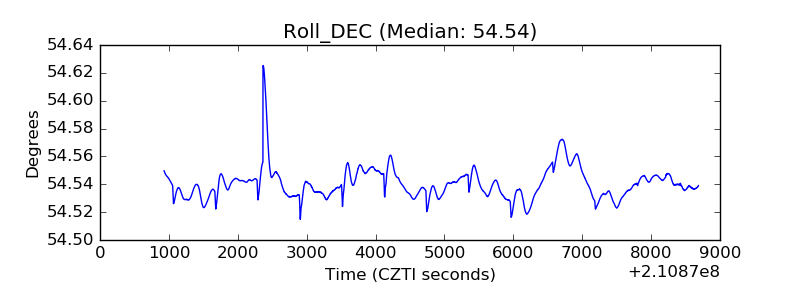 |
| _Roll_RA | 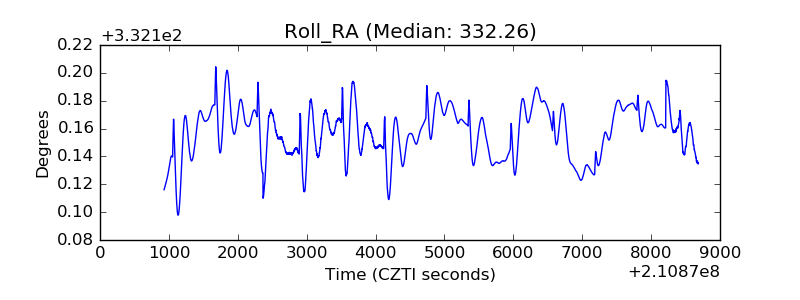 |
| Veto Counter | 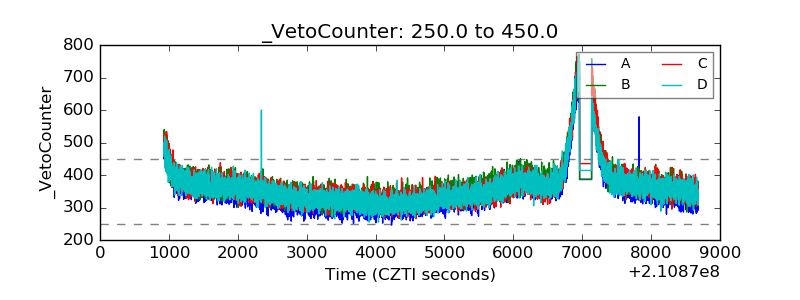 |