| Param | Original file | Final file |
|---|---|---|
| Filename | modeM0/AS1G05_105T01_9000000644_05103cztM0_level2.evt | modeM0/AS1G05_105T01_9000000644_05103cztM0_level2_quad_clean.evt |
| Size (bytes) | 1,488,605,760 | 212,935,680 |
| Size | 1.4 GB | 203.1 MB |
| Events in quadrant A | 8,167,182 | 1,382,880 |
| Events in quadrant B | 12,240,950 | 1,274,267 |
| Events in quadrant C | 7,691,427 | 1,334,353 |
| Events in quadrant D | 15,756,781 | 1,205,571 |
| Mode SS | |||
|---|---|---|---|
| Quadrant | BADHDUFLAG | Total packets | Discarded packets |
| A | 0 | 366 | 0 |
| B | 0 | 366 | 0 |
| C | 0 | 366 | 0 |
| D | 0 | 366 | 0 |
| Mode M9 | |||
|---|---|---|---|
| Quadrant | BADHDUFLAG | Total packets | Discarded packets |
| A | 0 | 20 | 0 |
| B | 0 | 20 | 0 |
| C | 0 | 20 | 0 |
| D | 0 | 20 | 0 |
| Mode M0 | |||
|---|---|---|---|
| Quadrant | BADHDUFLAG | Total packets | Discarded packets |
| A | 0 | 37763 | 4 |
| B | 0 | 48885 | 3 |
| C | 0 | 36716 | 3 |
| D | 0 | 59869 | 3 |
| Quadrant | Total seconds | Saturated seconds | Saturation percentage |
|---|---|---|---|
| A | 18157 | 92 | 0.506692% |
| B | 18157 | 1558 | 8.580713% |
| C | 18157 | 44 | 0.242331% |
| D | 18157 | 2789 | 15.360467% |
Noise dominated data is calculated using 1-second bins in cleaned event files. If a bin has >2000 counts, and if more than 50% of those come from <1% of pixels, then it is considered to be noise-dominated and hence unusable.
| Quadrant | # 1 sec bins | Bins with >0 counts | Bins with >2000 counts | High rate bins dominated by noise | Noise dominated (total time) | Noise dominated (detector-on time) | Marked lightcurve |
|---|---|---|---|---|---|---|---|
| A | 20062 | 18160 | 43 | 43 | 0.21% | 0.24% | 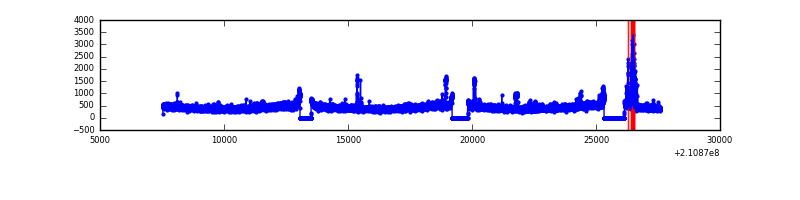 |
| B | 20062 | 18160 | 1212 | 1212 | 6.04% | 6.67% | 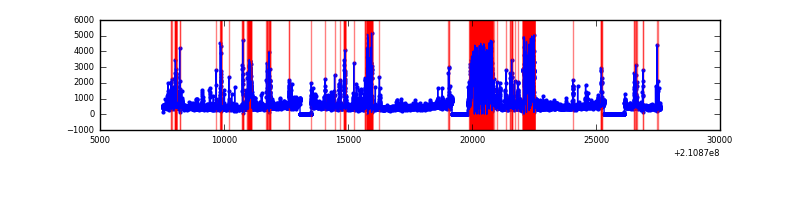 |
| C | 20062 | 18160 | 0 | 0 | 0.00% | 0.00% | 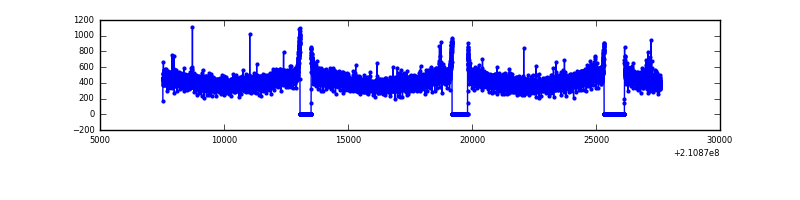 |
| D | 20062 | 18159 | 2246 | 2246 | 11.20% | 12.37% | 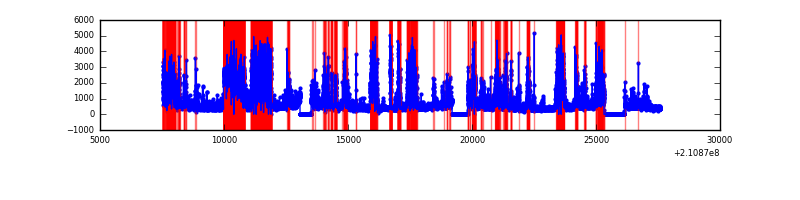 |
Top three noisy pixels from each quadrant. If the there are fewer than three noisy pixels in the level2.evt file, extra rows are filled as -1
| Pixel properties | Quadrant properties | ||||||
|---|---|---|---|---|---|---|---|
| Quadrant | DetID | PixID | Counts | Sigma | Mean | Median | Sigma |
| A | 13 | 251 | 235882 | 571.84 | 2013 | 1970 | 409.1 |
| A | 15 | 174 | 143327 | 345.57 | 2013 | 1970 | 409.1 |
| A | 0 | 50 | 45369 | 106.1 | 2013 | 1970 | 409.1 |
| B | 10 | 16 | 4278429 | 11580.27 | 1939 | 1890 | 369.3 |
| B | 4 | 80 | 162441 | 434.75 | 1939 | 1890 | 369.3 |
| B | 15 | 204 | 106156 | 282.34 | 1939 | 1890 | 369.3 |
| C | 1 | 16 | 24889 | 50.71 | 1958 | 1963 | 452.1 |
| C | 12 | 4 | 24700 | 50.29 | 1958 | 1963 | 452.1 |
| C | 13 | 61 | 15919 | 30.87 | 1958 | 1963 | 452.1 |
| D | 13 | 239 | 3454212 | 7799.85 | 1811 | 1755 | 442.6 |
| D | 13 | 235 | 2513517 | 5674.61 | 1811 | 1755 | 442.6 |
| D | 12 | 22 | 2131997 | 4812.68 | 1811 | 1755 | 442.6 |
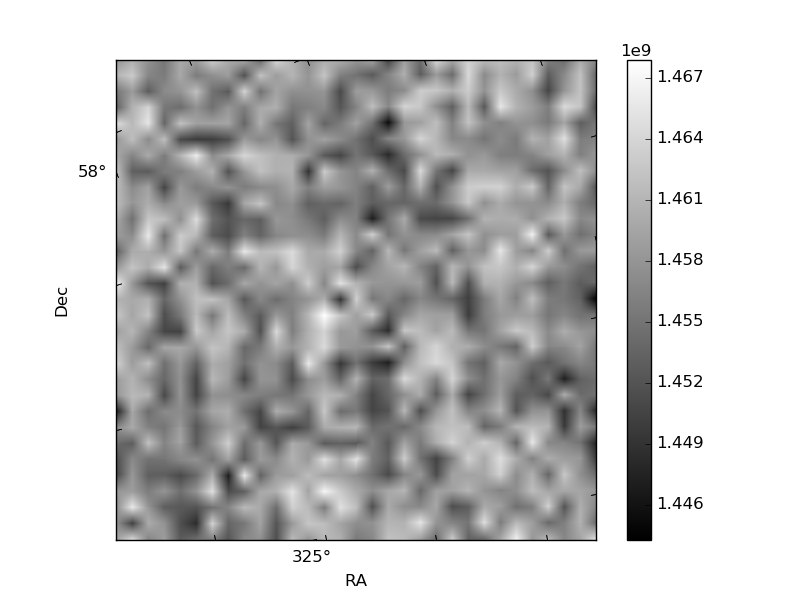
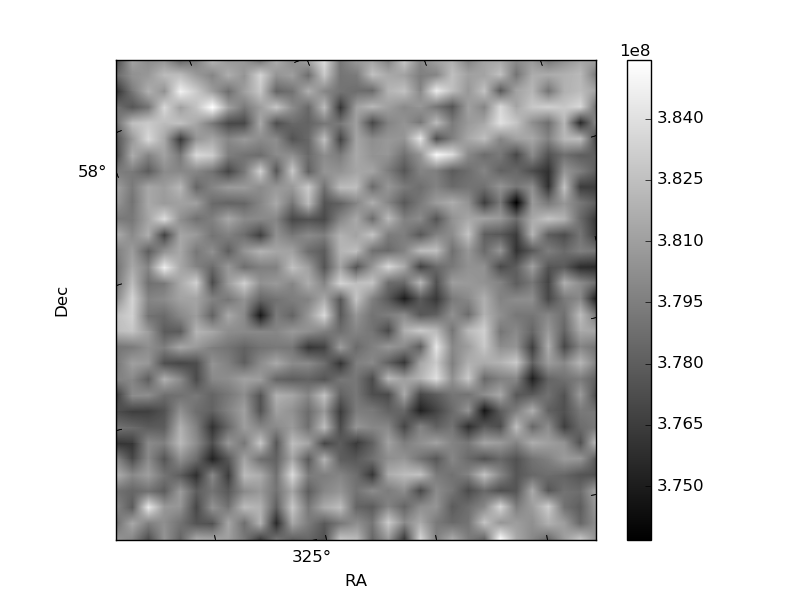
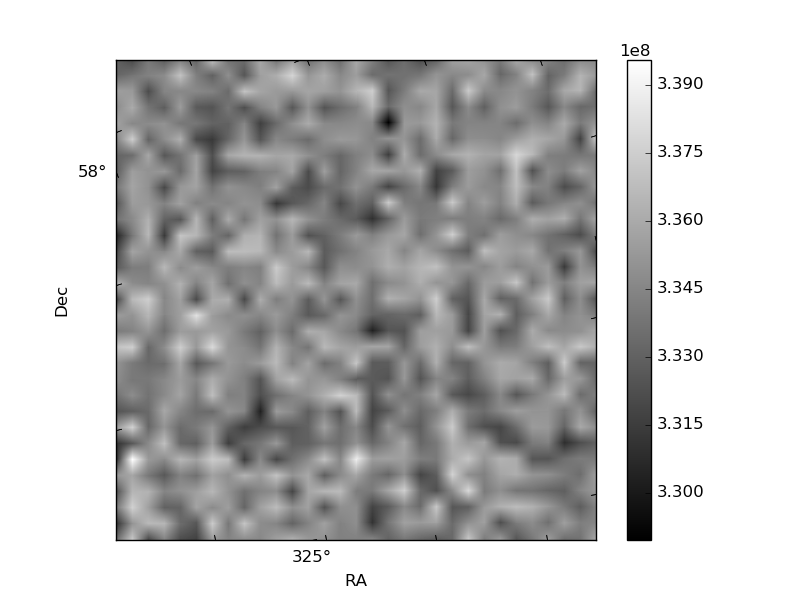
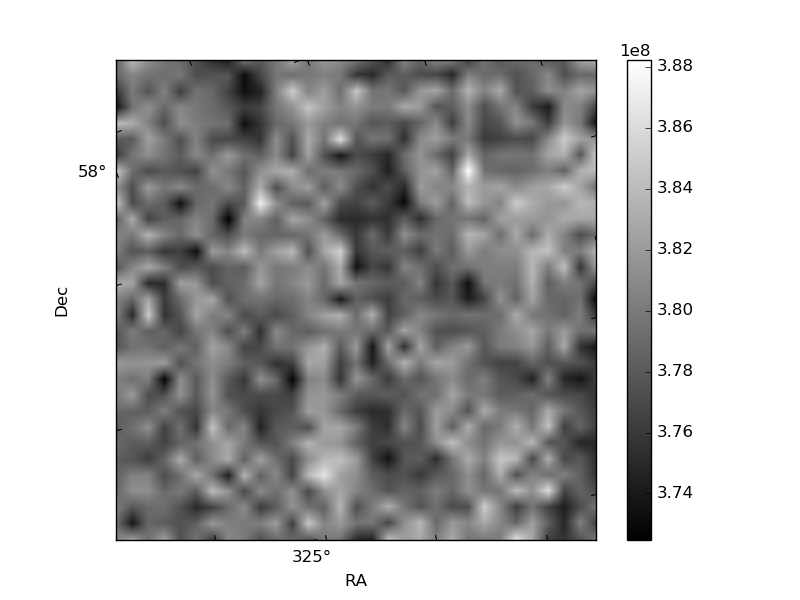
Histogram calculated using DETX and DETY for each event in the final _common_clean file
| Quadrant A | 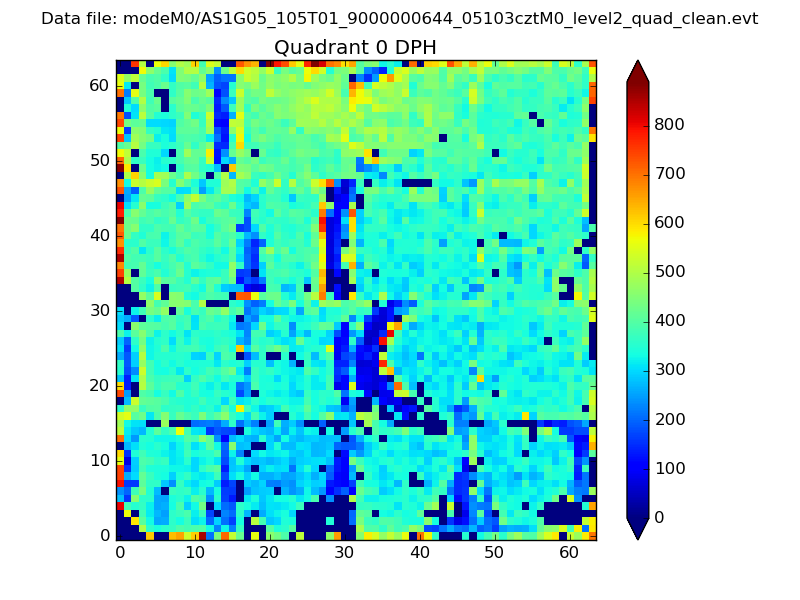 |
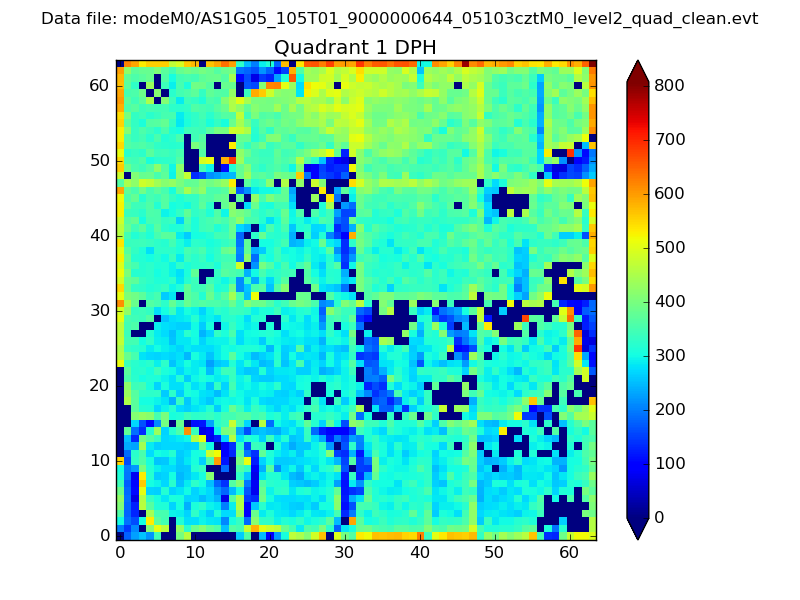 |
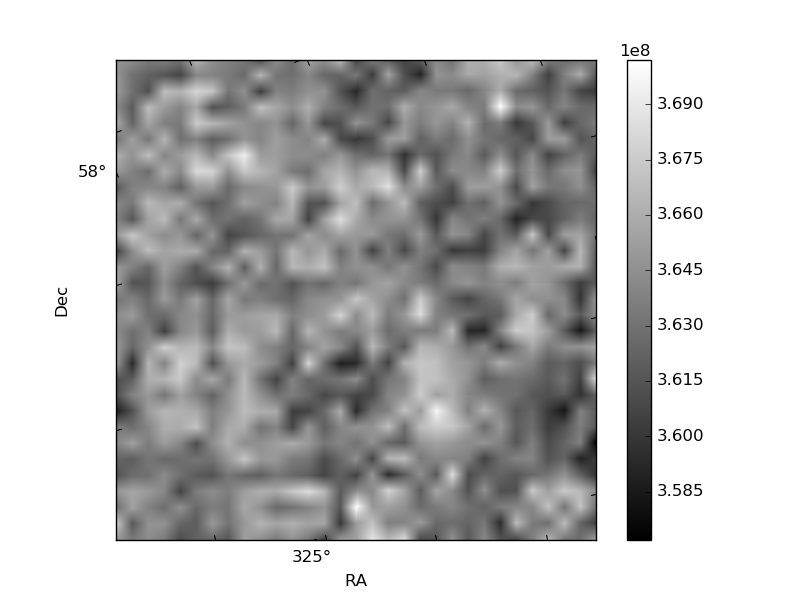
Quadrant B |
|---|---|---|---|
| Quadrant D | 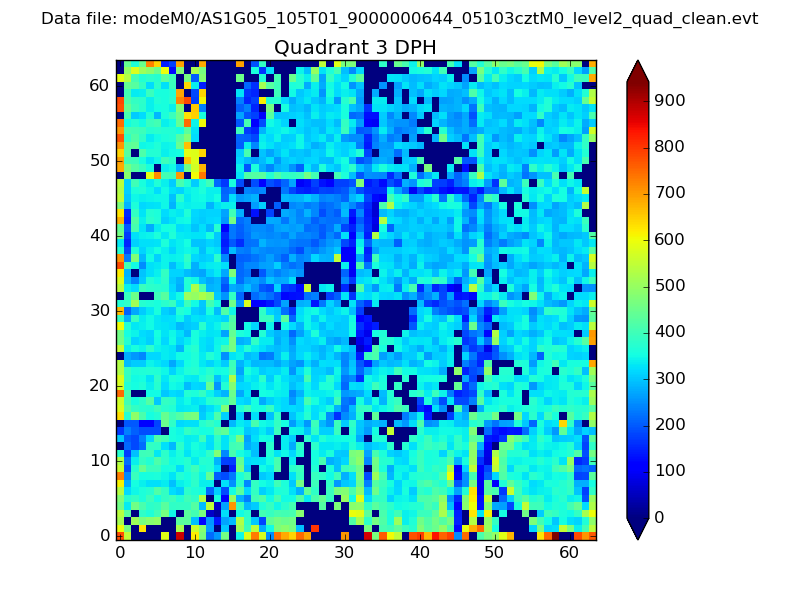 |
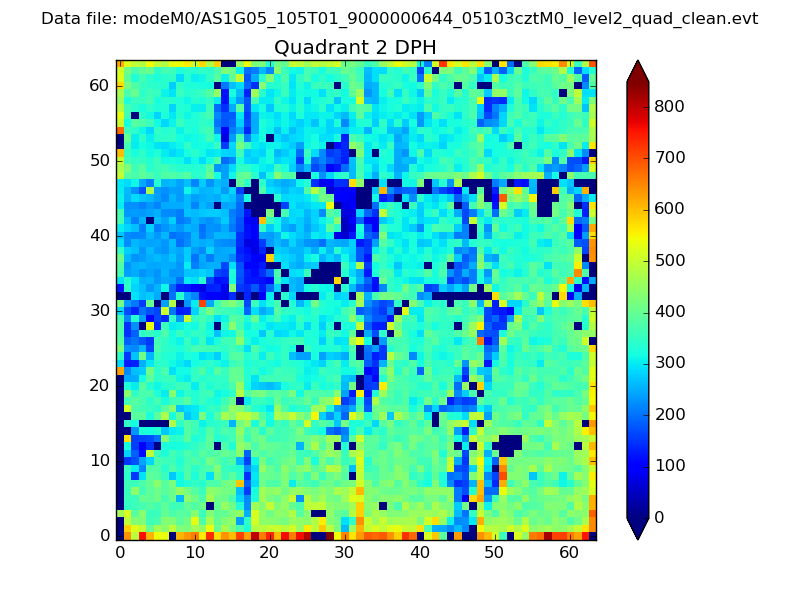 |
Quadrant C |
| Plot type | Count rate plots | Images |
|---|---|---|
| Comparison with Poisson distribution Blue bars denote a histogram of data divided into 1 sec bins. Red curve is a Poisson curve with rate = median count rate of data. |
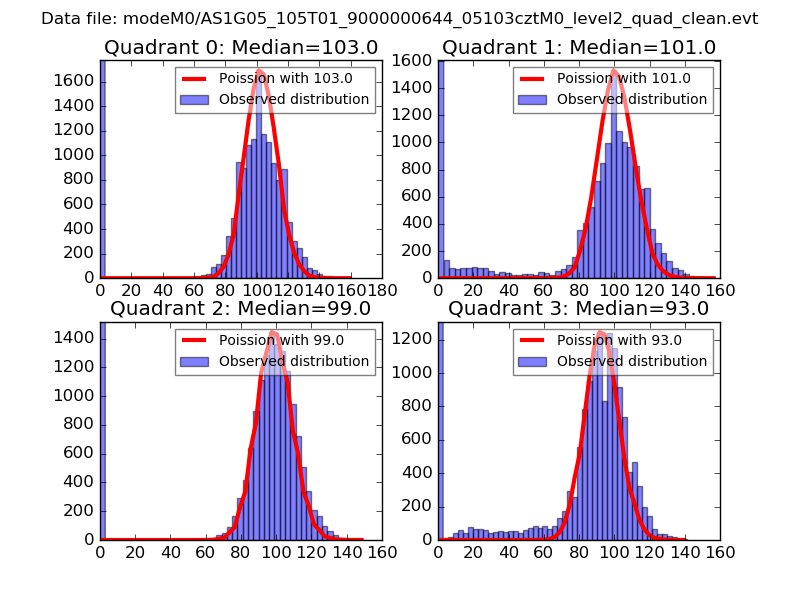 |
 |
| Quadrant-wise count rates Data is divided into 100 sec bins |
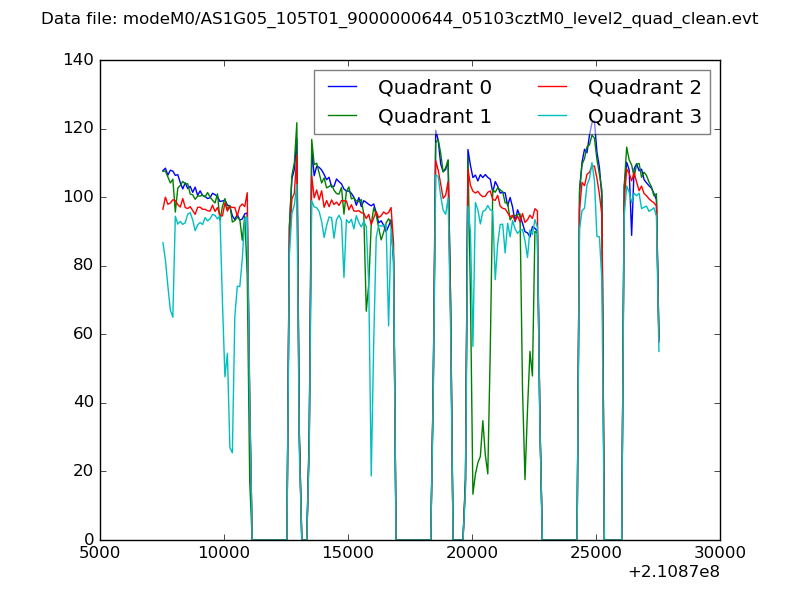 |
|
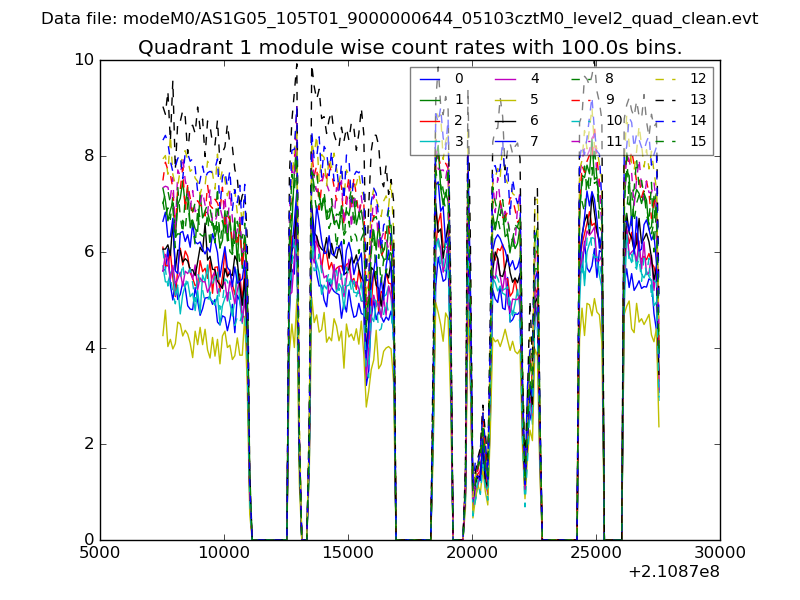
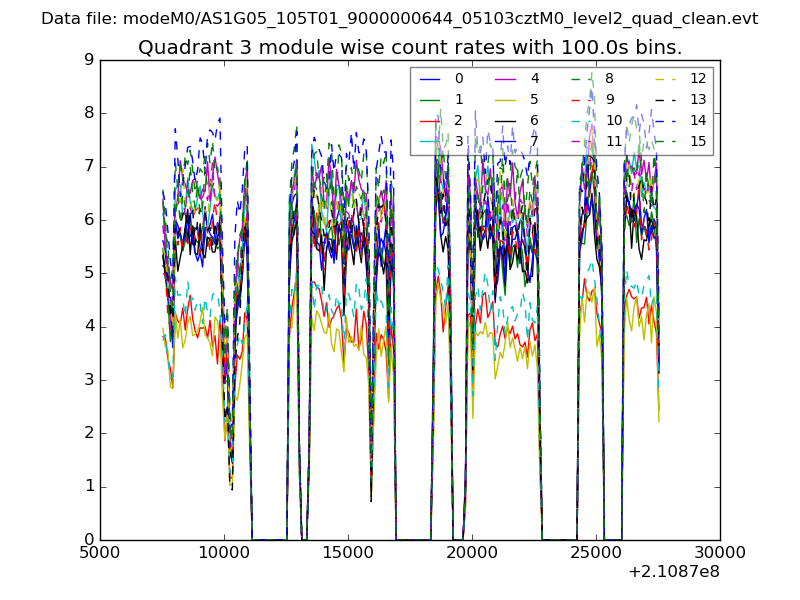
| Module-wise count rates for Quadrant A Data is divided into 100 sec bins |
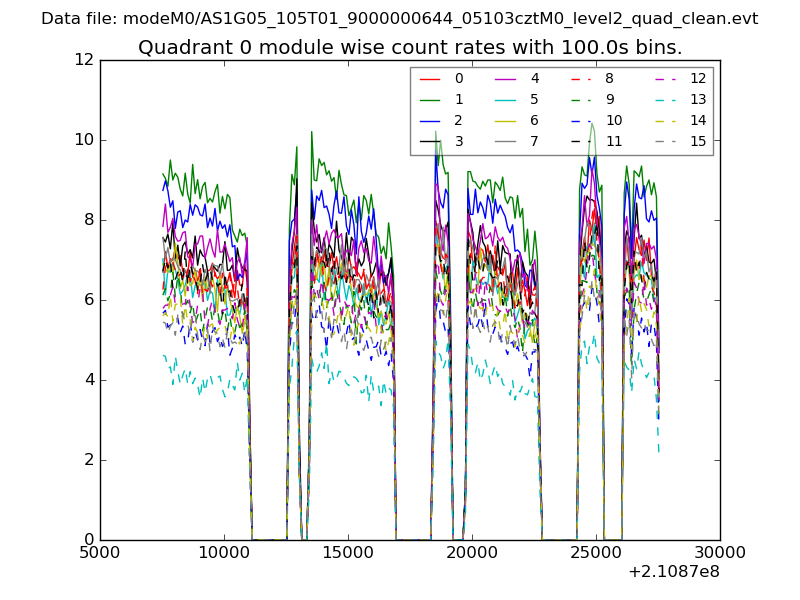 |
 |
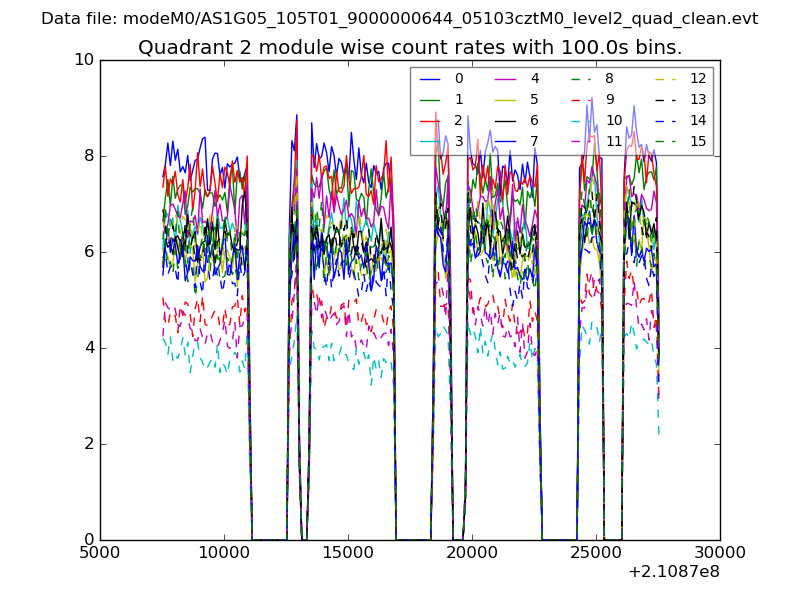
| Module-wise count rates for Quadrant B Data is divided into 100 sec bins |
 |
 |
| Module-wise count rates for Quadrant C Data is divided into 100 sec bins |
 |
 |
| Module-wise count rates for Quadrant D Data is divided into 100 sec bins |
 |
 |
| Parameter | Plot |
|---|---|
| CZT HV Monitor | 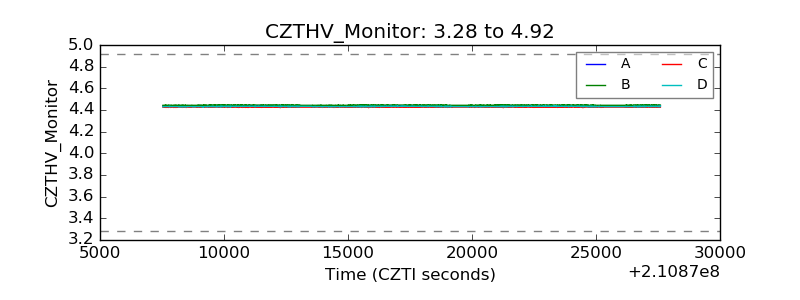 |
| D_VDD | 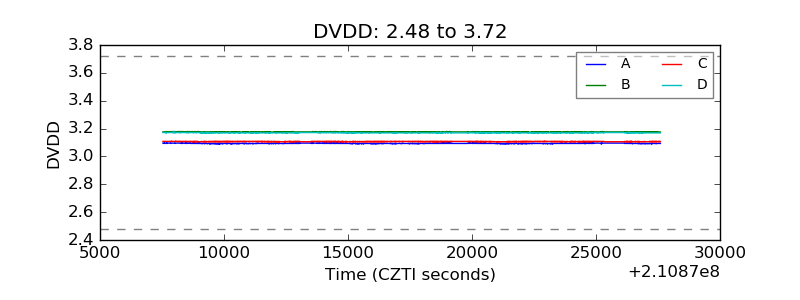 |
| Temperature 1 | 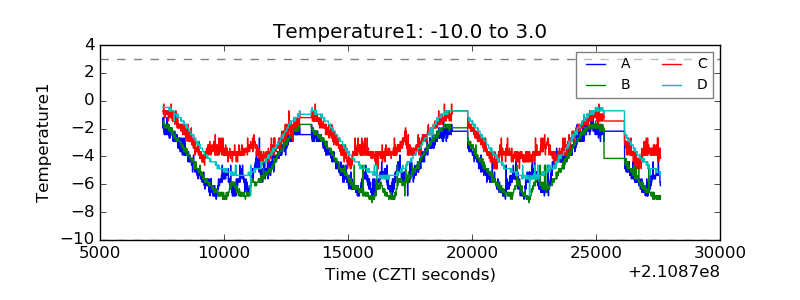 |
| Veto HV Monitor | 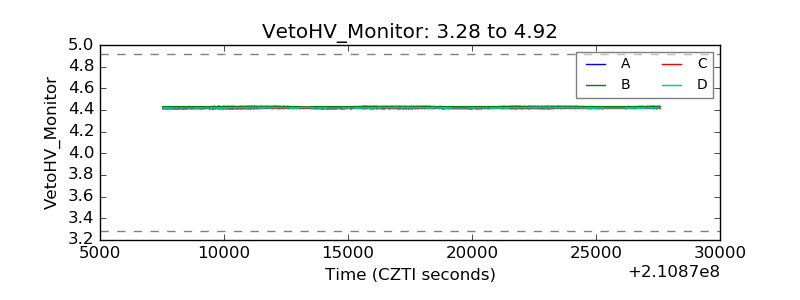 |
| Veto LLD | 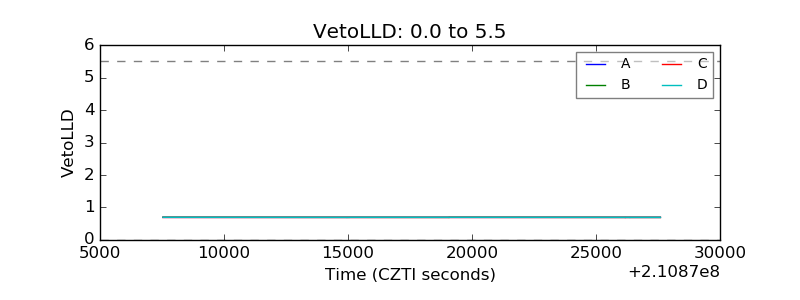 |
| Alpha Counter | 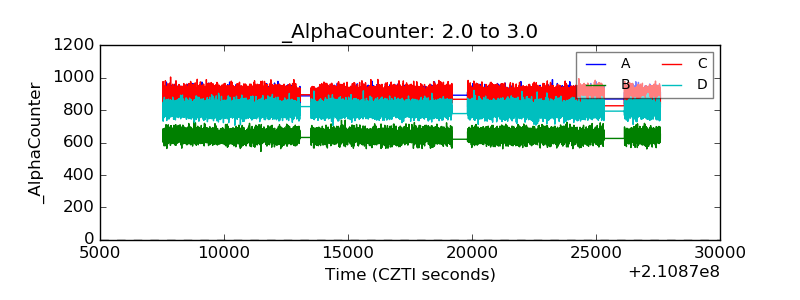 |
| _CPM_Rate | 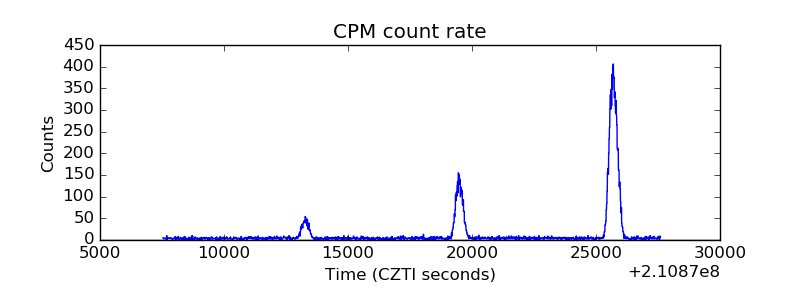 |
| CZT Counter | 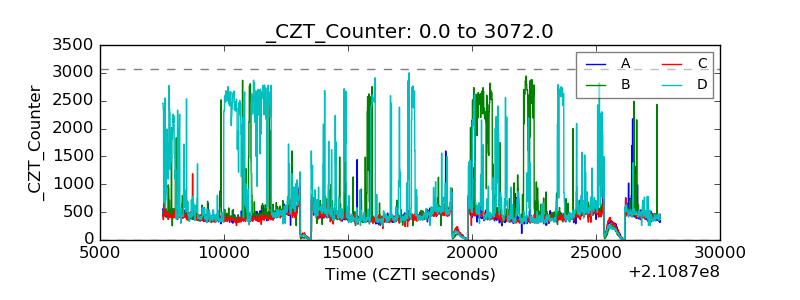 |
| +2.5 Volts monitor | 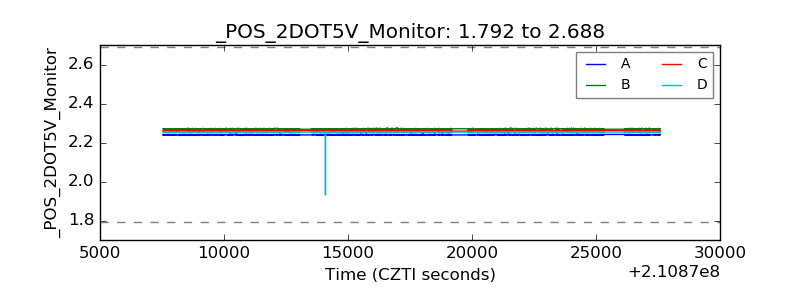 |
| +5 Volts monitor |  |
| _ROLL_ROT | 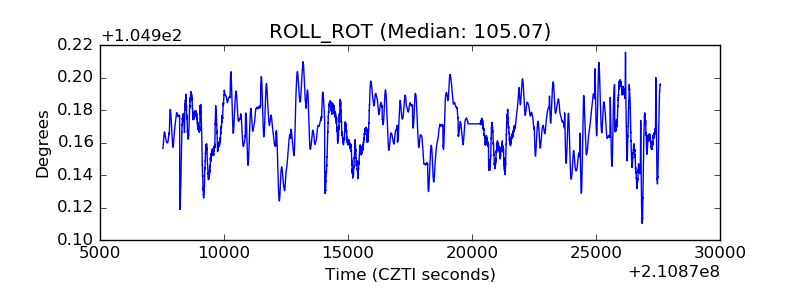 |
| _Roll_DEC | 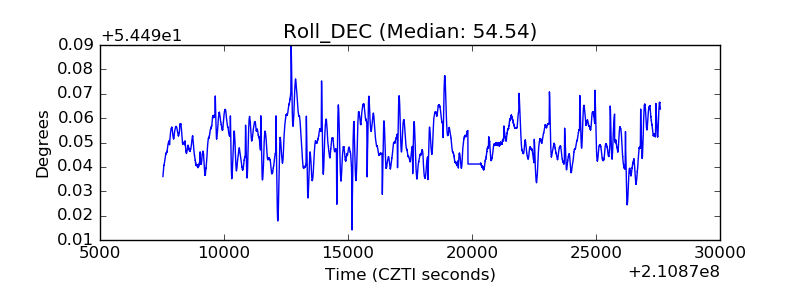 |
| _Roll_RA | 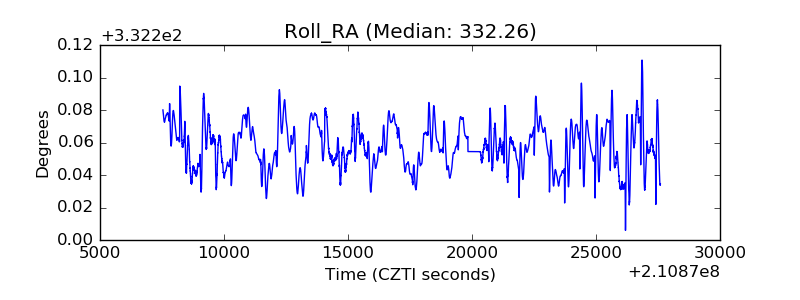 |
| Veto Counter | 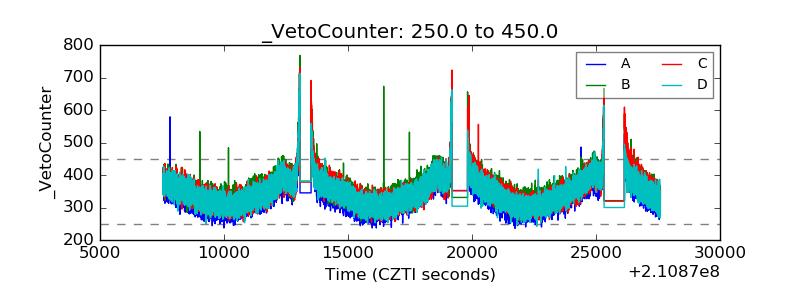 |