| Param | Original file | Final file |
|---|---|---|
| Filename | modeM0/AS1G05_105T01_9000000644_05104cztM0_level2.evt | modeM0/AS1G05_105T01_9000000644_05104cztM0_level2_quad_clean.evt |
| Size (bytes) | 499,714,560 | 85,844,160 |
| Size | 476.6 MB | 81.9 MB |
| Events in quadrant A | 3,328,046 | 548,905 |
| Events in quadrant B | 3,381,993 | 553,700 |
| Events in quadrant C | 2,890,771 | 533,622 |
| Events in quadrant D | 5,072,965 | 491,064 |
| Mode SS | |||
|---|---|---|---|
| Quadrant | BADHDUFLAG | Total packets | Discarded packets |
| A | 0 | 138 | 0 |
| B | 0 | 138 | 0 |
| C | 0 | 138 | 0 |
| D | 0 | 138 | 0 |
| Mode M9 | |||
|---|---|---|---|
| Quadrant | BADHDUFLAG | Total packets | Discarded packets |
| A | 0 | 18 | 0 |
| B | 0 | 18 | 0 |
| C | 0 | 18 | 0 |
| D | 0 | 18 | 0 |
| Mode M0 | |||
|---|---|---|---|
| Quadrant | BADHDUFLAG | Total packets | Discarded packets |
| A | 0 | 14864 | 3 |
| B | 0 | 14809 | 2 |
| C | 0 | 13722 | 2 |
| D | 0 | 19898 | 2 |
| Quadrant | Total seconds | Saturated seconds | Saturation percentage |
|---|---|---|---|
| A | 6779 | 65 | 0.958843% |
| B | 6779 | 91 | 1.342381% |
| C | 6779 | 12 | 0.177017% |
| D | 6779 | 605 | 8.924620% |
Noise dominated data is calculated using 1-second bins in cleaned event files. If a bin has >2000 counts, and if more than 50% of those come from <1% of pixels, then it is considered to be noise-dominated and hence unusable.
| Quadrant | # 1 sec bins | Bins with >0 counts | Bins with >2000 counts | High rate bins dominated by noise | Noise dominated (total time) | Noise dominated (detector-on time) | Marked lightcurve |
|---|---|---|---|---|---|---|---|
| A | 8554 | 6781 | 46 | 46 | 0.54% | 0.68% | 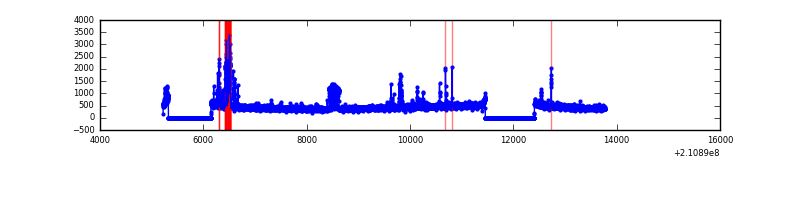 |
| B | 8554 | 6781 | 56 | 56 | 0.65% | 0.83% | 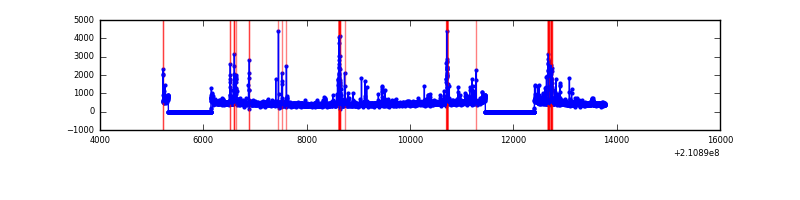 |
| C | 8554 | 6781 | 0 | 0 | 0.00% | 0.00% | 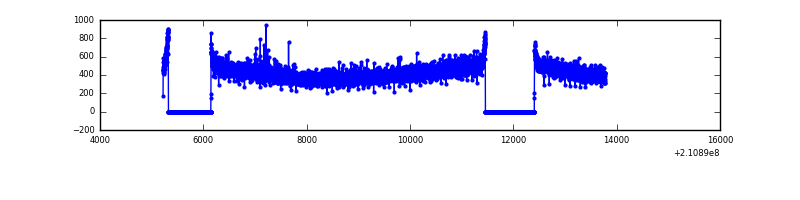 |
| D | 8554 | 6781 | 444 | 444 | 5.19% | 6.55% | 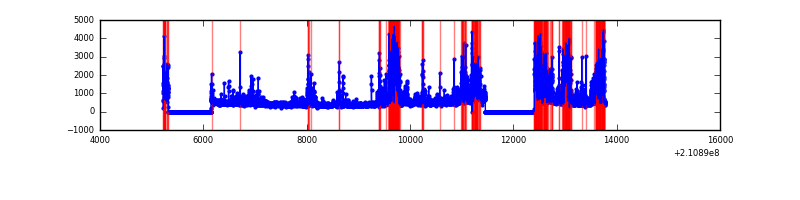 |
Top three noisy pixels from each quadrant. If the there are fewer than three noisy pixels in the level2.evt file, extra rows are filled as -1
| Pixel properties | Quadrant properties | ||||||
|---|---|---|---|---|---|---|---|
| Quadrant | DetID | PixID | Counts | Sigma | Mean | Median | Sigma |
| A | 13 | 251 | 221006 | 1423.66 | 753 | 737 | 154.7 |
| A | 15 | 174 | 138071 | 887.63 | 753 | 737 | 154.7 |
| A | 10 | 229 | 36332 | 230.06 | 753 | 737 | 154.7 |
| B | 10 | 16 | 248893 | 1703.66 | 764 | 747 | 145.7 |
| B | 5 | 250 | 92200 | 627.88 | 764 | 747 | 145.7 |
| B | 4 | 80 | 43173 | 291.28 | 764 | 747 | 145.7 |
| C | 12 | 4 | 15272 | 84.77 | 735 | 738 | 171.5 |
| C | 13 | 61 | 5915 | 30.2 | 735 | 738 | 171.5 |
| C | 1 | 16 | 4421 | 21.48 | 735 | 738 | 171.5 |
| D | 12 | 22 | 1239361 | 7199.38 | 699 | 677 | 172.1 |
| D | 13 | 239 | 543064 | 3152.42 | 699 | 677 | 172.1 |
| D | 2 | 136 | 194832 | 1128.45 | 699 | 677 | 172.1 |
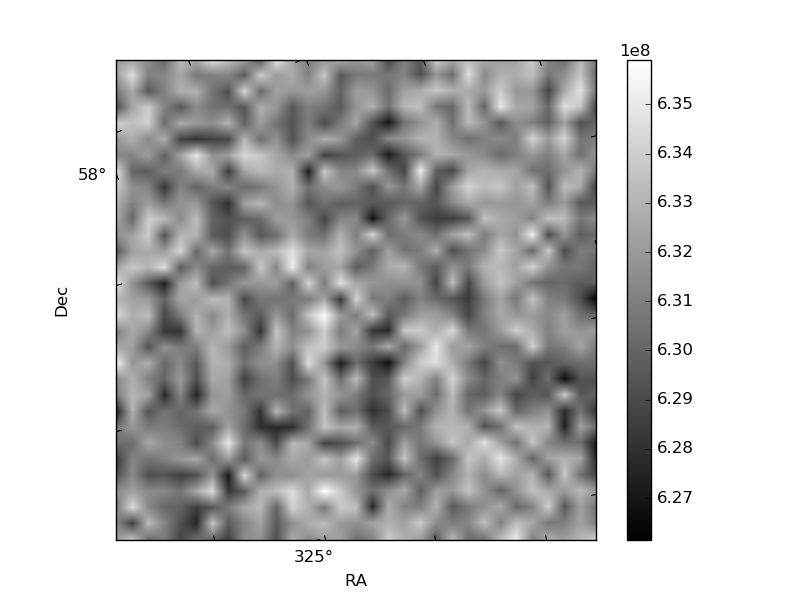
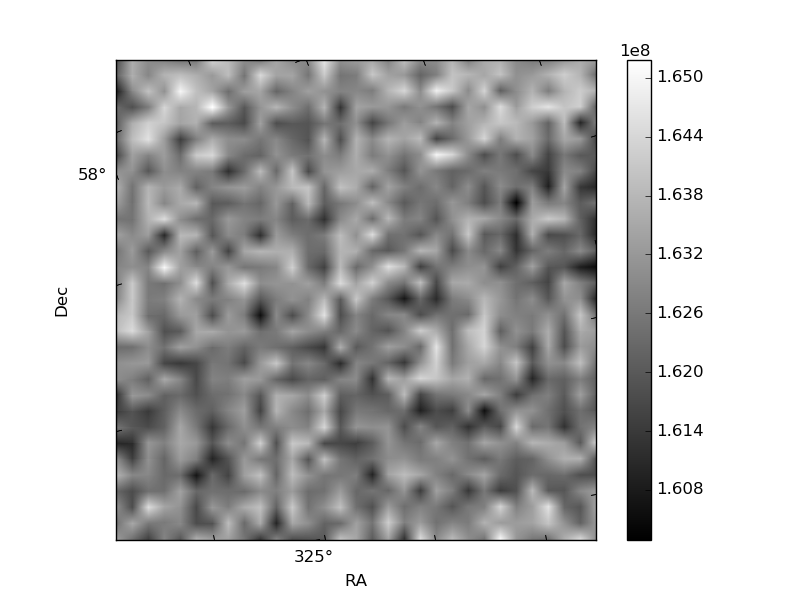
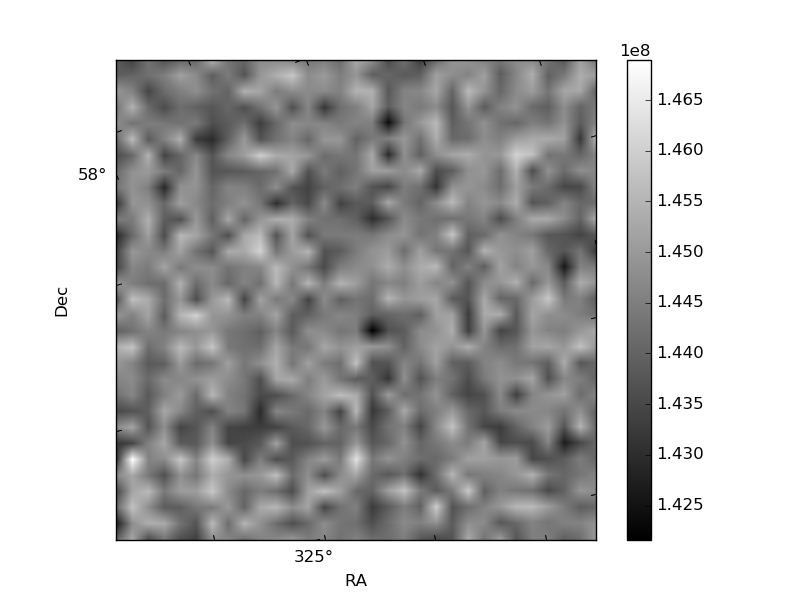
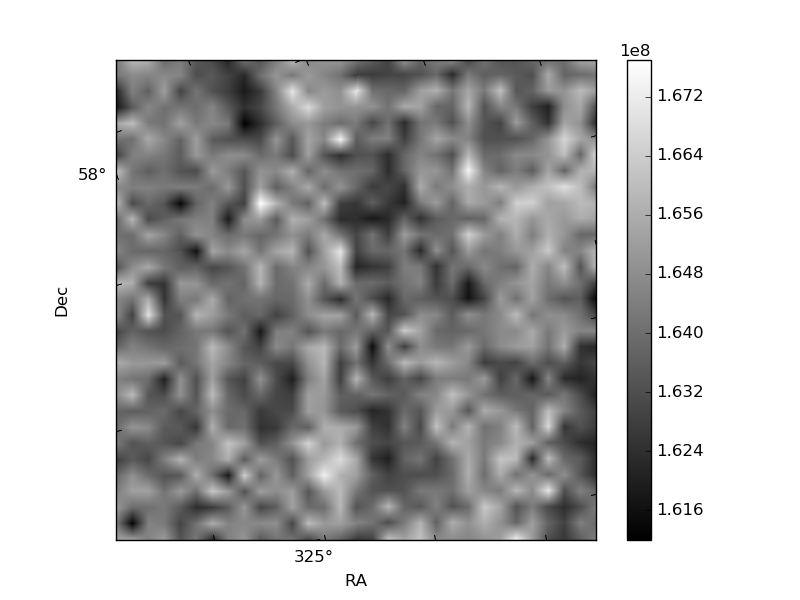
Histogram calculated using DETX and DETY for each event in the final _common_clean file
| Quadrant A | 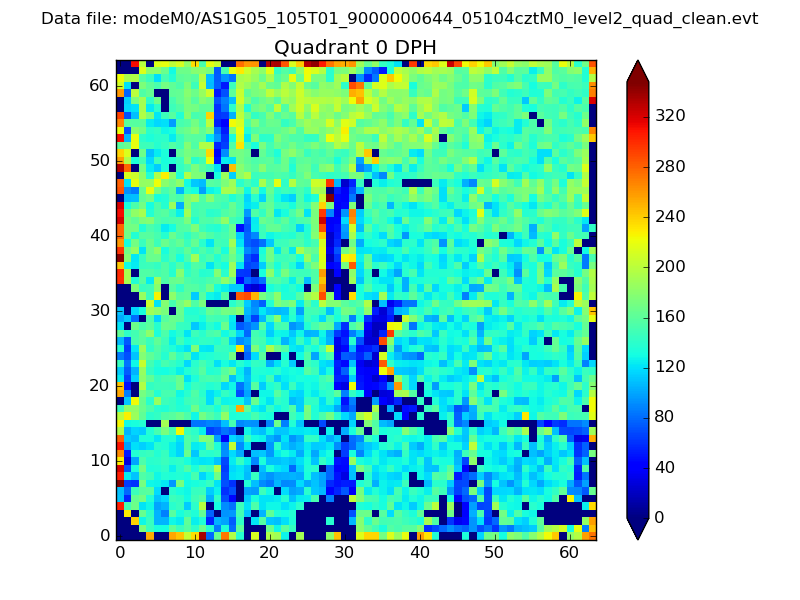 |
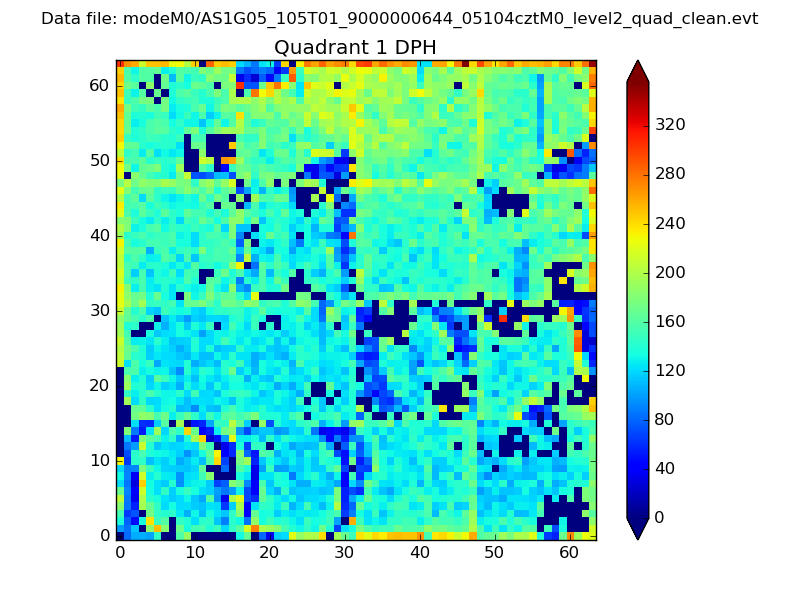 |
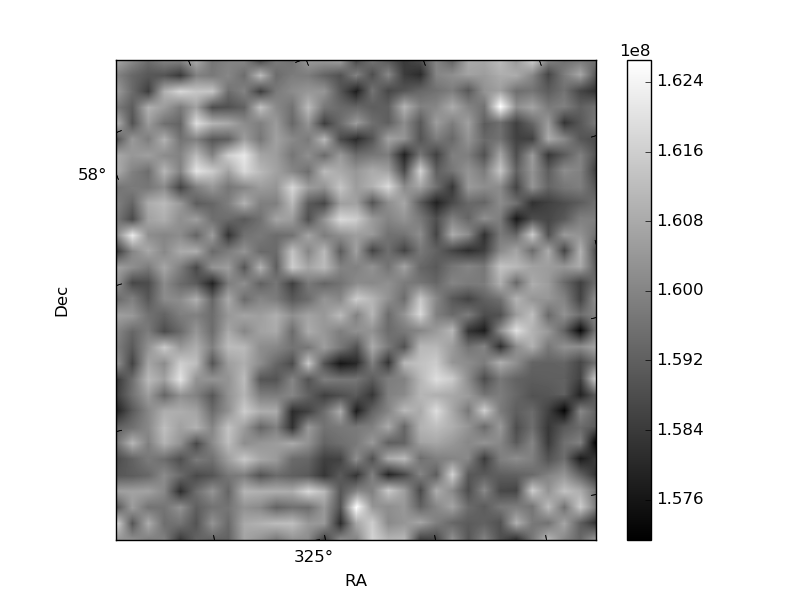
Quadrant B |
|---|---|---|---|
| Quadrant D | 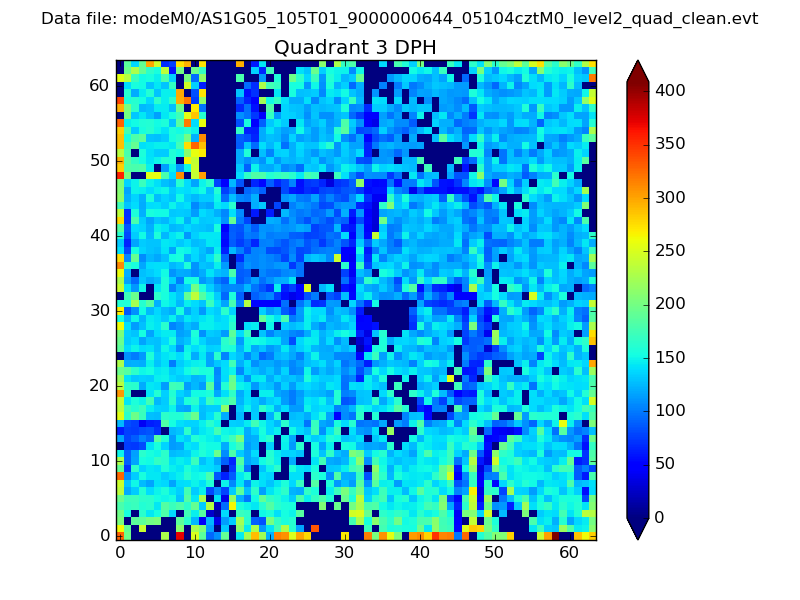 |
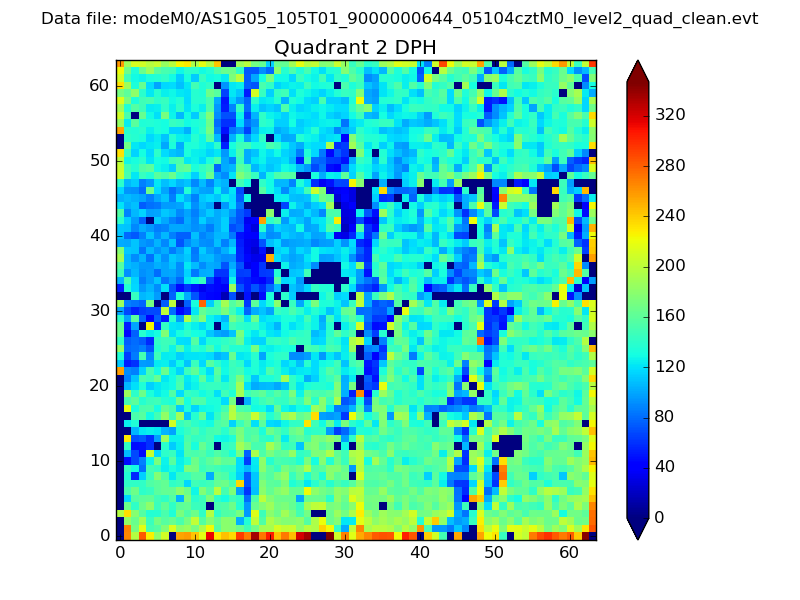 |
Quadrant C |
| Plot type | Count rate plots | Images |
|---|---|---|
| Comparison with Poisson distribution Blue bars denote a histogram of data divided into 1 sec bins. Red curve is a Poisson curve with rate = median count rate of data. |
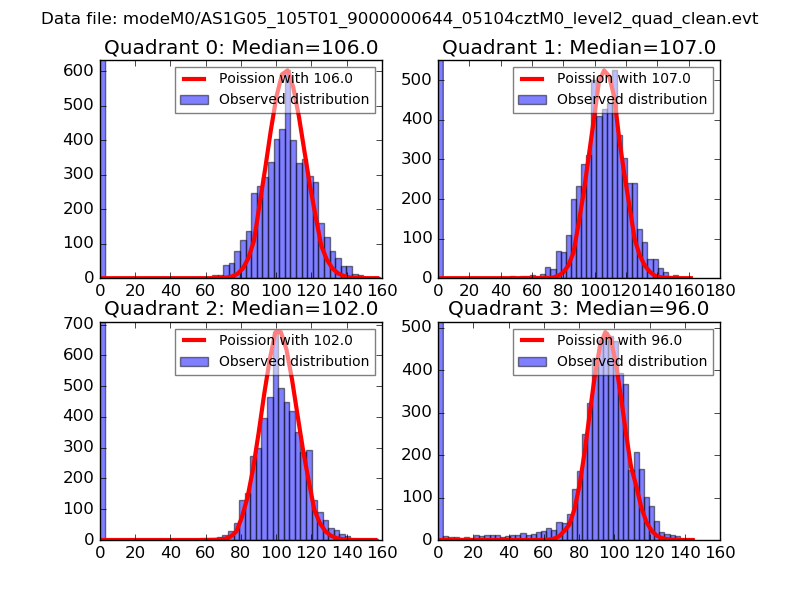 |
 |
| Quadrant-wise count rates Data is divided into 100 sec bins |
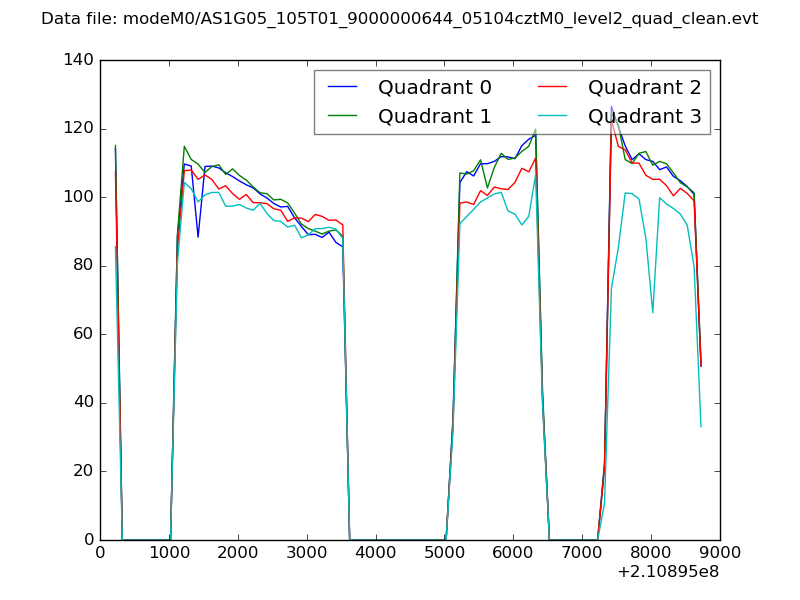 |
|
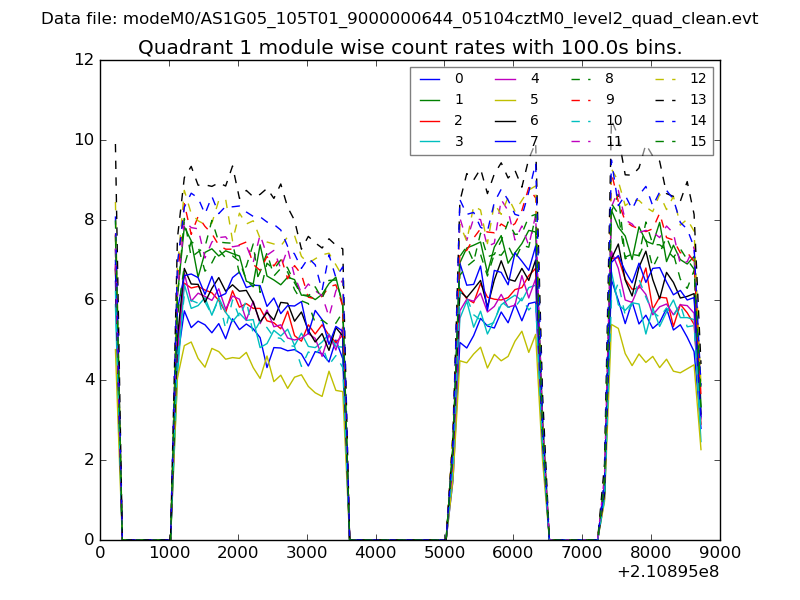
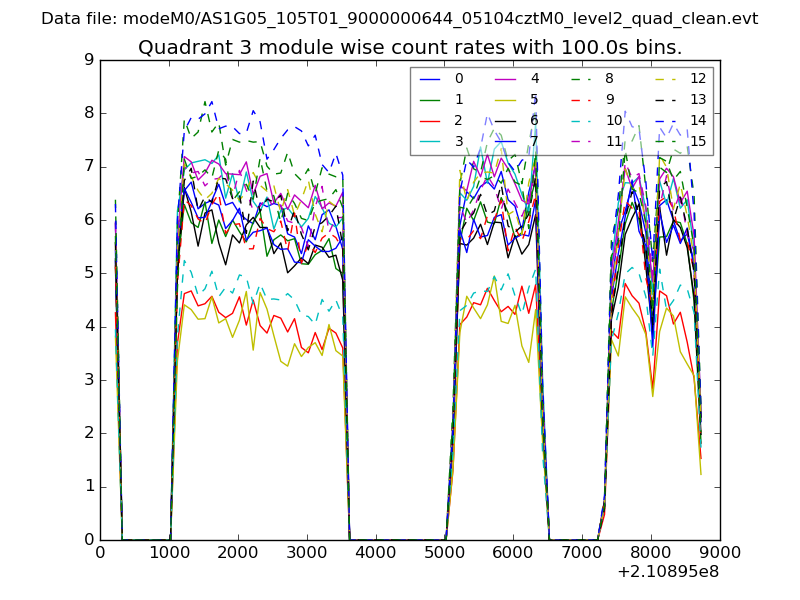
| Module-wise count rates for Quadrant A Data is divided into 100 sec bins |
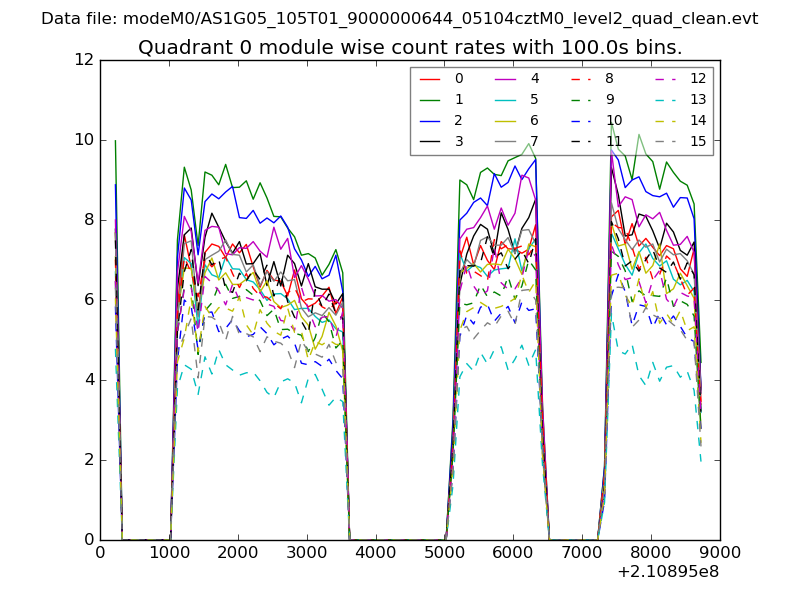 |
 |
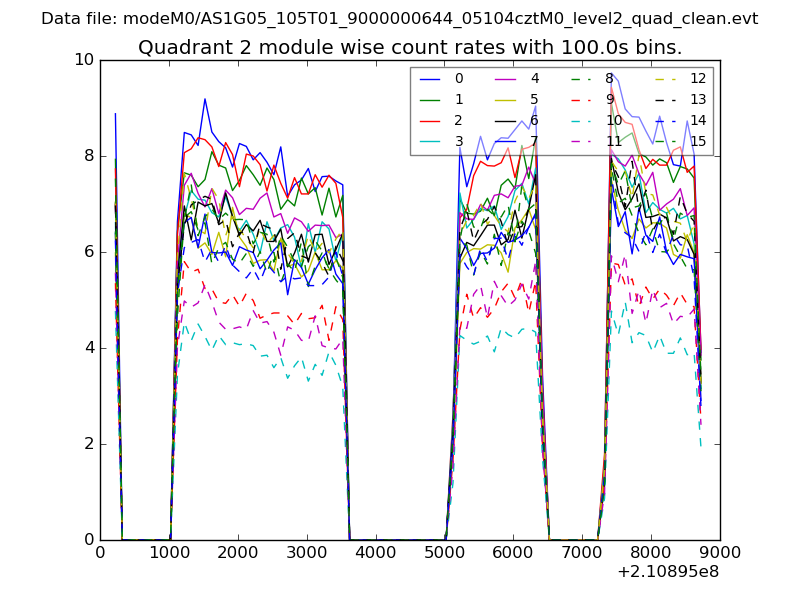
| Module-wise count rates for Quadrant B Data is divided into 100 sec bins |
 |
 |
| Module-wise count rates for Quadrant C Data is divided into 100 sec bins |
 |
 |
| Module-wise count rates for Quadrant D Data is divided into 100 sec bins |
 |
 |
| Parameter | Plot |
|---|---|
| CZT HV Monitor | 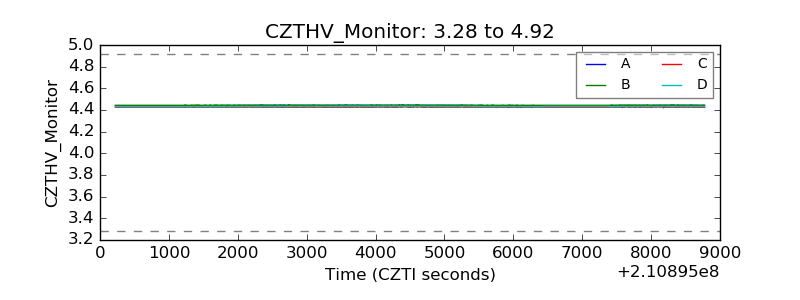 |
| D_VDD | 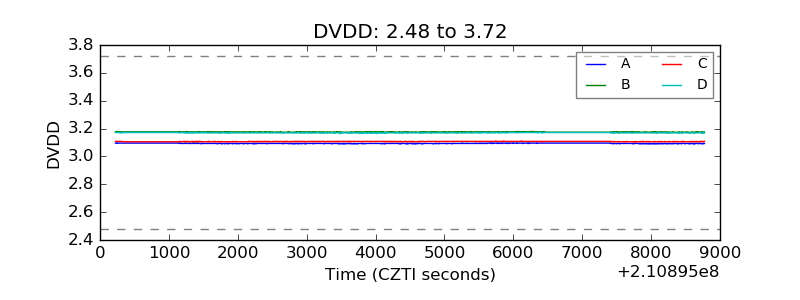 |
| Temperature 1 | 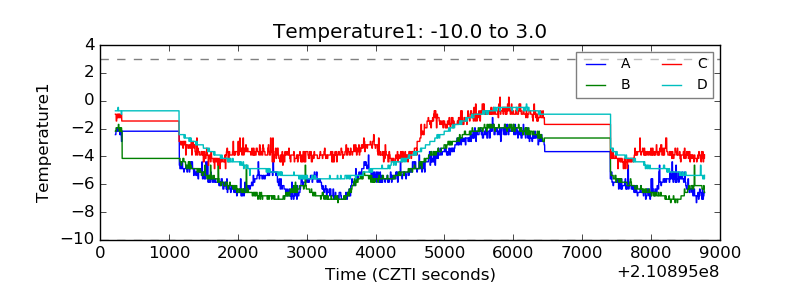 |
| Veto HV Monitor | 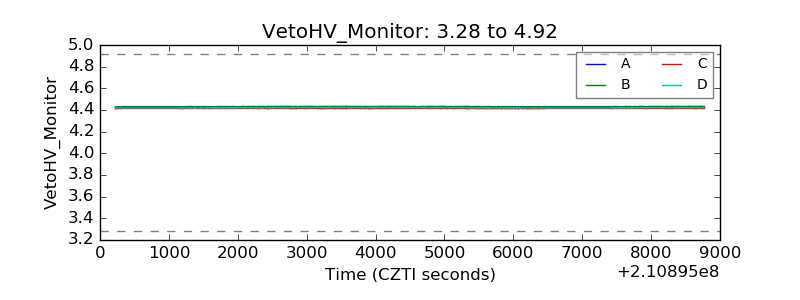 |
| Veto LLD | 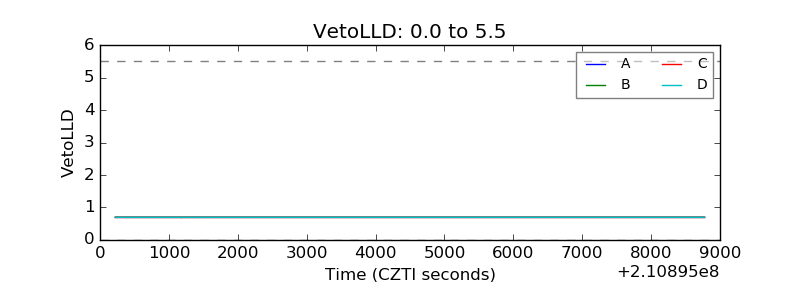 |
| Alpha Counter | 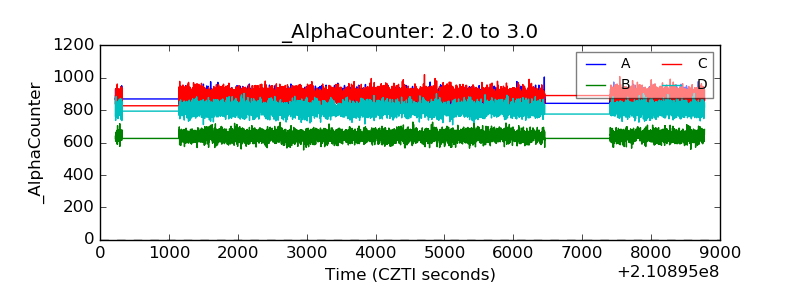 |
| _CPM_Rate | 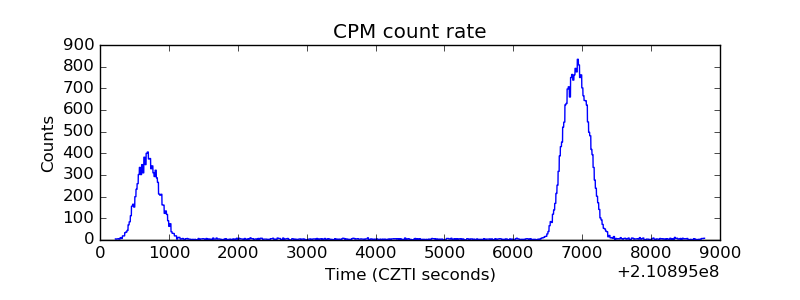 |
| CZT Counter | 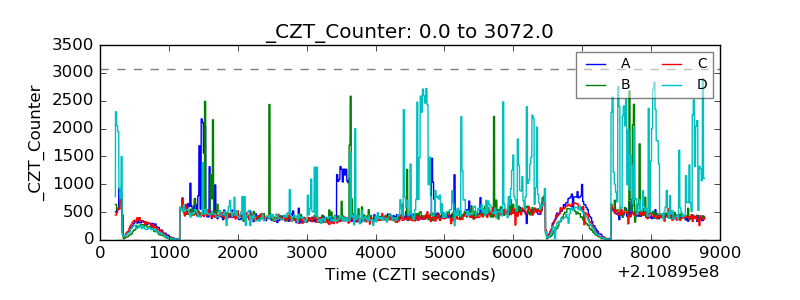 |
| +2.5 Volts monitor | 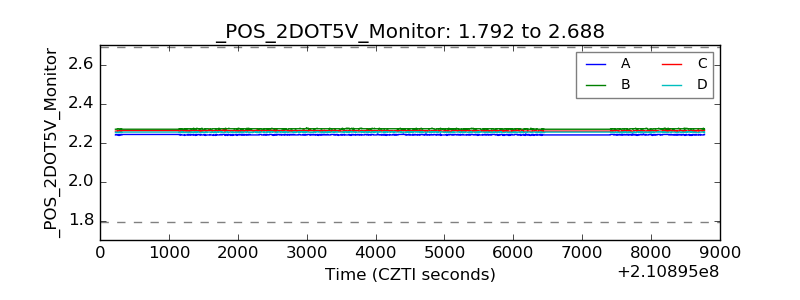 |
| +5 Volts monitor | 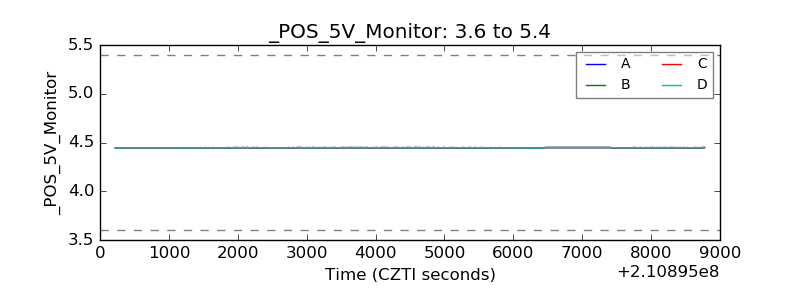 |
| _ROLL_ROT | 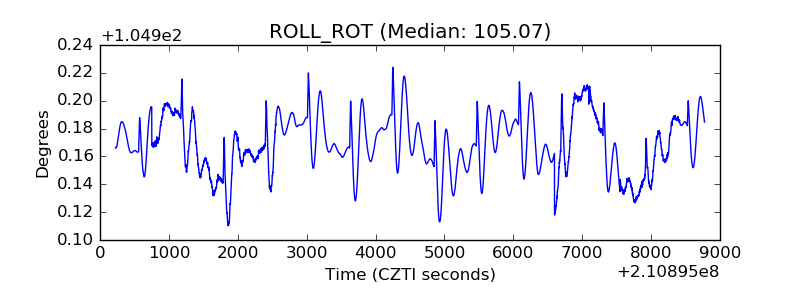 |
| _Roll_DEC | 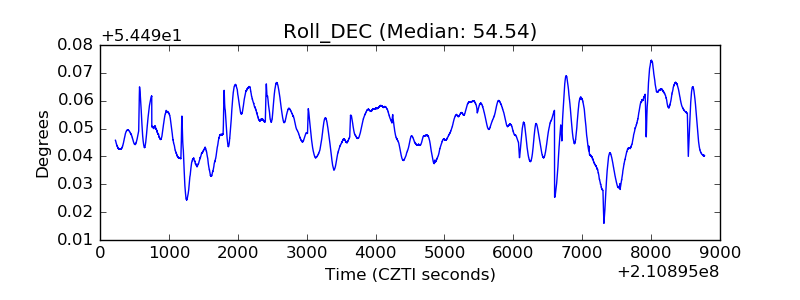 |
| _Roll_RA | 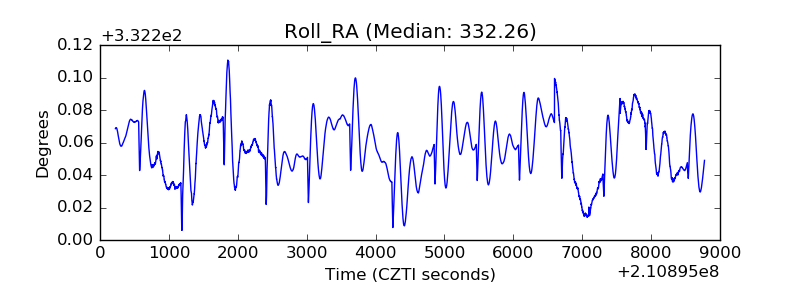 |
| Veto Counter | 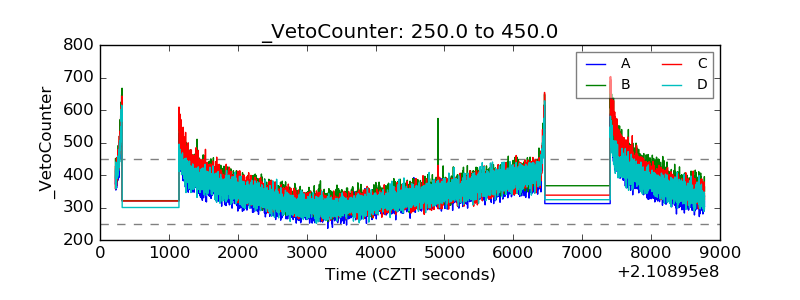 |