| Param | Original file | Final file |
|---|---|---|
| Filename | modeM0/AS1G05_137T01_9000000646cztM0_level2.fits | modeM0/AS1G05_137T01_9000000646cztM0_level2_quad_clean.evt |
| Size (bytes) | 338,241,600 | 346,965,120 |
| Size | 322.6 MB | 330.9 MB |
| Events in quadrant A | 2,046,894 | 2,113,465 |
| Events in quadrant B | 1,989,778 | 2,138,166 |
| Events in quadrant C | 2,039,600 | 2,074,162 |
| Events in quadrant D | 1,636,888 | 1,654,918 |
| Mode SS | |||
|---|---|---|---|
| Quadrant | BADHDUFLAG | Total packets | Discarded packets |
| A | 0 | 744 | 0 |
| B | 0 | 744 | 0 |
| C | 0 | 744 | 0 |
| D | 0 | 744 | 0 |
| Mode M0 | |||
|---|---|---|---|
| Quadrant | BADHDUFLAG | Total packets | Discarded packets |
| A | 0 | 93512 | 0 |
| B | 0 | 90720 | 0 |
| C | 0 | 75636 | 0 |
| D | 0 | 121798 | 0 |
| Mode M9 | |||
|---|---|---|---|
| Quadrant | BADHDUFLAG | Total packets | Discarded packets |
| A | 0 | 71 | 0 |
| B | 0 | 71 | 0 |
| C | 0 | 71 | 0 |
| D | 0 | 71 | 0 |
| Quadrant | Total seconds | Saturated seconds | Saturation percentage |
|---|---|---|---|
| A | 36814 | 2444 | 6.638779% |
| B | 36801 | 1601 | 4.350425% |
| C | 36810 | 416 | 1.130128% |
| D | 36800 | 5409 | 14.698370% |
Noise dominated data is calculated using 1-second bins in cleaned event files. If a bin has >2000 counts, and if more than 50% of those come from <1% of pixels, then it is considered to be noise-dominated and hence unusable.
| Quadrant | # 1 sec bins | Bins with >0 counts | Bins with >2000 counts | High rate bins dominated by noise | Noise dominated (total time) | Noise dominated (detector-on time) | Marked lightcurve |
|---|---|---|---|---|---|---|---|
| A | 43666 | 36792 | 0 | 0 | 0.00% | 0.00% |  |
| B | 43666 | 36812 | 0 | 0 | 0.00% | 0.00% |  |
| C | 43666 | 36816 | 0 | 0 | 0.00% | 0.00% |  |
| D | 43666 | 36149 | 0 | 0 | 0.00% | 0.00% |  |
Top three noisy pixels from each quadrant. If the there are fewer than three noisy pixels in the level2.evt file, extra rows are filled as -1
| Pixel properties | Quadrant properties | ||||||
|---|---|---|---|---|---|---|---|
| Quadrant | DetID | PixID | Counts | Sigma | Mean | Median | Sigma |
| A | 0 | 29 | 1971 | 10.68 | 532 | 497 | 138.0 |
| A | 7 | 110 | 1728 | 8.92 | 532 | 497 | 138.0 |
| A | 9 | 19 | 1612 | 8.08 | 532 | 497 | 138.0 |
| B | 2 | 9 | 1755 | 11.74 | 526 | 501 | 106.9 |
| B | 12 | 226 | 1492 | 9.27 | 526 | 501 | 106.9 |
| B | 5 | 128 | 1420 | 8.6 | 526 | 501 | 106.9 |
| C | 1 | 80 | 1500 | 6.93 | 538 | 498 | 144.5 |
| C | 1 | 81 | 1479 | 6.79 | 538 | 498 | 144.5 |
| C | 9 | 188 | 1461 | 6.66 | 538 | 498 | 144.5 |
| D | 11 | 82 | 1348 | 7.33 | 465 | 422 | 126.4 |
| D | 6 | 231 | 1195 | 6.12 | 465 | 422 | 126.4 |
| D | 3 | 14 | 1195 | 6.12 | 465 | 422 | 126.4 |
Histogram calculated using DETX and DETY for each event in the final _common_clean file
| Quadrant A | 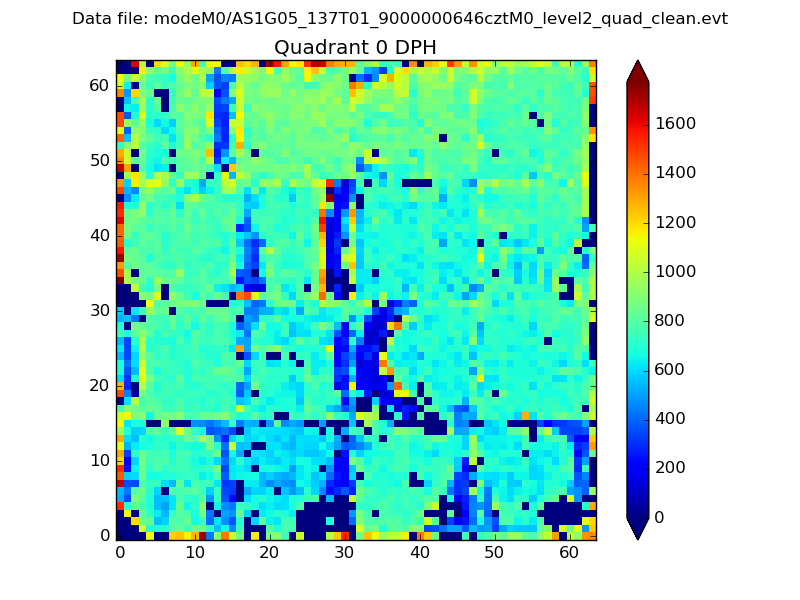 |
 |
Quadrant B |
|---|---|---|---|
| Quadrant D |  |
 |
Quadrant C |
| Plot type | Count rate plots | Images |
|---|---|---|
| Comparison with Poisson distribution Blue bars denote a histogram of data divided into 1 sec bins. Red curve is a Poisson curve with rate = median count rate of data. |
 |
 |
| Quadrant-wise count rates Data is divided into 100 sec bins |
 |
|
| Module-wise count rates for Quadrant A Data is divided into 100 sec bins |
 |
 |
| Module-wise count rates for Quadrant B Data is divided into 100 sec bins |
 |
 |
| Module-wise count rates for Quadrant C Data is divided into 100 sec bins |
 |
 |
| Module-wise count rates for Quadrant D Data is divided into 100 sec bins |
 |
 |
| Parameter | Plot |
|---|---|
| CZT HV Monitor |  |
| D_VDD |  |
| Temperature 1 |  |
| Veto HV Monitor |  |
| Veto LLD |  |
| Alpha Counter |  |
| _CPM_Rate |  |
| CZT Counter |  |
| +2.5 Volts monitor |  |
| +5 Volts monitor |  |
| _ROLL_ROT |  |
| _Roll_DEC |  |
| _Roll_RA | 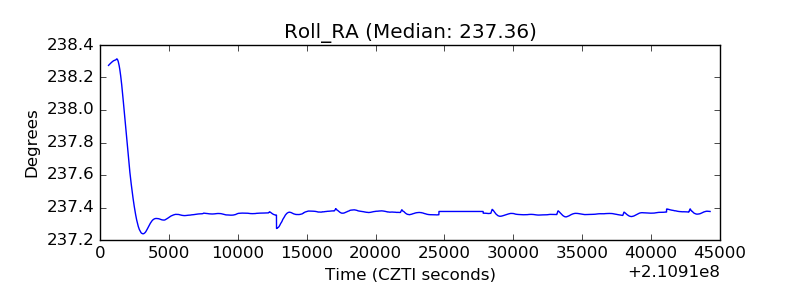 |
| Veto Counter |  |