| Param | Original file | Final file |
|---|---|---|
| Filename | modeM0/AS1G05_137T01_9000000646_05108cztM0_level2.evt | modeM0/AS1G05_137T01_9000000646_05108cztM0_level2_quad_clean.evt |
| Size (bytes) | 464,889,600 | 68,941,440 |
| Size | 443.4 MB | 65.7 MB |
| Events in quadrant A | 3,110,064 | 426,728 |
| Events in quadrant B | 3,191,902 | 418,043 |
| Events in quadrant C | 2,951,428 | 409,082 |
| Events in quadrant D | 4,394,634 | 390,696 |
| Mode SS | |||
|---|---|---|---|
| Quadrant | BADHDUFLAG | Total packets | Discarded packets |
| A | 0 | 128 | 0 |
| B | 0 | 128 | 0 |
| C | 0 | 128 | 0 |
| D | 0 | 128 | 0 |
| Mode M0 | |||
|---|---|---|---|
| Quadrant | BADHDUFLAG | Total packets | Discarded packets |
| A | 0 | 13268 | 2 |
| B | 0 | 13527 | 1 |
| C | 0 | 13081 | 1 |
| D | 0 | 17110 | 1 |
| Mode M9 | |||
|---|---|---|---|
| Quadrant | BADHDUFLAG | Total packets | Discarded packets |
| A | 0 | 21 | 0 |
| B | 0 | 21 | 0 |
| C | 0 | 21 | 0 |
| D | 0 | 22 | 0 |
| Quadrant | Total seconds | Saturated seconds | Saturation percentage |
|---|---|---|---|
| A | 6347 | 75 | 1.181661% |
| B | 6347 | 102 | 1.607058% |
| C | 6347 | 51 | 0.803529% |
| D | 6347 | 444 | 6.995431% |
Noise dominated data is calculated using 1-second bins in cleaned event files. If a bin has >2000 counts, and if more than 50% of those come from <1% of pixels, then it is considered to be noise-dominated and hence unusable.
| Quadrant | # 1 sec bins | Bins with >0 counts | Bins with >2000 counts | High rate bins dominated by noise | Noise dominated (total time) | Noise dominated (detector-on time) | Marked lightcurve |
|---|---|---|---|---|---|---|---|
| A | 7587 | 6348 | 0 | 0 | 0.00% | 0.00% | 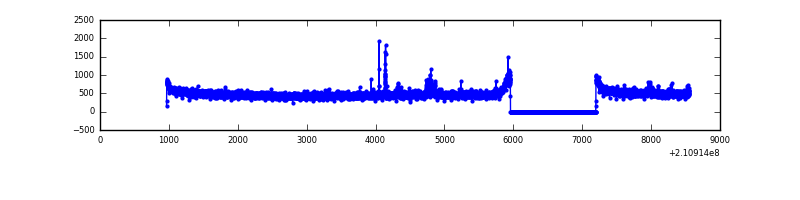 |
| B | 7587 | 6348 | 3 | 3 | 0.04% | 0.05% | 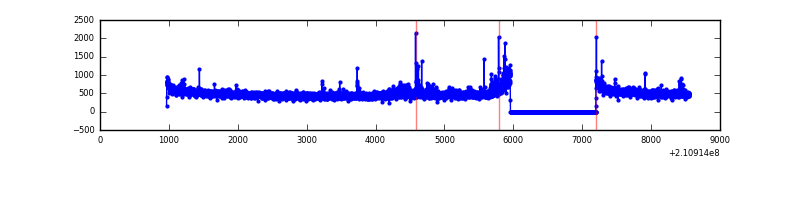 |
| C | 7587 | 6348 | 1 | 1 | 0.01% | 0.02% | 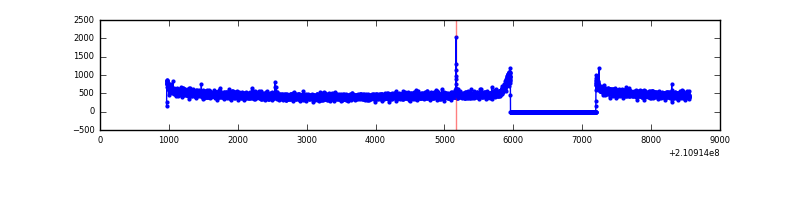 |
| D | 7586 | 6347 | 321 | 321 | 4.23% | 5.06% | 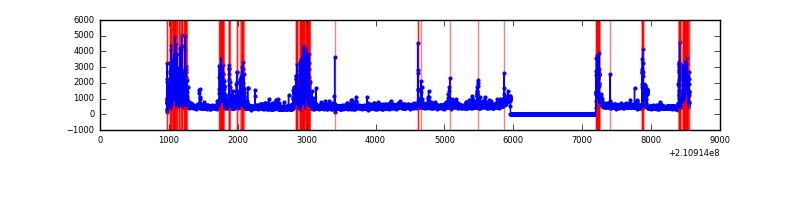 |
Top three noisy pixels from each quadrant. If the there are fewer than three noisy pixels in the level2.evt file, extra rows are filled as -1
| Pixel properties | Quadrant properties | ||||||
|---|---|---|---|---|---|---|---|
| Quadrant | DetID | PixID | Counts | Sigma | Mean | Median | Sigma |
| A | 13 | 251 | 49250 | 304.44 | 787 | 771 | 159.2 |
| A | 0 | 50 | 20235 | 122.23 | 787 | 771 | 159.2 |
| A | 13 | 14 | 10116 | 58.68 | 787 | 771 | 159.2 |
| B | 4 | 80 | 73136 | 475.75 | 793 | 776 | 152.1 |
| B | 15 | 204 | 17535 | 110.19 | 793 | 776 | 152.1 |
| B | 0 | 219 | 15930 | 99.63 | 793 | 776 | 152.1 |
| C | 12 | 4 | 8096 | 42.11 | 753 | 756 | 174.3 |
| C | 13 | 61 | 6196 | 31.21 | 753 | 756 | 174.3 |
| C | 1 | 16 | 2893 | 12.26 | 753 | 756 | 174.3 |
| D | 13 | 239 | 742724 | 4176.19 | 730 | 707 | 177.7 |
| D | 12 | 22 | 371738 | 2088.22 | 730 | 707 | 177.7 |
| D | 8 | 195 | 203885 | 1143.52 | 730 | 707 | 177.7 |
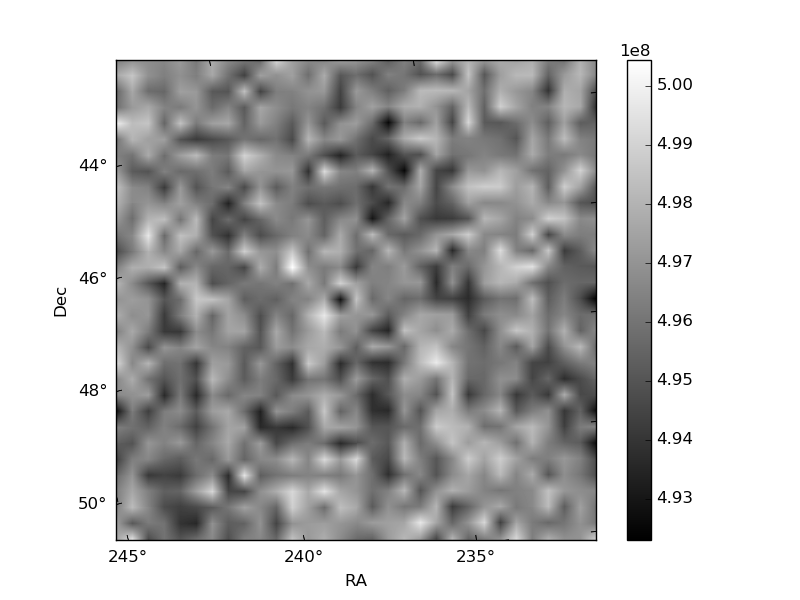
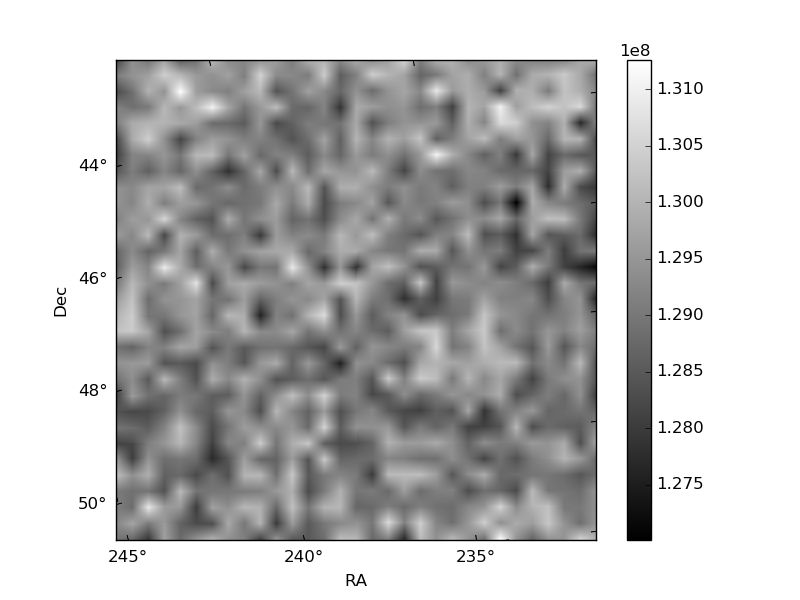
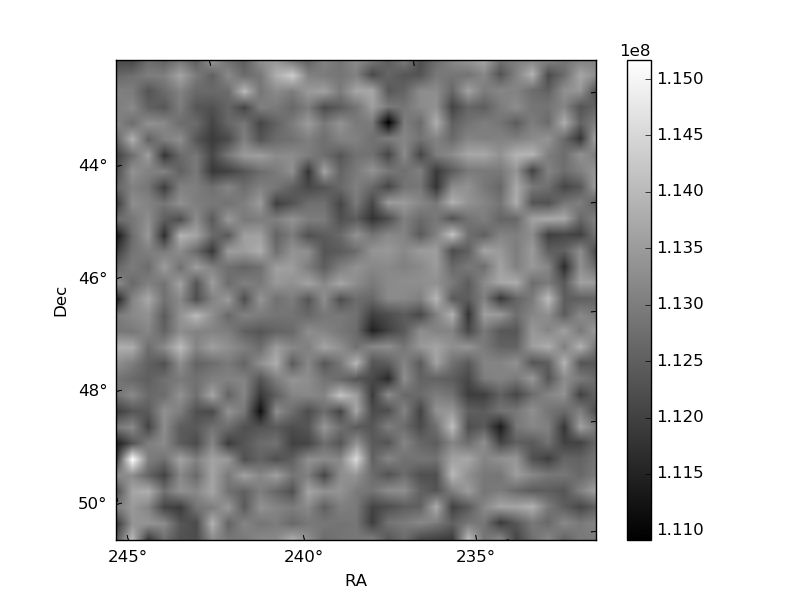
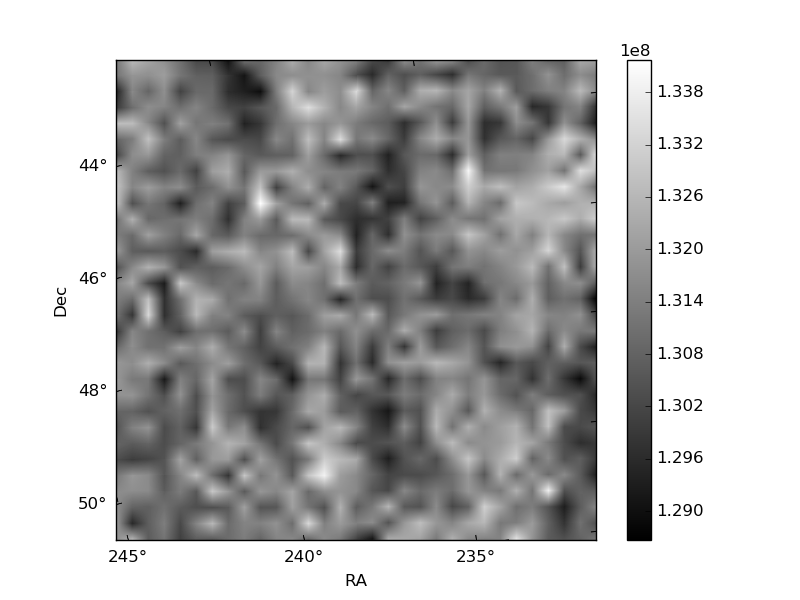
Histogram calculated using DETX and DETY for each event in the final _common_clean file
| Quadrant A | 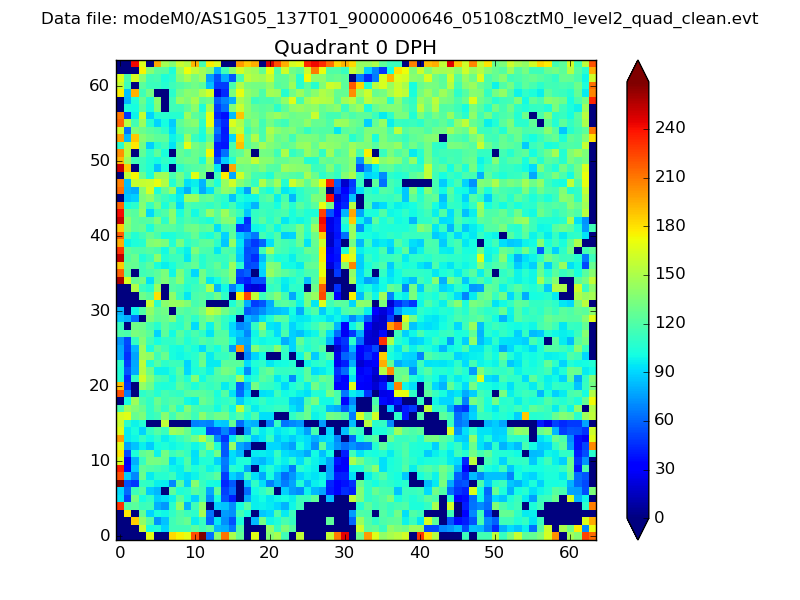 |
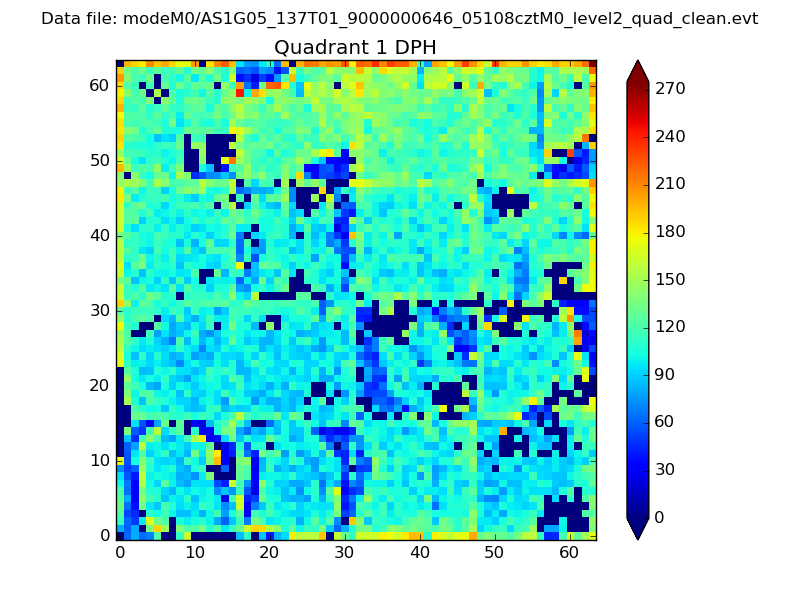 |
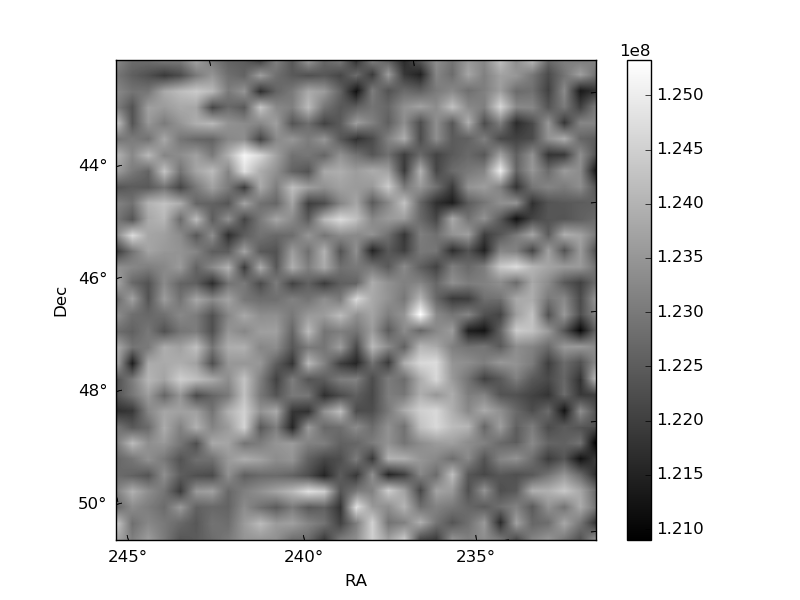
Quadrant B |
|---|---|---|---|
| Quadrant D | 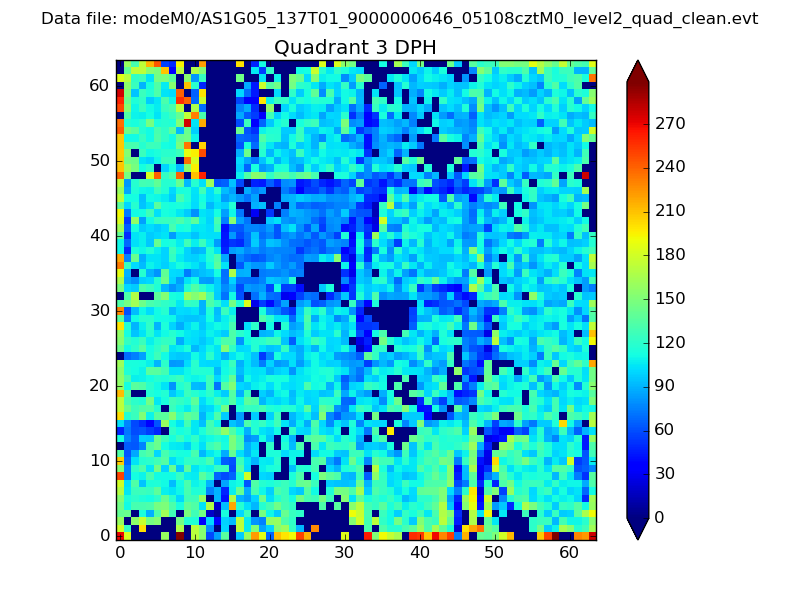 |
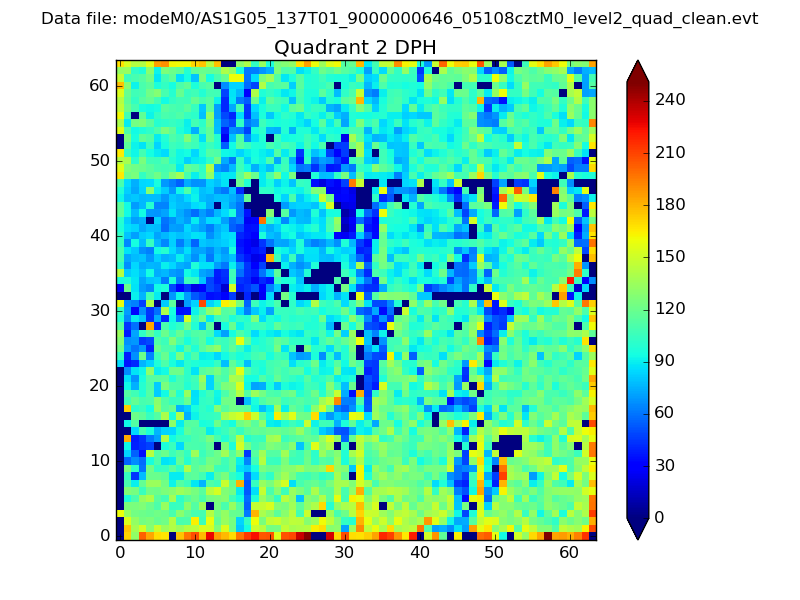 |
Quadrant C |
| Plot type | Count rate plots | Images |
|---|---|---|
| Comparison with Poisson distribution Blue bars denote a histogram of data divided into 1 sec bins. Red curve is a Poisson curve with rate = median count rate of data. |
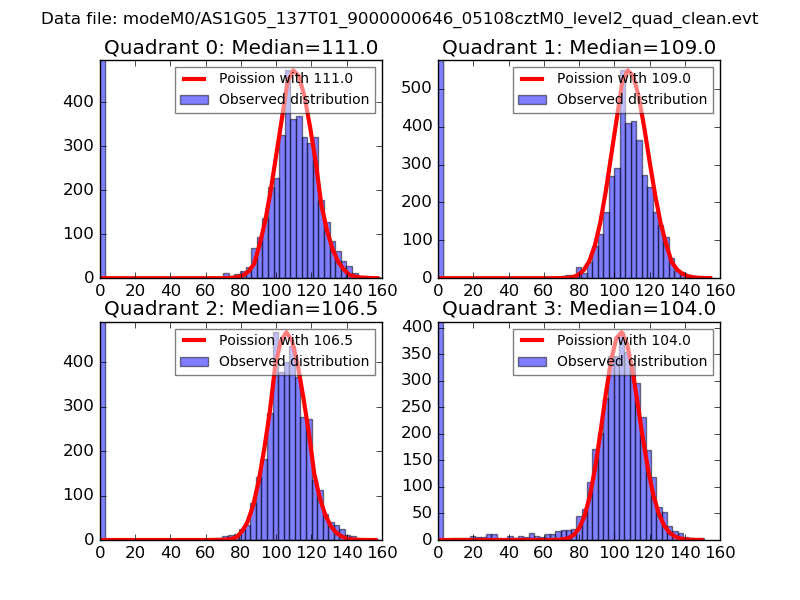 |
 |
| Quadrant-wise count rates Data is divided into 100 sec bins |
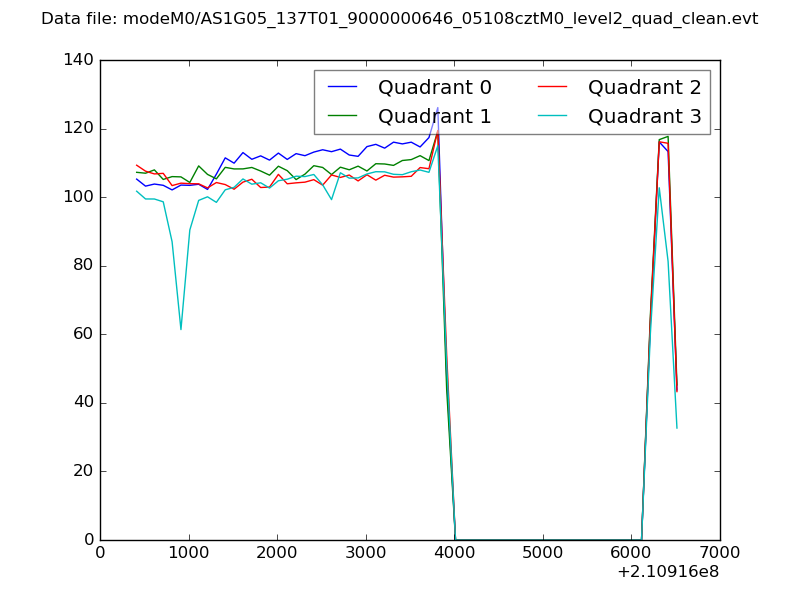 |
|
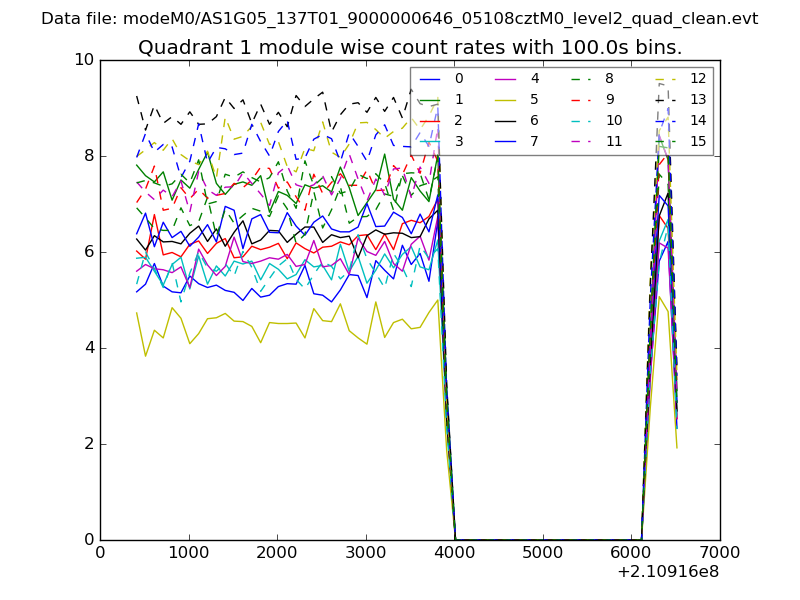
| Module-wise count rates for Quadrant A Data is divided into 100 sec bins |
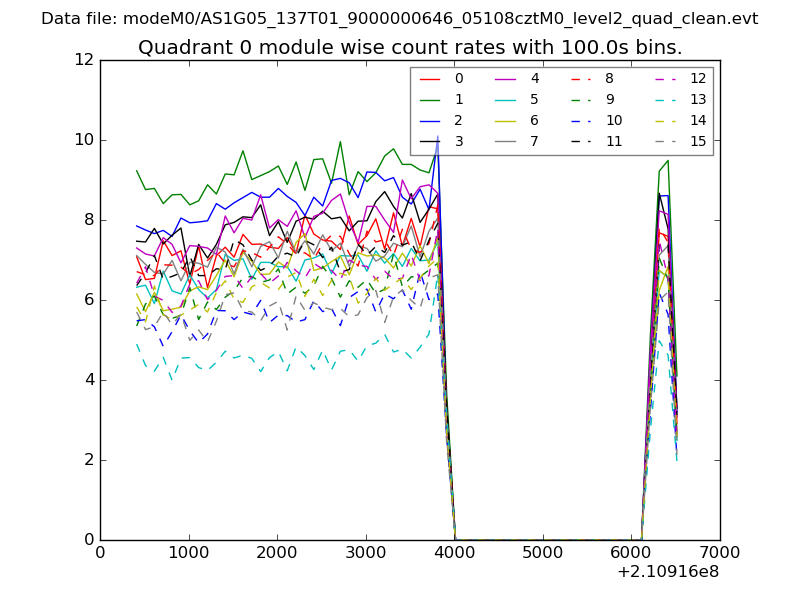 |
 |
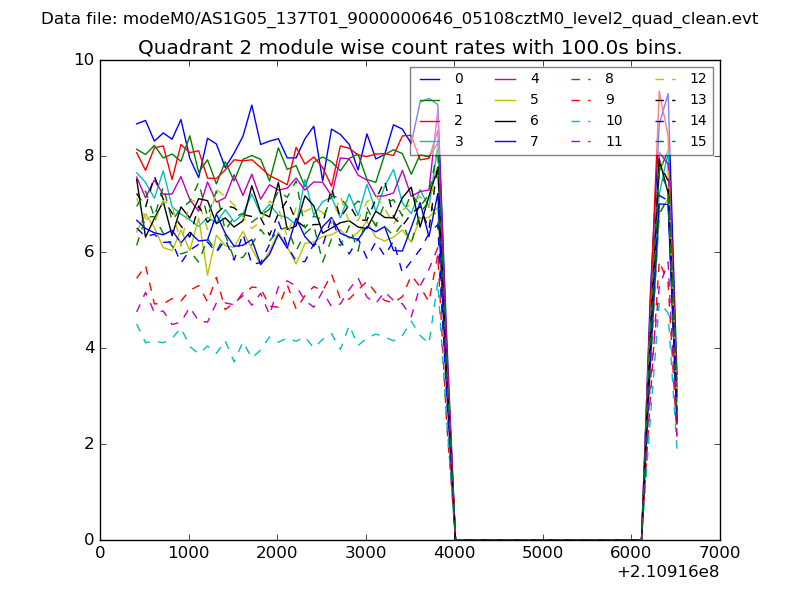
| Module-wise count rates for Quadrant B Data is divided into 100 sec bins |
 |
 |
| Module-wise count rates for Quadrant C Data is divided into 100 sec bins |
 |
 |
| Module-wise count rates for Quadrant D Data is divided into 100 sec bins |
 |
 |
| Parameter | Plot |
|---|---|
| CZT HV Monitor | 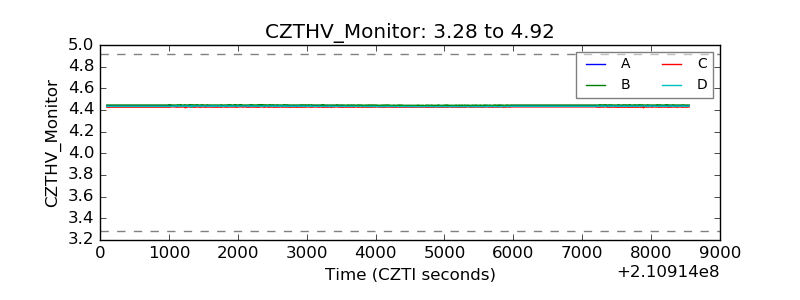 |
| D_VDD | 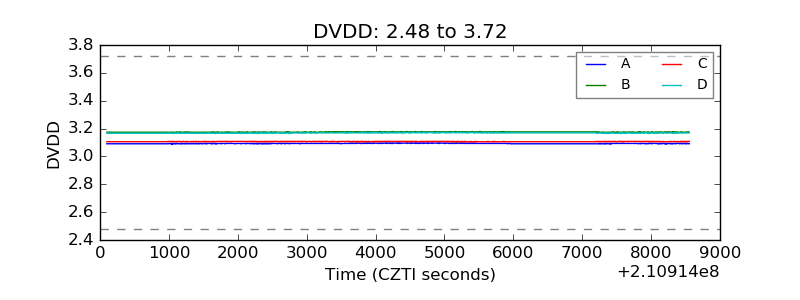 |
| Temperature 1 | 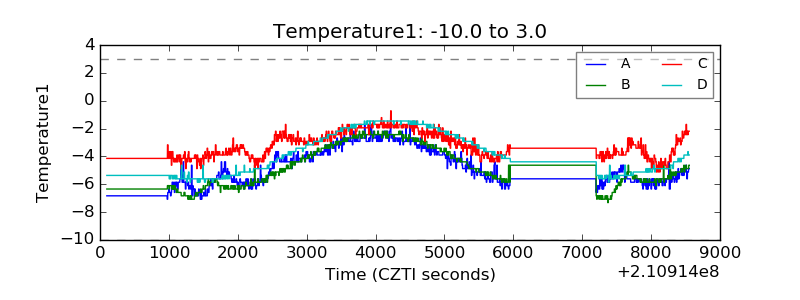 |
| Veto HV Monitor | 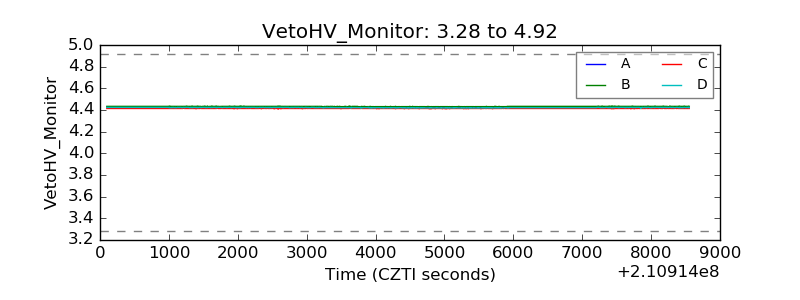 |
| Veto LLD | 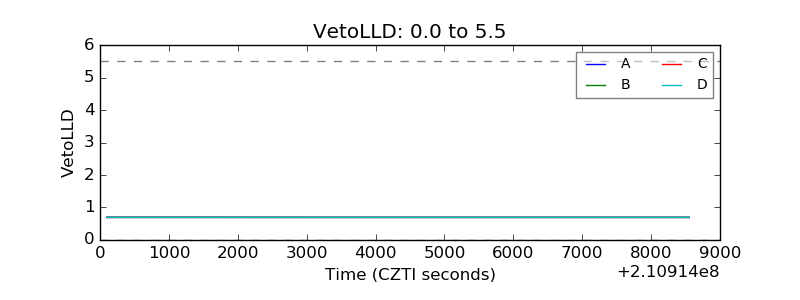 |
| Alpha Counter | 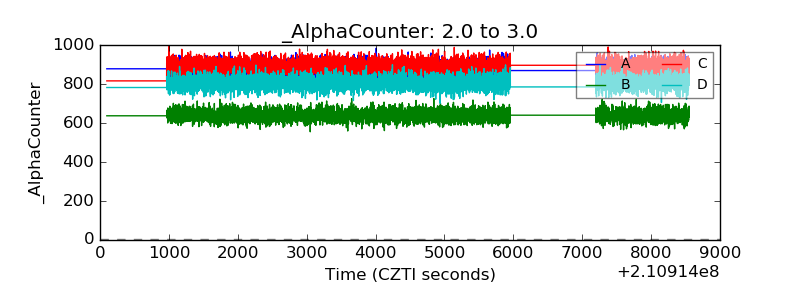 |
| _CPM_Rate | 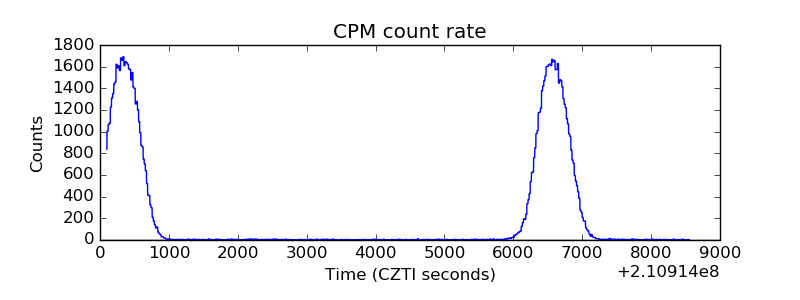 |
| CZT Counter | 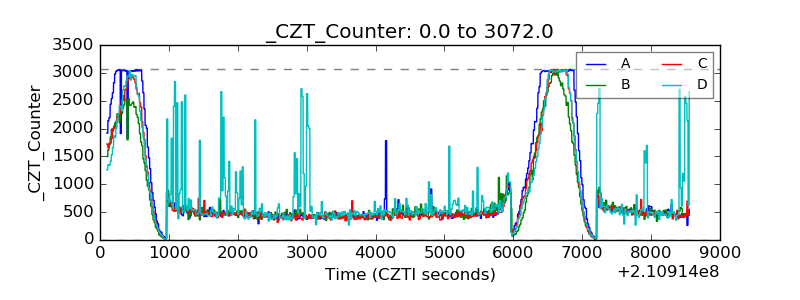 |
| +2.5 Volts monitor |  |
| +5 Volts monitor |  |
| _ROLL_ROT | 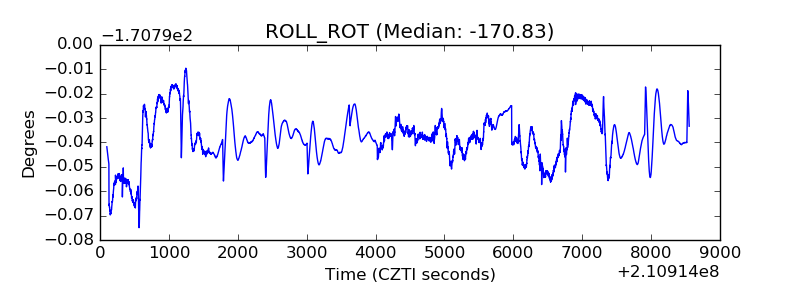 |
| _Roll_DEC | 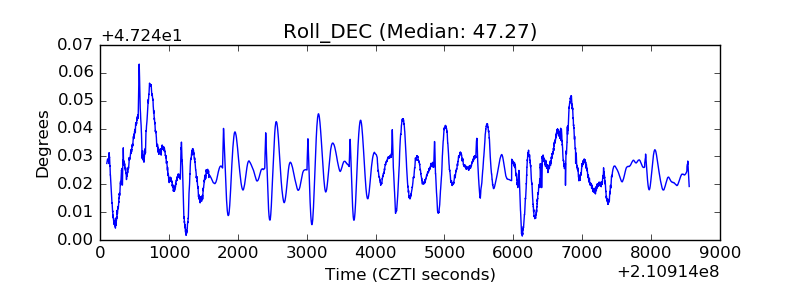 |
| _Roll_RA | 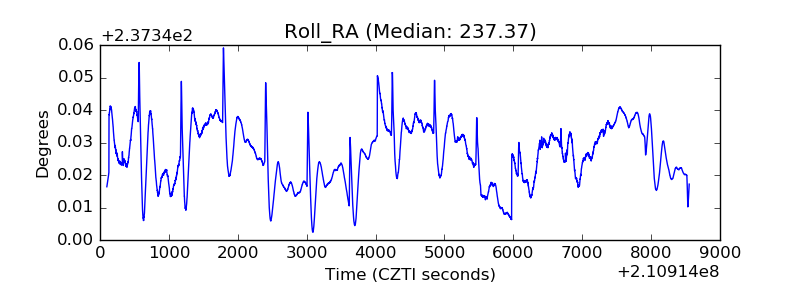 |
| Veto Counter | 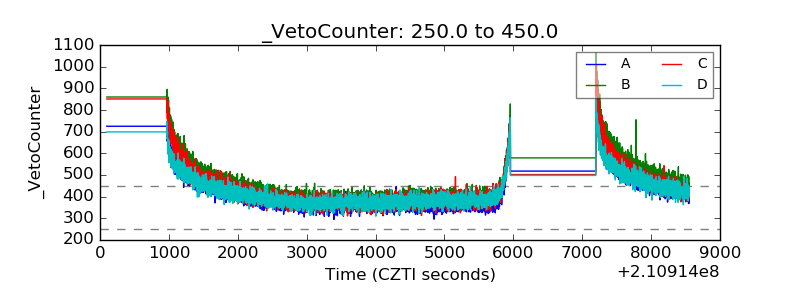 |