| Param | Original file | Final file |
|---|---|---|
| Filename | modeM0/AS1G05_137T01_9000000646_05109cztM0_level2.evt | modeM0/AS1G05_137T01_9000000646_05109cztM0_level2_quad_clean.evt |
| Size (bytes) | 495,290,880 | 79,341,120 |
| Size | 472.3 MB | 75.7 MB |
| Events in quadrant A | 4,118,373 | 507,521 |
| Events in quadrant B | 3,321,539 | 507,942 |
| Events in quadrant C | 2,814,939 | 495,129 |
| Events in quadrant D | 4,332,834 | 467,805 |
| Mode SS | |||
|---|---|---|---|
| Quadrant | BADHDUFLAG | Total packets | Discarded packets |
| A | 0 | 124 | 0 |
| B | 0 | 124 | 0 |
| C | 0 | 124 | 0 |
| D | 0 | 124 | 0 |
| Mode M0 | |||
|---|---|---|---|
| Quadrant | BADHDUFLAG | Total packets | Discarded packets |
| A | 0 | 16109 | 2 |
| B | 0 | 13632 | 1 |
| C | 0 | 12464 | 1 |
| D | 0 | 16856 | 1 |
| Mode M9 | |||
|---|---|---|---|
| Quadrant | BADHDUFLAG | Total packets | Discarded packets |
| A | 0 | 13 | 0 |
| B | 0 | 13 | 0 |
| C | 0 | 13 | 0 |
| D | 0 | 13 | 0 |
| Quadrant | Total seconds | Saturated seconds | Saturation percentage |
|---|---|---|---|
| A | 6070 | 396 | 6.523888% |
| B | 6070 | 158 | 2.602965% |
| C | 6070 | 76 | 1.252059% |
| D | 6070 | 398 | 6.556837% |
Noise dominated data is calculated using 1-second bins in cleaned event files. If a bin has >2000 counts, and if more than 50% of those come from <1% of pixels, then it is considered to be noise-dominated and hence unusable.
| Quadrant | # 1 sec bins | Bins with >0 counts | Bins with >2000 counts | High rate bins dominated by noise | Noise dominated (total time) | Noise dominated (detector-on time) | Marked lightcurve |
|---|---|---|---|---|---|---|---|
| A | 7324 | 6070 | 211 | 211 | 2.88% | 3.48% | 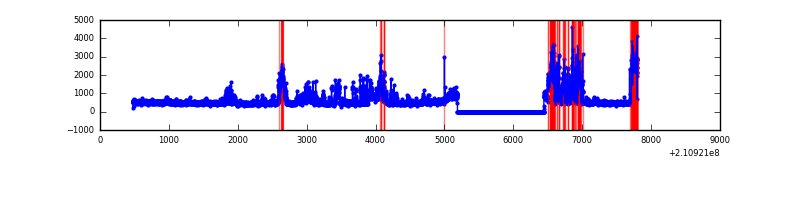 |
| B | 7325 | 6071 | 36 | 36 | 0.49% | 0.59% | 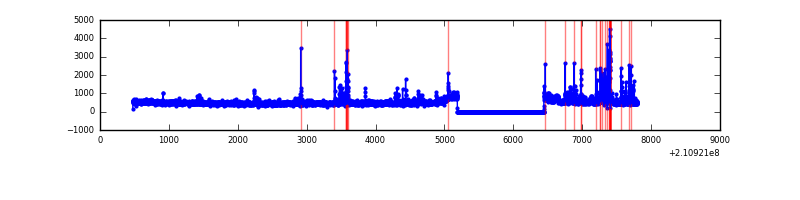 |
| C | 7325 | 6071 | 0 | 0 | 0.00% | 0.00% |  |
| D | 7325 | 6071 | 278 | 278 | 3.80% | 4.58% | 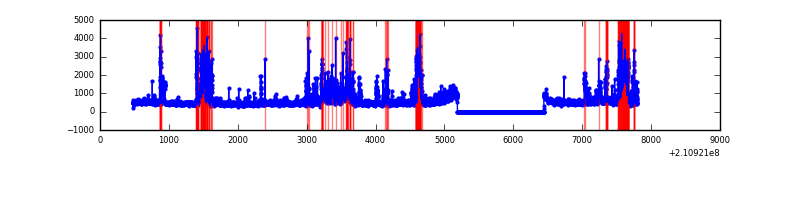 |
Top three noisy pixels from each quadrant. If the there are fewer than three noisy pixels in the level2.evt file, extra rows are filled as -1
| Pixel properties | Quadrant properties | ||||||
|---|---|---|---|---|---|---|---|
| Quadrant | DetID | PixID | Counts | Sigma | Mean | Median | Sigma |
| A | 13 | 251 | 1255724 | 8353.92 | 740 | 725 | 150.2 |
| A | 0 | 50 | 9018 | 55.2 | 740 | 725 | 150.2 |
| A | 0 | 226 | 7407 | 44.48 | 740 | 725 | 150.2 |
| B | 10 | 16 | 231958 | 1602.64 | 754 | 737 | 144.3 |
| B | 4 | 80 | 122710 | 845.42 | 754 | 737 | 144.3 |
| B | 4 | 52 | 15451 | 101.99 | 754 | 737 | 144.3 |
| C | 13 | 61 | 5888 | 31.29 | 719 | 724 | 165.0 |
| C | 1 | 16 | 4077 | 20.32 | 719 | 724 | 165.0 |
| C | 12 | 4 | 2521 | 10.89 | 719 | 724 | 165.0 |
| D | 12 | 227 | 639312 | 3694.86 | 712 | 690 | 172.8 |
| D | 12 | 22 | 346145 | 1998.69 | 712 | 690 | 172.8 |
| D | 13 | 239 | 160026 | 921.87 | 712 | 690 | 172.8 |
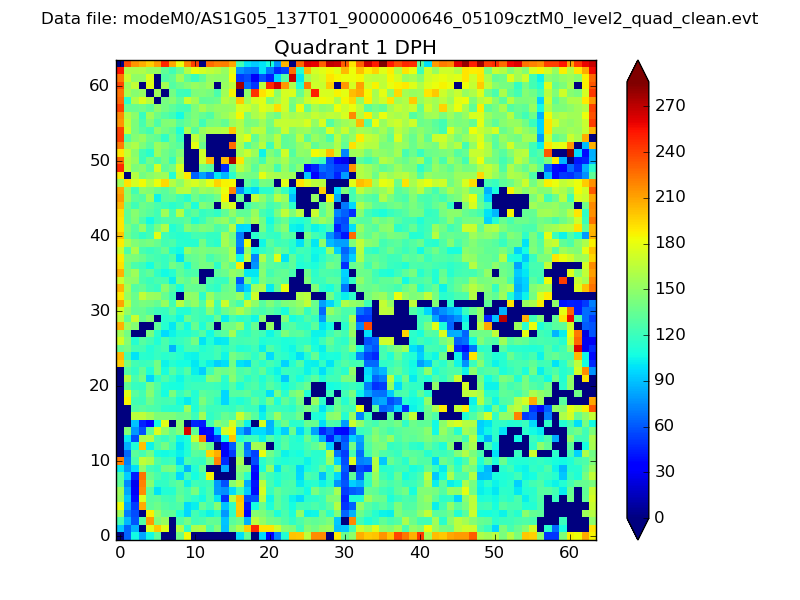
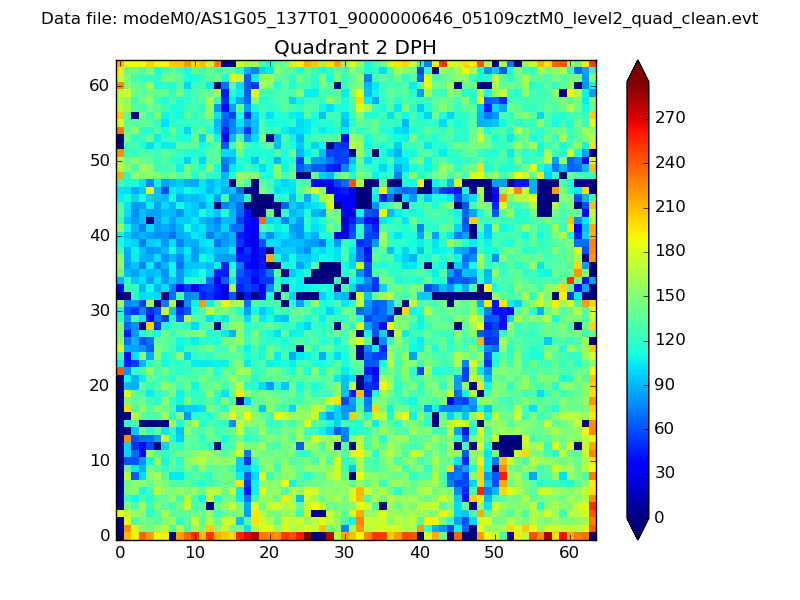
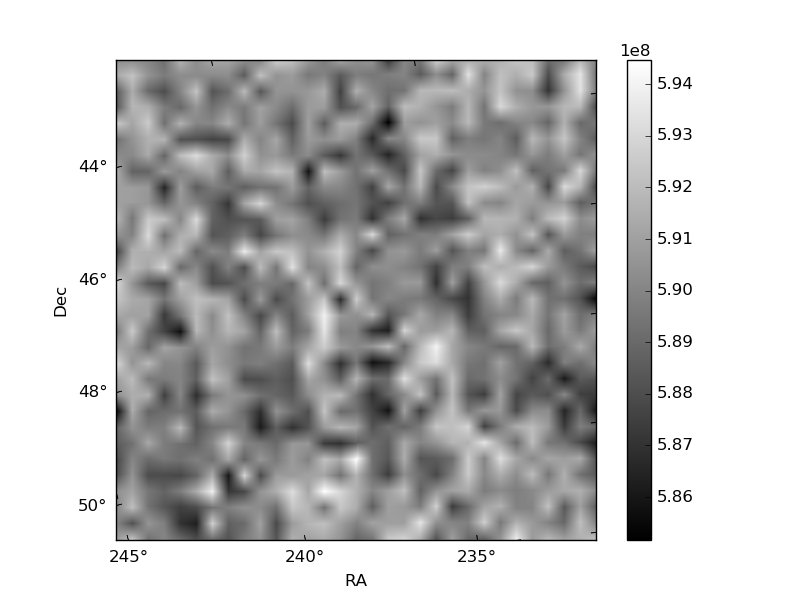
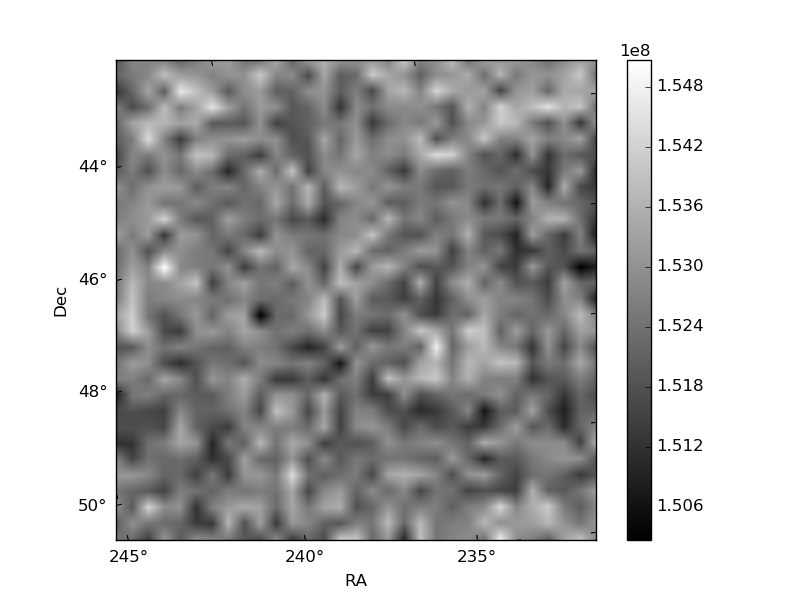
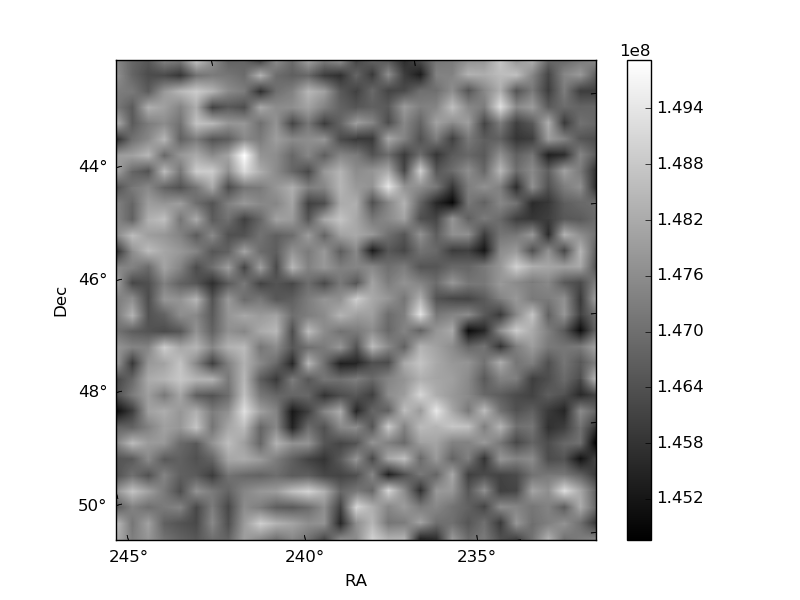
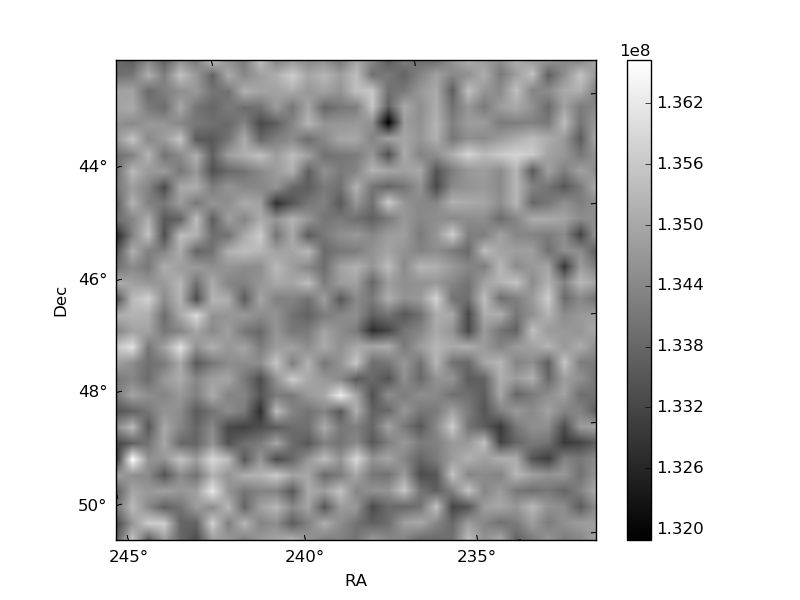
Histogram calculated using DETX and DETY for each event in the final _common_clean file
| Quadrant A | 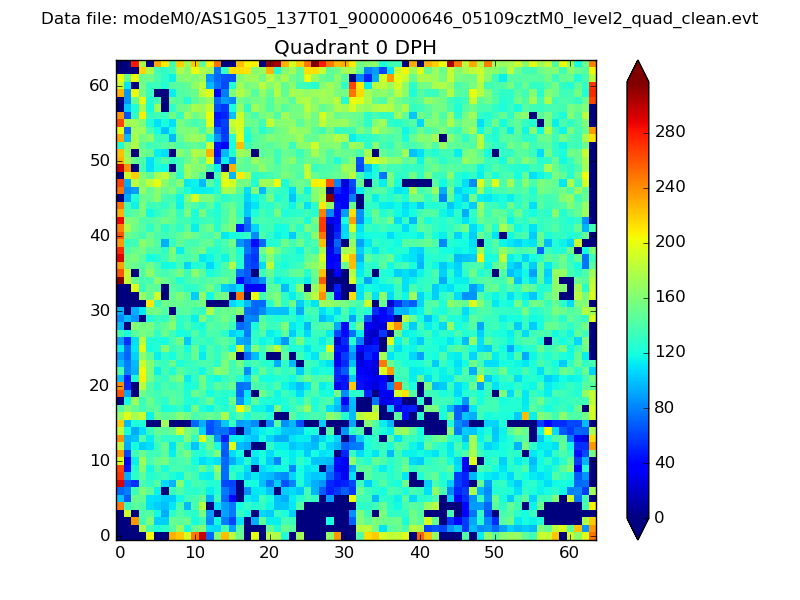 |
 |
Quadrant B |
|---|---|---|---|
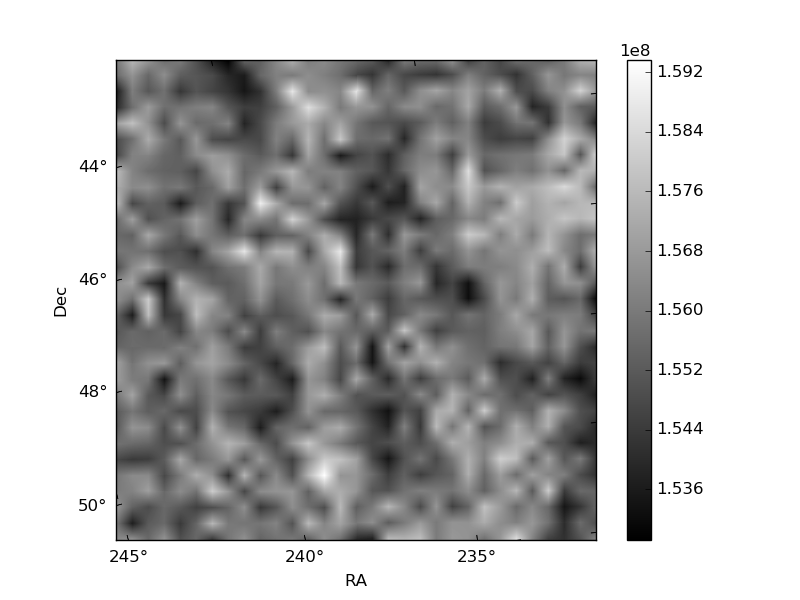
| Quadrant D | 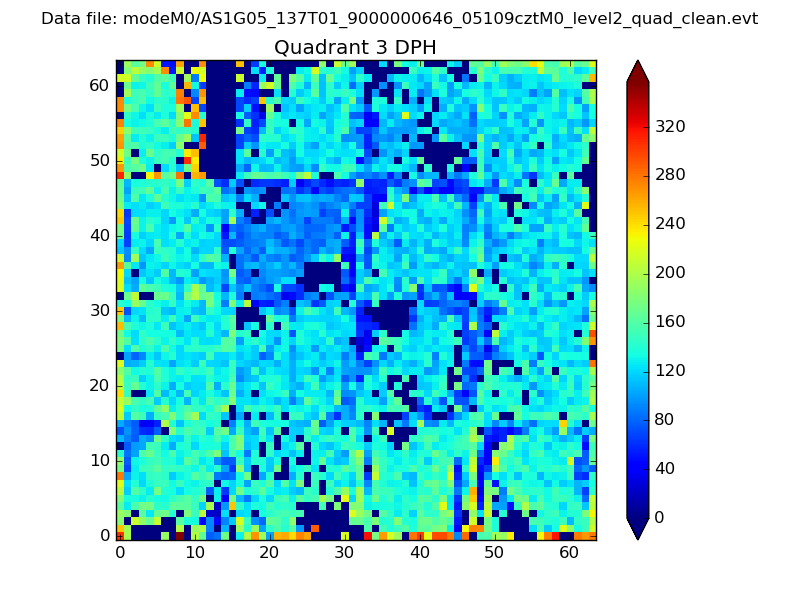 |
 |
Quadrant C |
| Plot type | Count rate plots | Images |
|---|---|---|
| Comparison with Poisson distribution Blue bars denote a histogram of data divided into 1 sec bins. Red curve is a Poisson curve with rate = median count rate of data. |
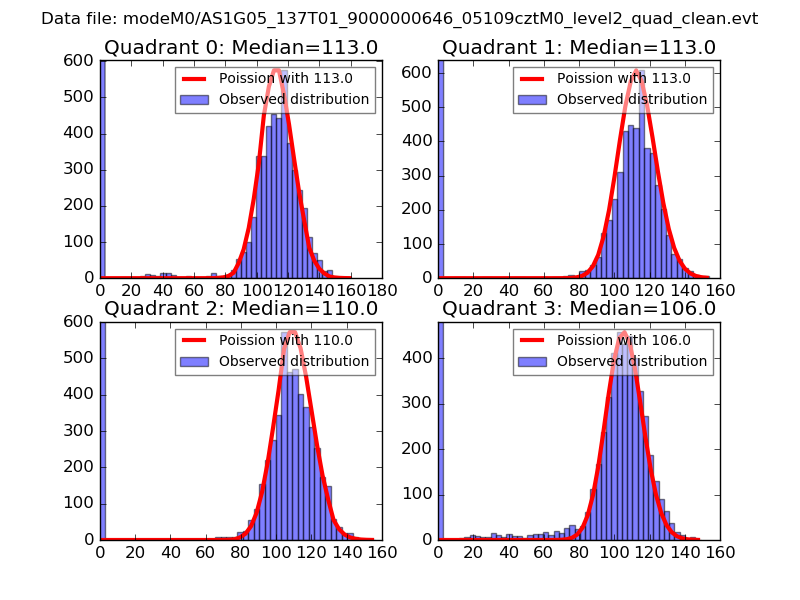 |
 |
| Quadrant-wise count rates Data is divided into 100 sec bins |
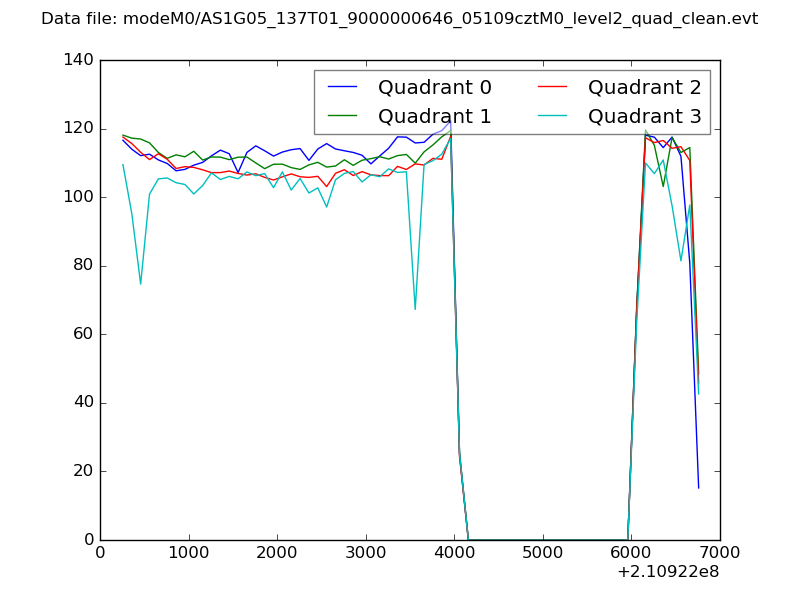 |
|
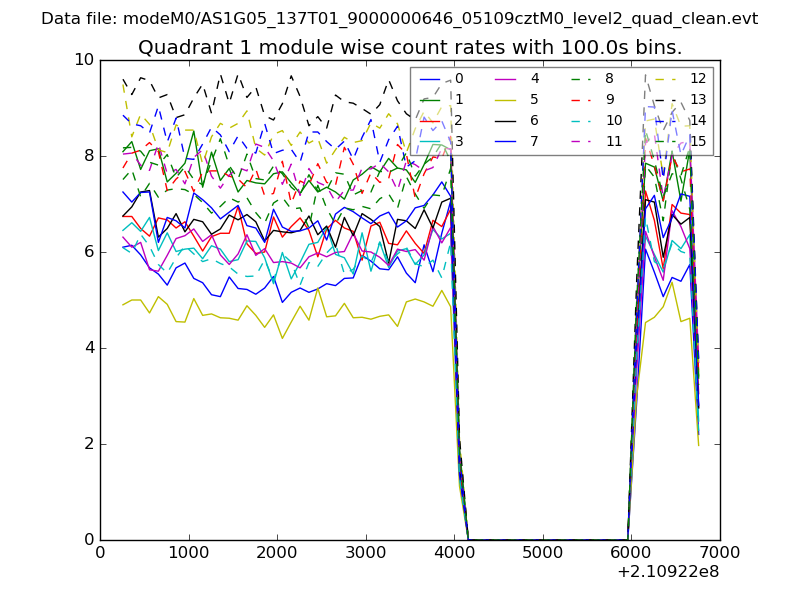
| Module-wise count rates for Quadrant A Data is divided into 100 sec bins |
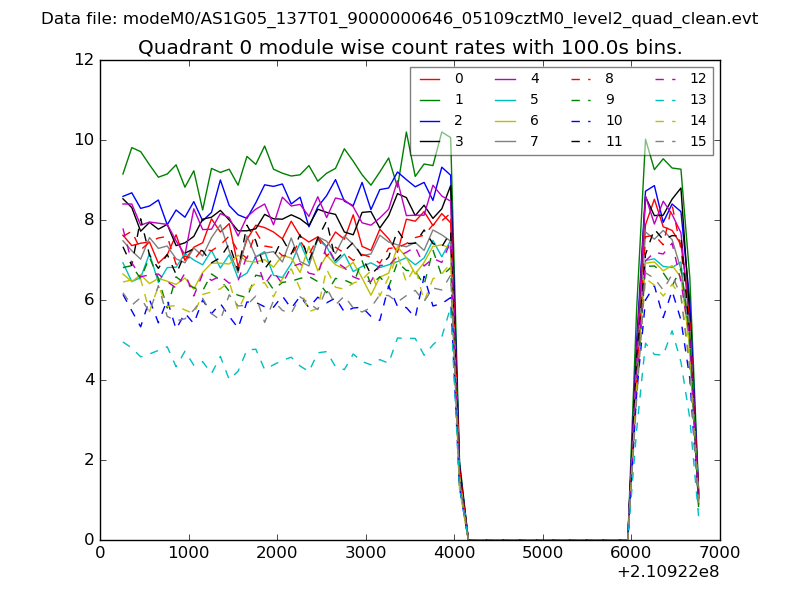 |
 |
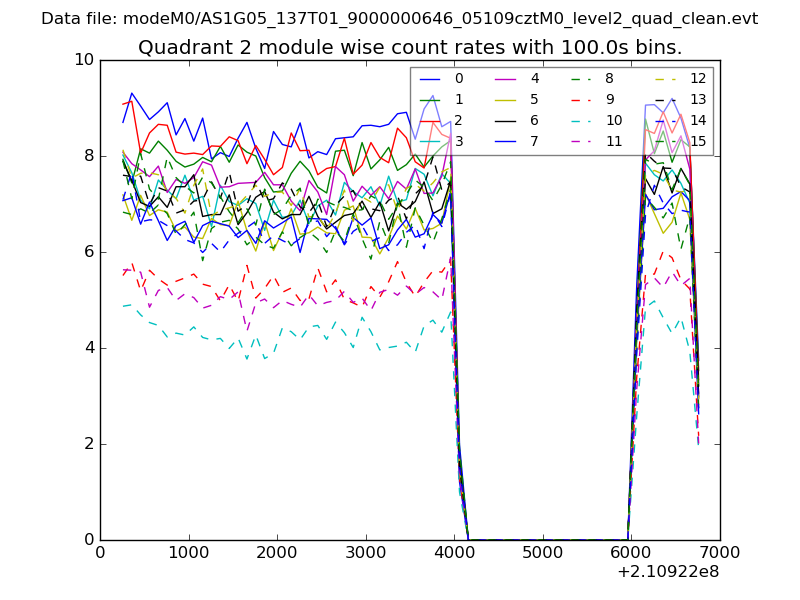
| Module-wise count rates for Quadrant B Data is divided into 100 sec bins |
 |
 |
| Module-wise count rates for Quadrant C Data is divided into 100 sec bins |
 |
 |
| Module-wise count rates for Quadrant D Data is divided into 100 sec bins |
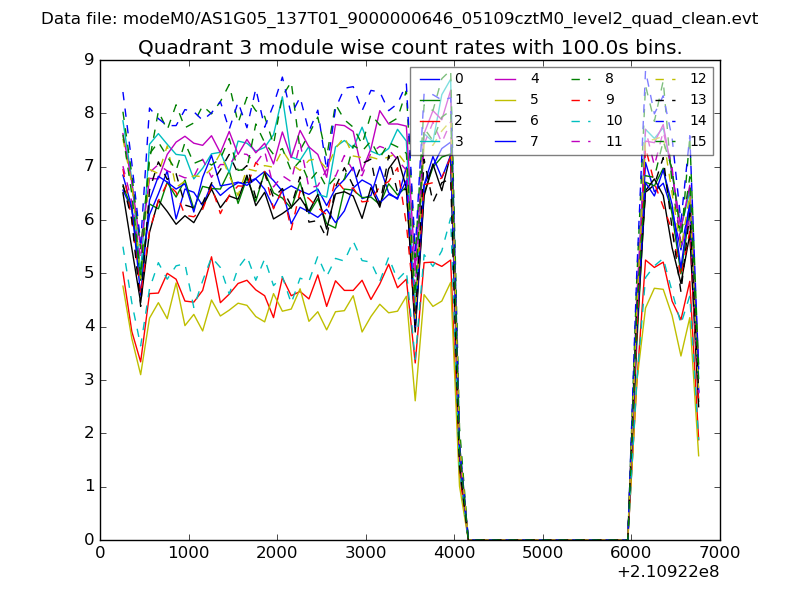 |
 |
| Parameter | Plot |
|---|---|
| CZT HV Monitor | 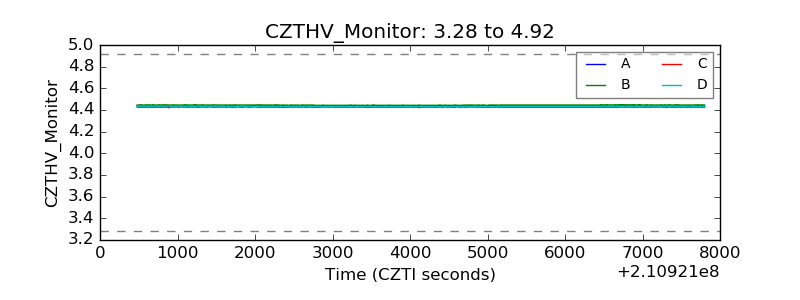 |
| D_VDD | 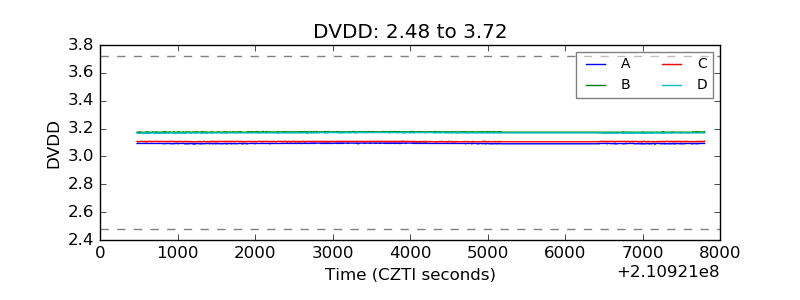 |
| Temperature 1 | 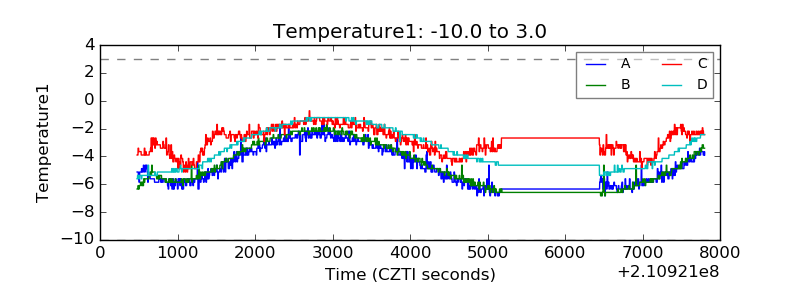 |
| Veto HV Monitor | 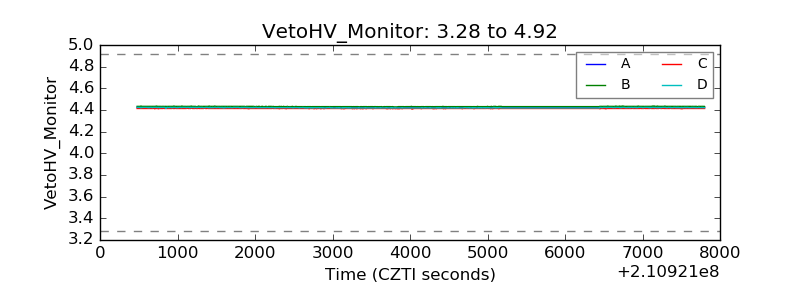 |
| Veto LLD | 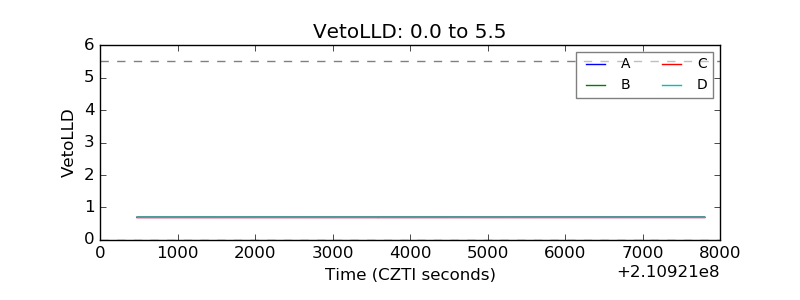 |
| Alpha Counter | 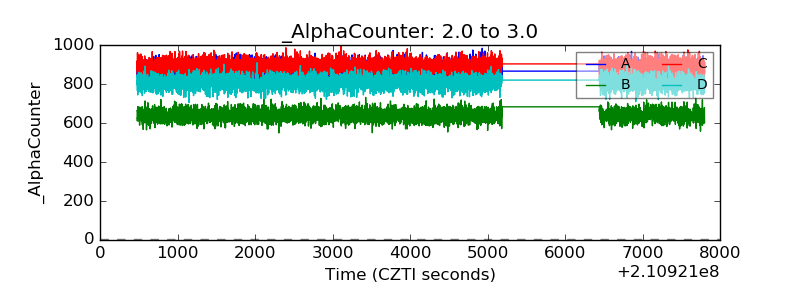 |
| _CPM_Rate | 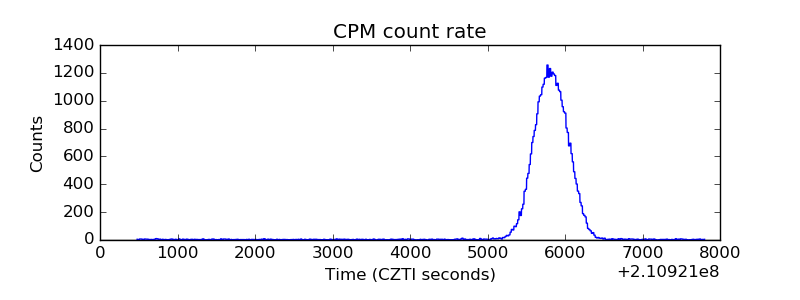 |
| CZT Counter | 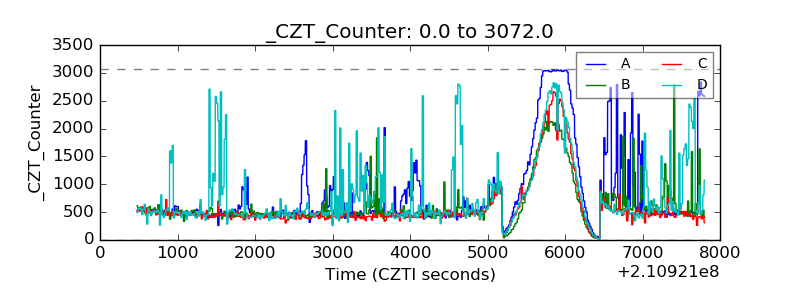 |
| +2.5 Volts monitor | 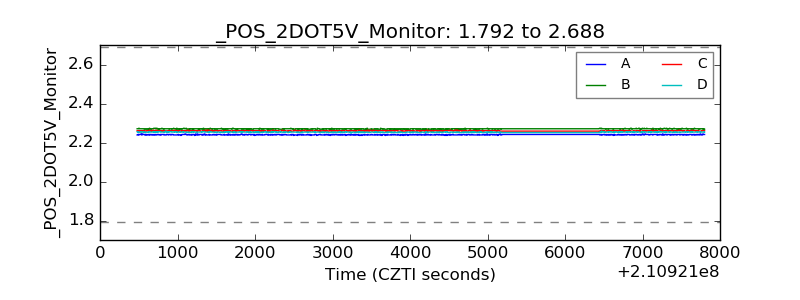 |
| +5 Volts monitor |  |
| _ROLL_ROT | 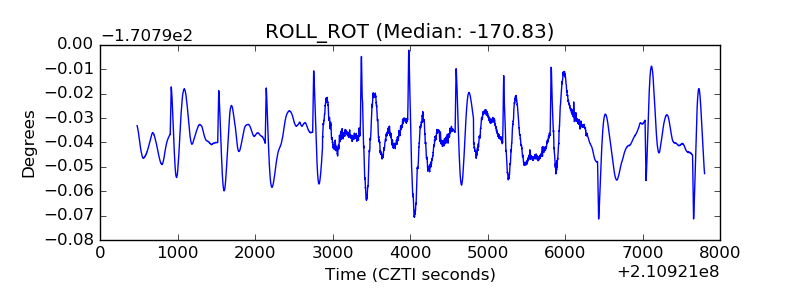 |
| _Roll_DEC | 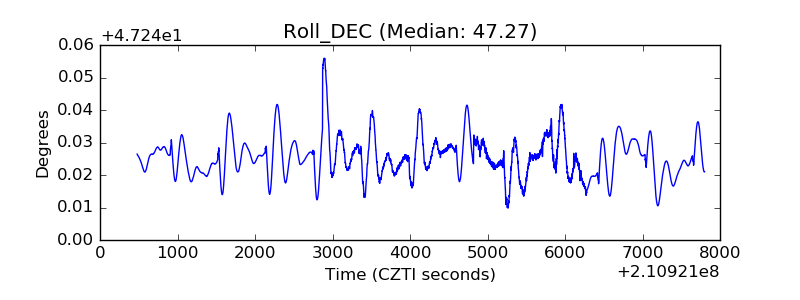 |
| _Roll_RA | 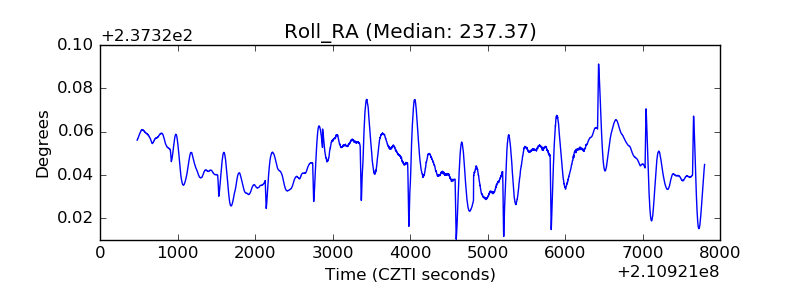 |
| Veto Counter | 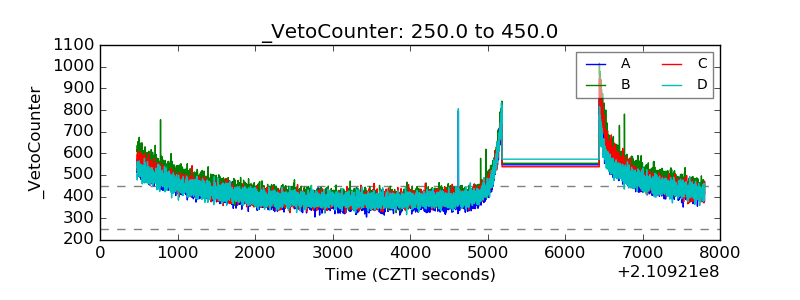 |