| Param | Original file | Final file |
|---|---|---|
| Filename | modeM0/AS1G05_137T01_9000000646_05113cztM0_level2.evt | modeM0/AS1G05_137T01_9000000646_05113cztM0_level2_quad_clean.evt |
| Size (bytes) | 674,311,680 | 79,597,440 |
| Size | 643.1 MB | 75.9 MB |
| Events in quadrant A | 3,158,686 | 522,464 |
| Events in quadrant B | 6,063,272 | 475,901 |
| Events in quadrant C | 3,035,814 | 496,607 |
| Events in quadrant D | 7,691,551 | 428,307 |
| Mode SS | |||
|---|---|---|---|
| Quadrant | BADHDUFLAG | Total packets | Discarded packets |
| A | 0 | 140 | 0 |
| B | 0 | 140 | 0 |
| C | 0 | 140 | 0 |
| D | 0 | 140 | 0 |
| Mode M0 | |||
|---|---|---|---|
| Quadrant | BADHDUFLAG | Total packets | Discarded packets |
| A | 0 | 14493 | 1 |
| B | 0 | 22714 | 0 |
| C | 0 | 14316 | 0 |
| D | 0 | 27560 | 0 |
| Mode M9 | |||
|---|---|---|---|
| Quadrant | BADHDUFLAG | Total packets | Discarded packets |
| A | 0 | 4 | 0 |
| B | 0 | 4 | 0 |
| C | 0 | 4 | 0 |
| D | 0 | 4 | 0 |
| Quadrant | Total seconds | Saturated seconds | Saturation percentage |
|---|---|---|---|
| A | 6982 | 68 | 0.973933% |
| B | 6982 | 736 | 10.541392% |
| C | 6982 | 47 | 0.673160% |
| D | 6982 | 1436 | 20.567173% |
Noise dominated data is calculated using 1-second bins in cleaned event files. If a bin has >2000 counts, and if more than 50% of those come from <1% of pixels, then it is considered to be noise-dominated and hence unusable.
| Quadrant | # 1 sec bins | Bins with >0 counts | Bins with >2000 counts | High rate bins dominated by noise | Noise dominated (total time) | Noise dominated (detector-on time) | Marked lightcurve |
|---|---|---|---|---|---|---|---|
| A | 7292 | 6983 | 6 | 6 | 0.08% | 0.09% | 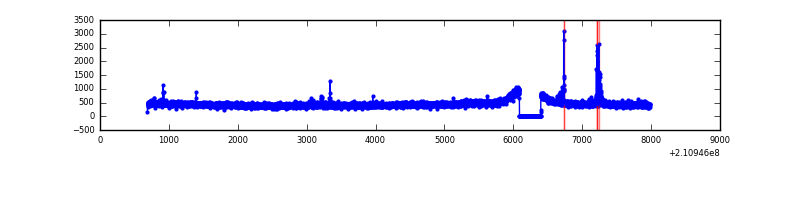 |
| B | 7292 | 6983 | 565 | 565 | 7.75% | 8.09% | 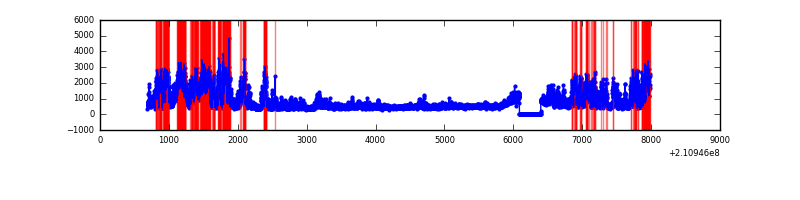 |
| C | 7292 | 6983 | 0 | 0 | 0.00% | 0.00% | 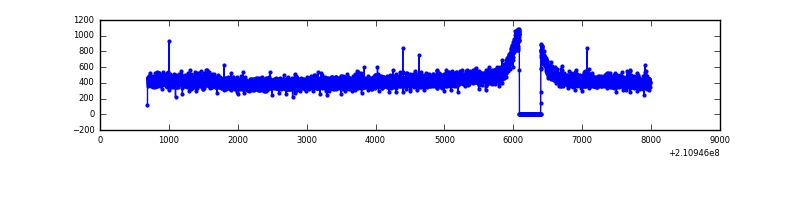 |
| D | 7292 | 6983 | 1041 | 1041 | 14.28% | 14.91% | 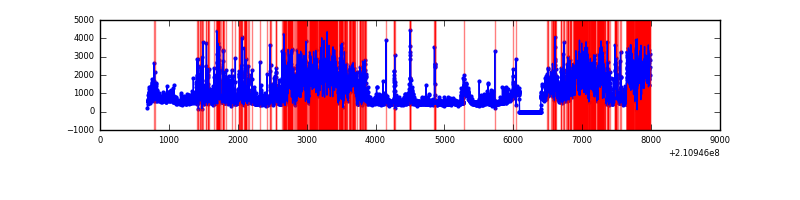 |
Top three noisy pixels from each quadrant. If the there are fewer than three noisy pixels in the level2.evt file, extra rows are filled as -1
| Pixel properties | Quadrant properties | ||||||
|---|---|---|---|---|---|---|---|
| Quadrant | DetID | PixID | Counts | Sigma | Mean | Median | Sigma |
| A | 15 | 174 | 34364 | 203.41 | 805 | 786 | 165.1 |
| A | 0 | 50 | 22270 | 130.15 | 805 | 786 | 165.1 |
| A | 12 | 194 | 8174 | 44.76 | 805 | 786 | 165.1 |
| B | 8 | 3 | 2647124 | 17662.28 | 783 | 766 | 149.8 |
| B | 4 | 48 | 102528 | 679.18 | 783 | 766 | 149.8 |
| B | 10 | 16 | 100776 | 667.48 | 783 | 766 | 149.8 |
| C | 13 | 61 | 6185 | 29.76 | 776 | 781 | 181.6 |
| C | 1 | 16 | 4037 | 17.93 | 776 | 781 | 181.6 |
| C | 12 | 4 | 3508 | 15.02 | 776 | 781 | 181.6 |
| D | 12 | 22 | 2059566 | 11564.6 | 725 | 703 | 178.0 |
| D | 13 | 235 | 1130210 | 6344.42 | 725 | 703 | 178.0 |
| D | 2 | 33 | 905841 | 5084.14 | 725 | 703 | 178.0 |
Histogram calculated using DETX and DETY for each event in the final _common_clean file
| Quadrant A | 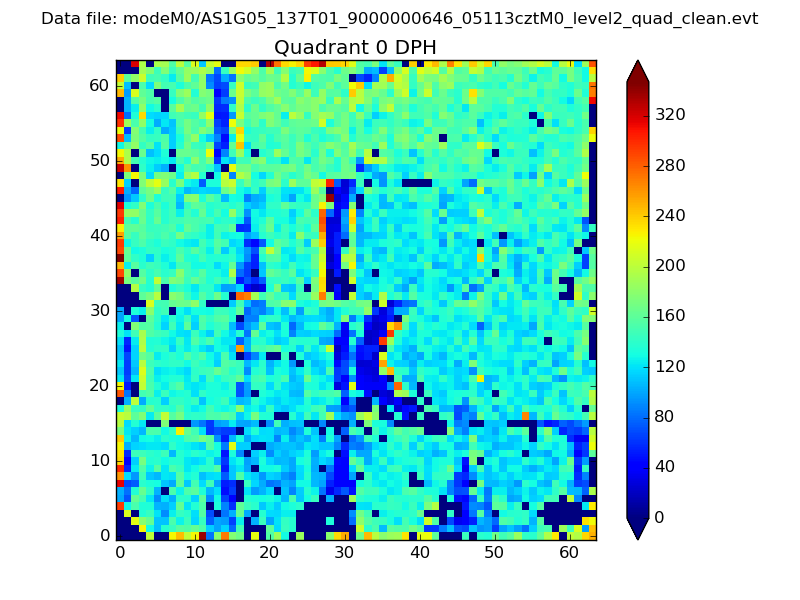 |
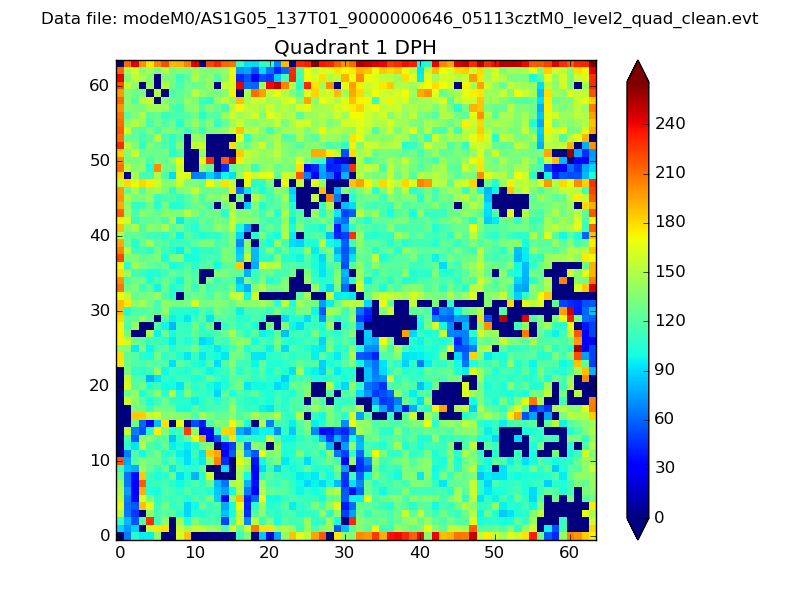 |
Quadrant B |
|---|---|---|---|
| Quadrant D |  |
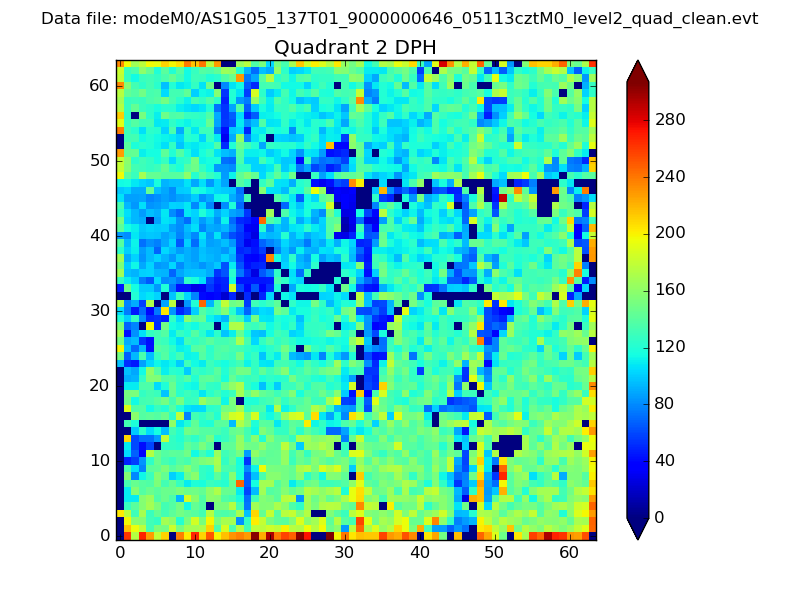 |
Quadrant C |
| Plot type | Count rate plots | Images |
|---|---|---|
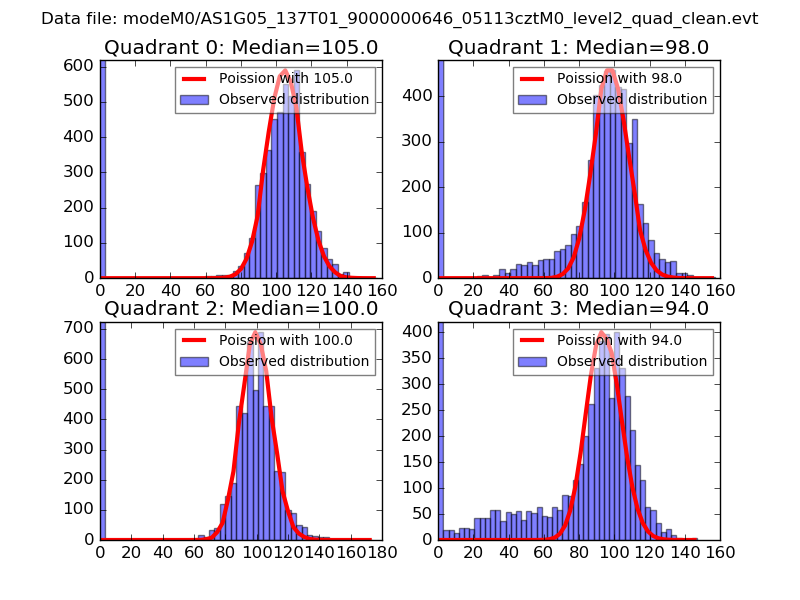
| Comparison with Poisson distribution Blue bars denote a histogram of data divided into 1 sec bins. Red curve is a Poisson curve with rate = median count rate of data. |
 |
 |
| Quadrant-wise count rates Data is divided into 100 sec bins |
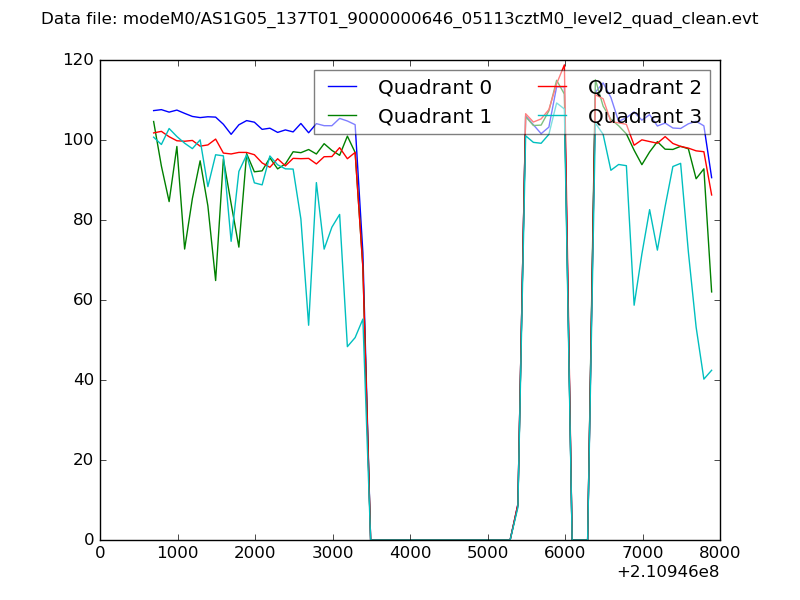 |
|
| Module-wise count rates for Quadrant A Data is divided into 100 sec bins |
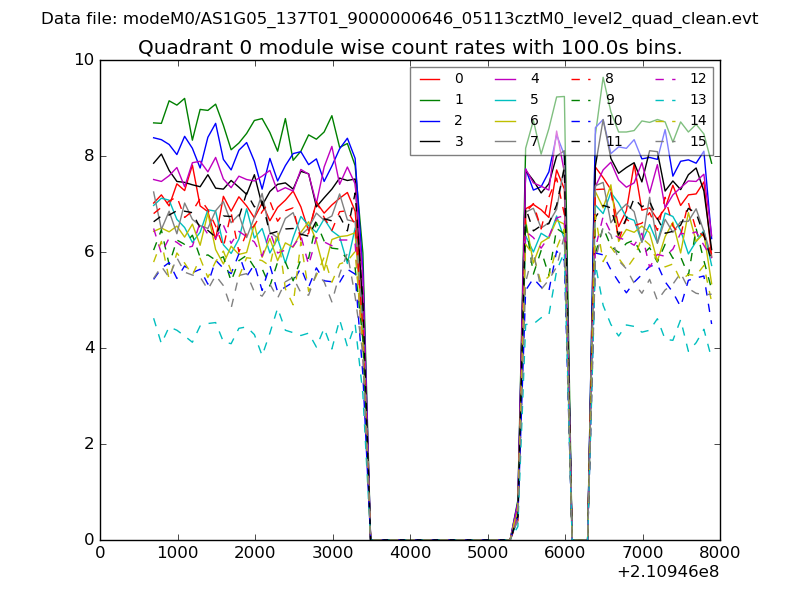 |
 |
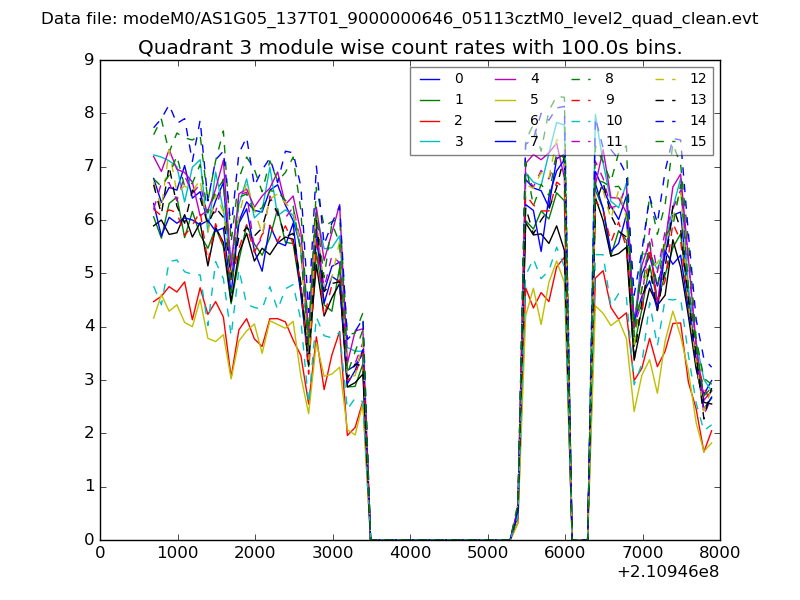
| Module-wise count rates for Quadrant B Data is divided into 100 sec bins |
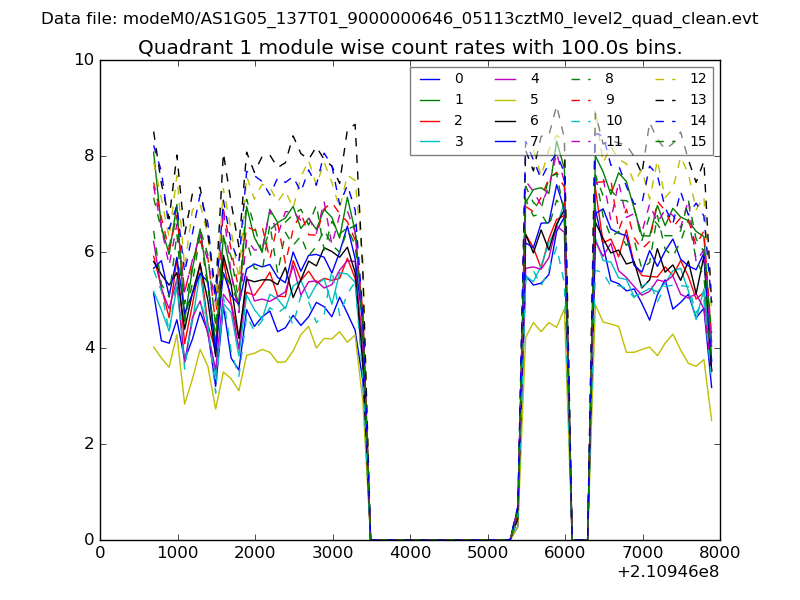 |
 |
| Module-wise count rates for Quadrant C Data is divided into 100 sec bins |
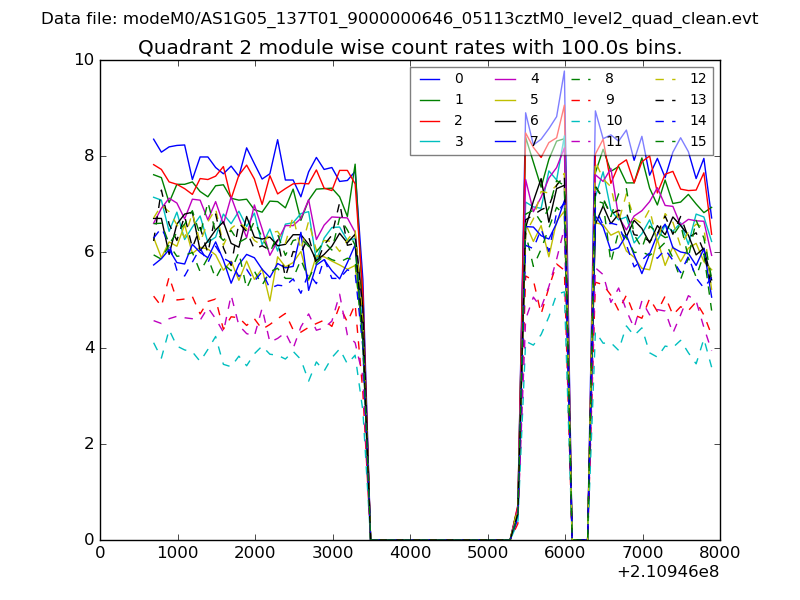 |
 |
| Module-wise count rates for Quadrant D Data is divided into 100 sec bins |
 |
 |
| Parameter | Plot |
|---|---|
| CZT HV Monitor | 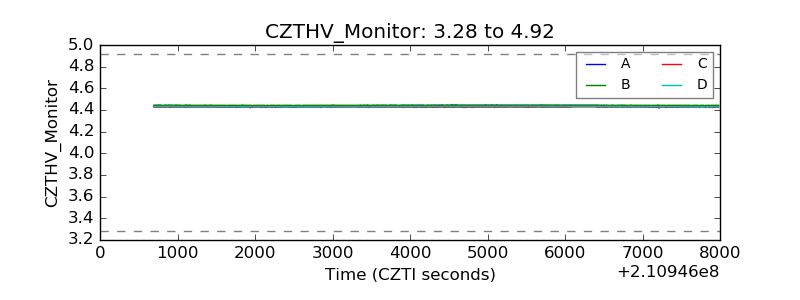 |
| D_VDD | 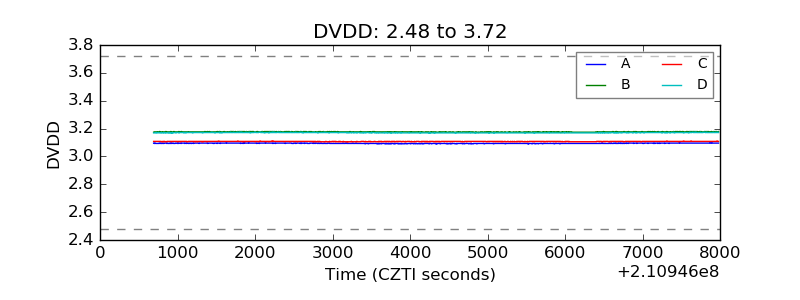 |
| Temperature 1 | 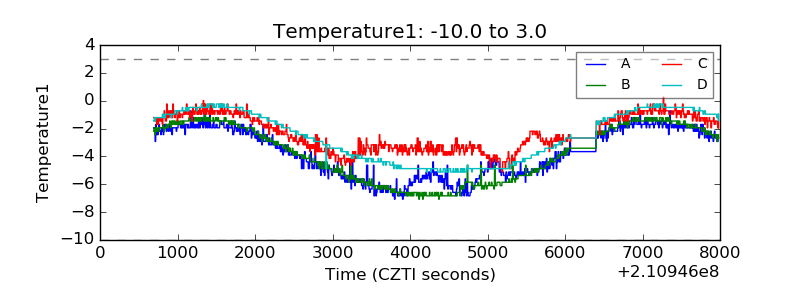 |
| Veto HV Monitor | 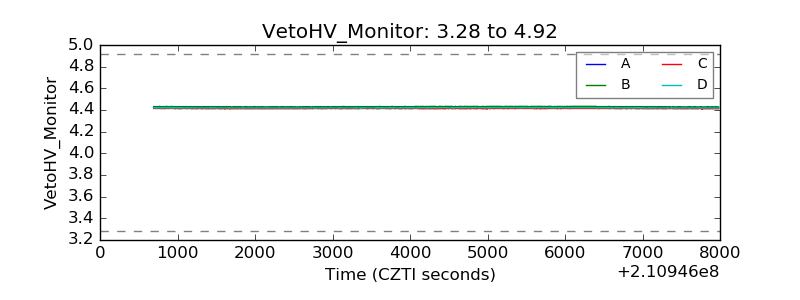 |
| Veto LLD | 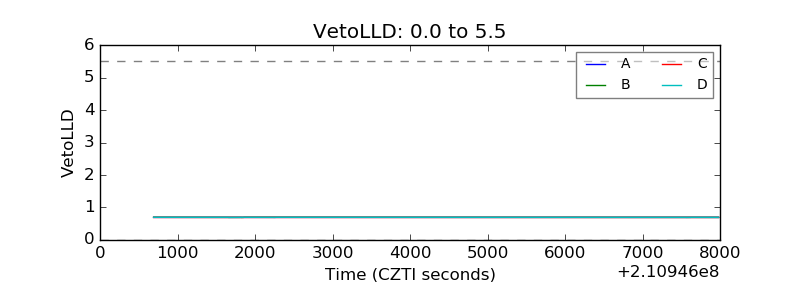 |
| Alpha Counter | 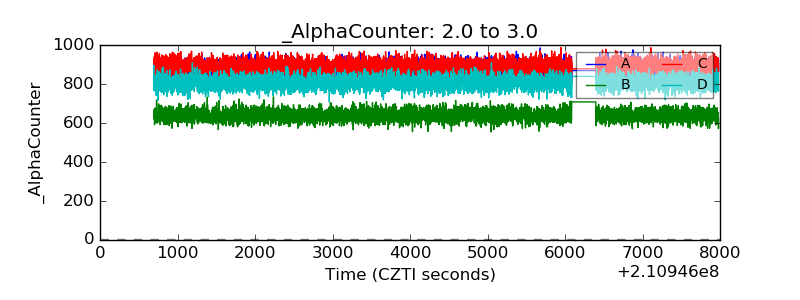 |
| _CPM_Rate | 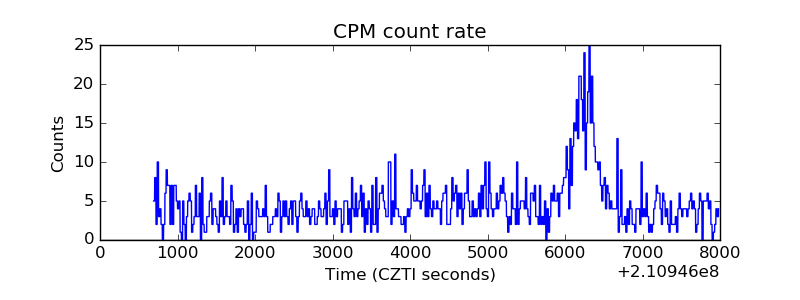 |
| CZT Counter |  |
| +2.5 Volts monitor |  |
| +5 Volts monitor | 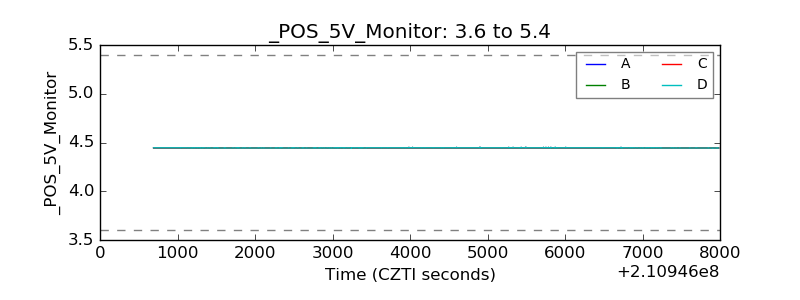 |
| _ROLL_ROT | 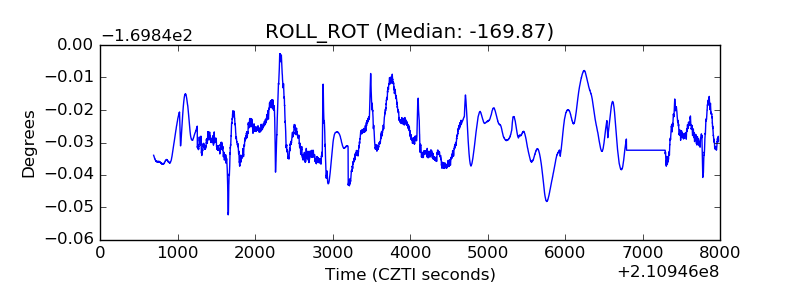 |
| _Roll_DEC | 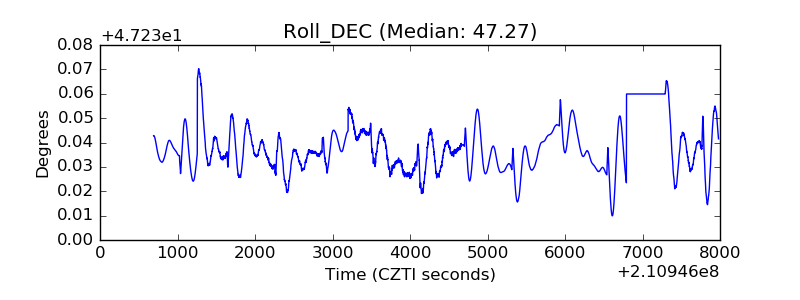 |
| _Roll_RA |  |
| Veto Counter | 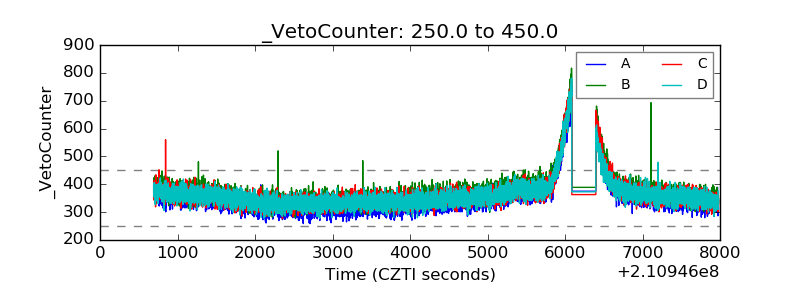 |