| Param | Original file | Final file |
|---|---|---|
| Filename | modeM0/AS1G05_137T01_9000000646_05114cztM0_level2.evt | modeM0/AS1G05_137T01_9000000646_05114cztM0_level2_quad_clean.evt |
| Size (bytes) | 105,059,520 | 12,960,000 |
| Size | 100.2 MB | 12.4 MB |
| Events in quadrant A | 387,242 | 95,612 |
| Events in quadrant B | 909,531 | 81,512 |
| Events in quadrant C | 377,575 | 90,434 |
| Events in quadrant D | 1,442,636 | 53,366 |
| Mode SS | |||
|---|---|---|---|
| Quadrant | BADHDUFLAG | Total packets | Discarded packets |
| A | 0 | 20 | 0 |
| B | 0 | 20 | 2 |
| C | 0 | 20 | 0 |
| D | 0 | 20 | 2 |
| Mode M0 | |||
|---|---|---|---|
| Quadrant | BADHDUFLAG | Total packets | Discarded packets |
| A | 0 | 1982 | 104 |
| B | 0 | 3844 | 526 |
| C | 0 | 1980 | 109 |
| D | 0 | 5688 | 824 |
| Quadrant | Total seconds | Saturated seconds | Saturation percentage |
|---|---|---|---|
| A | 938 | 0 | 0.000000% |
| B | 885 | 115 | 12.994350% |
| C | 936 | 1 | 0.106838% |
| D | 860 | 471 | 54.767442% |
Noise dominated data is calculated using 1-second bins in cleaned event files. If a bin has >2000 counts, and if more than 50% of those come from <1% of pixels, then it is considered to be noise-dominated and hence unusable.
| Quadrant | # 1 sec bins | Bins with >0 counts | Bins with >2000 counts | High rate bins dominated by noise | Noise dominated (total time) | Noise dominated (detector-on time) | Marked lightcurve |
|---|---|---|---|---|---|---|---|
| A | 990 | 985 | 0 | 0 | 0.00% | 0.00% | 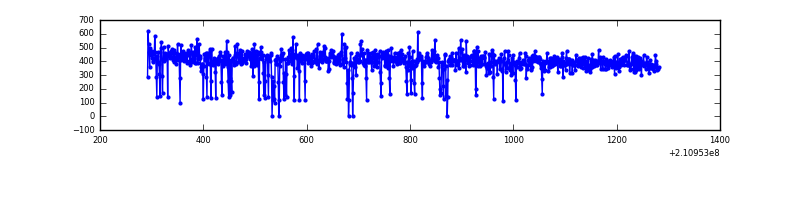 |
| B | 989 | 970 | 85 | 85 | 8.59% | 8.76% | 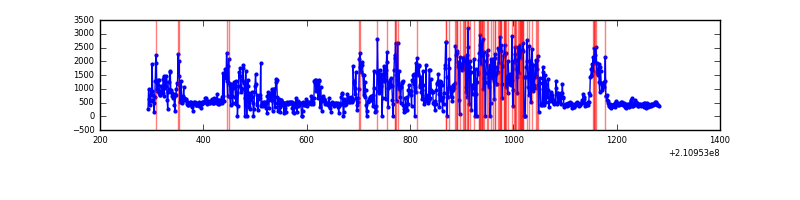 |
| C | 990 | 987 | 0 | 0 | 0.00% | 0.00% | 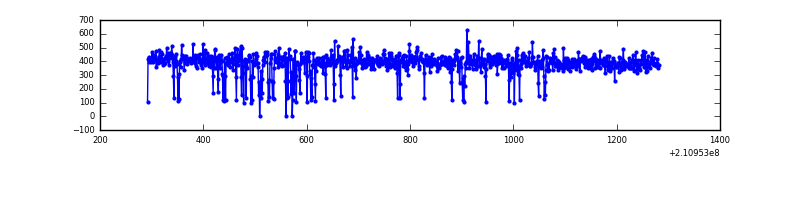 |
| D | 990 | 941 | 345 | 345 | 34.85% | 36.66% | 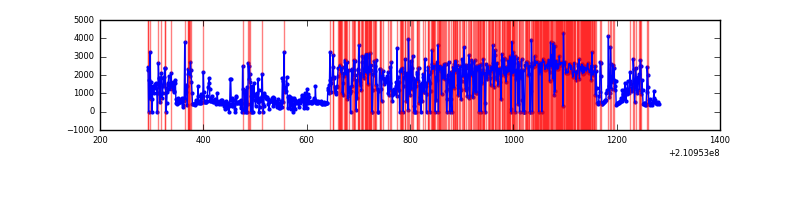 |
Top three noisy pixels from each quadrant. If the there are fewer than three noisy pixels in the level2.evt file, extra rows are filled as -1
| Pixel properties | Quadrant properties | ||||||
|---|---|---|---|---|---|---|---|
| Quadrant | DetID | PixID | Counts | Sigma | Mean | Median | Sigma |
| A | 12 | 194 | 1080 | 43.0 | 100 | 97 | 22.9 |
| A | 15 | 174 | 1022 | 40.46 | 100 | 97 | 22.9 |
| A | 0 | 226 | 1014 | 40.11 | 100 | 97 | 22.9 |
| B | 8 | 3 | 469070 | 24298.1 | 90 | 88 | 19.3 |
| B | 10 | 16 | 46586 | 2409.08 | 90 | 88 | 19.3 |
| B | 15 | 204 | 17516 | 902.95 | 90 | 88 | 19.3 |
| C | 13 | 61 | 811 | 29.6 | 96 | 96 | 24.2 |
| C | 1 | 16 | 549 | 18.76 | 96 | 96 | 24.2 |
| C | 12 | 4 | 543 | 18.51 | 96 | 96 | 24.2 |
| D | 12 | 22 | 1032088 | 61146.2 | 61 | 59 | 16.9 |
| D | 13 | 235 | 72051 | 4265.42 | 61 | 59 | 16.9 |
| D | 1 | 239 | 45867 | 2714.06 | 61 | 59 | 16.9 |
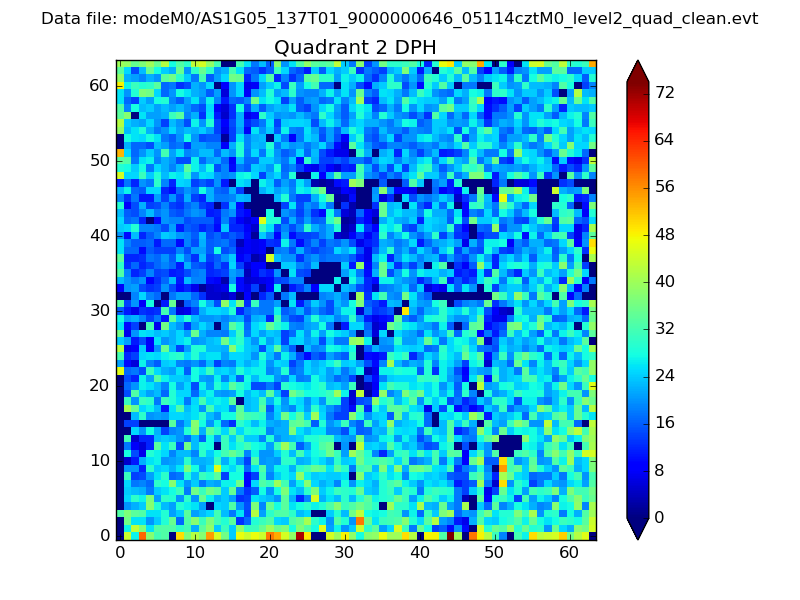
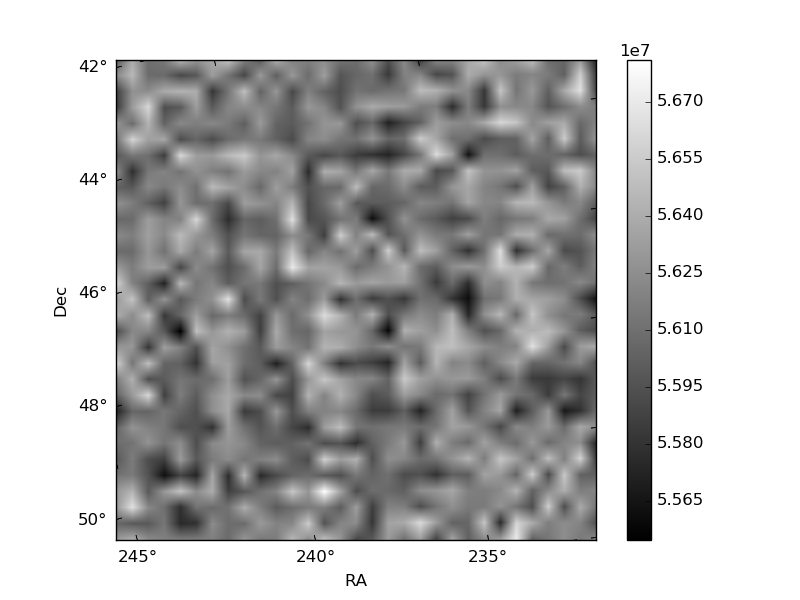
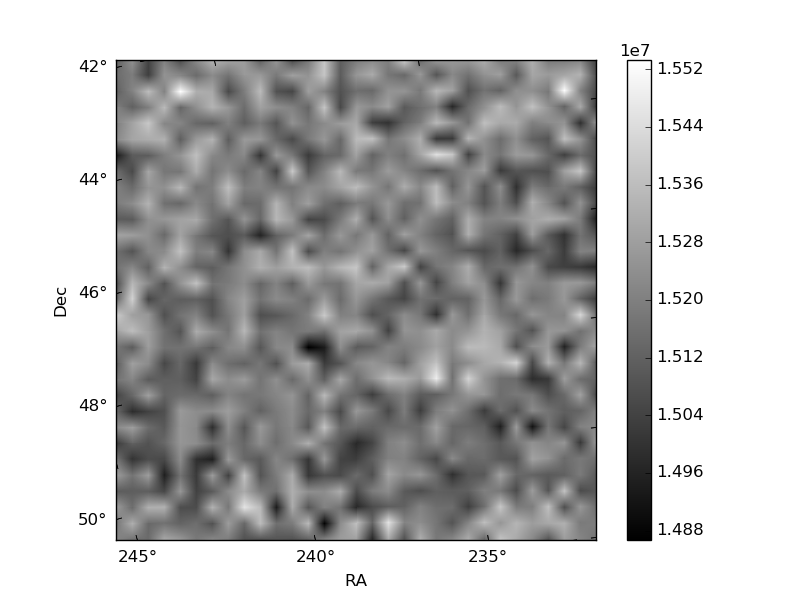
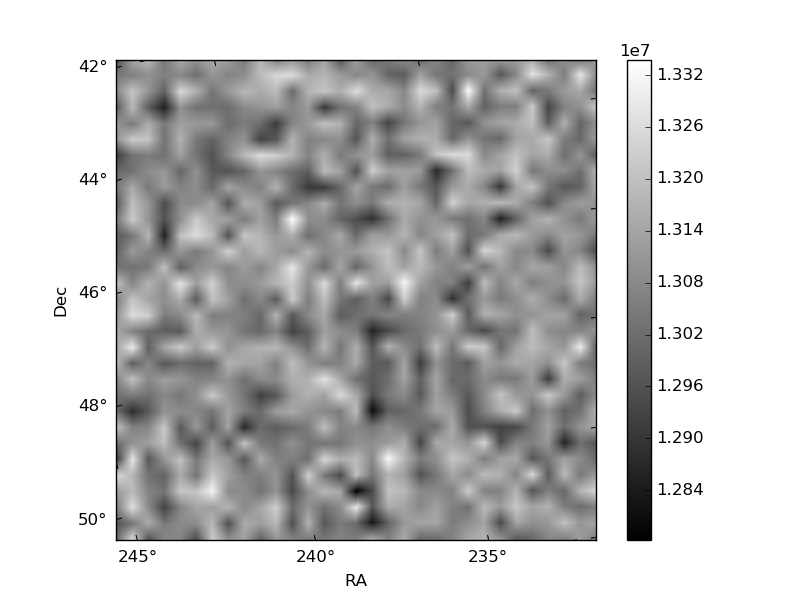
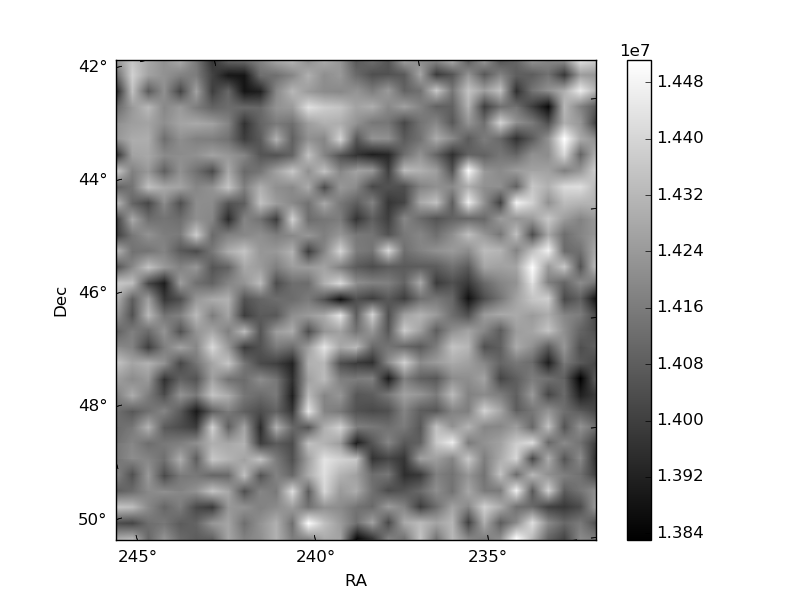
Histogram calculated using DETX and DETY for each event in the final _common_clean file
| Quadrant A | 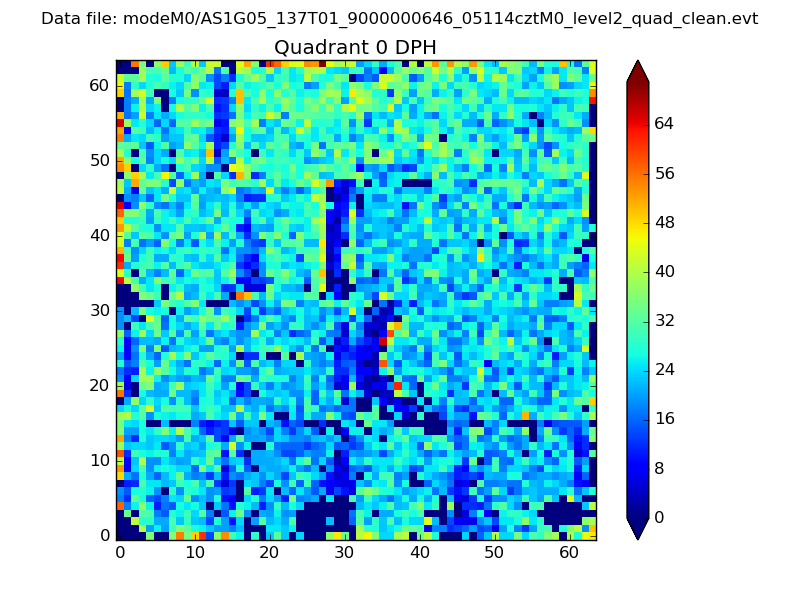 |
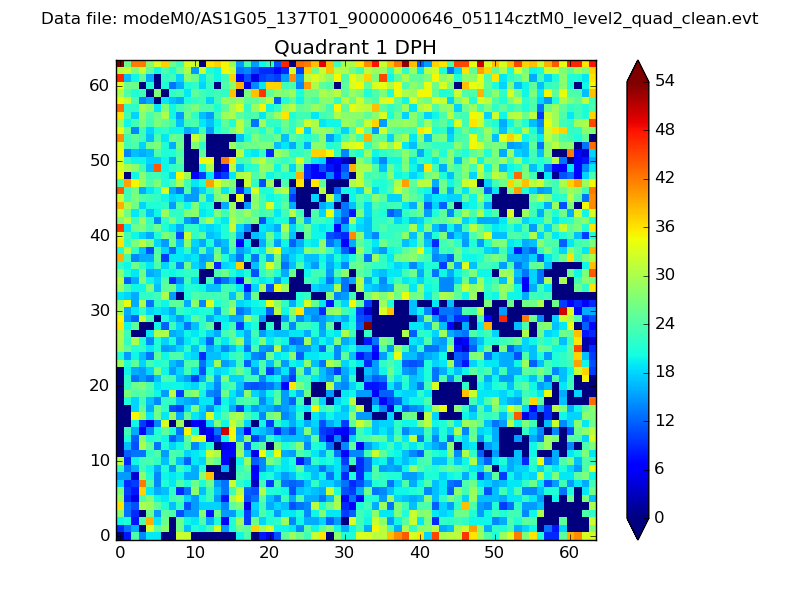 |
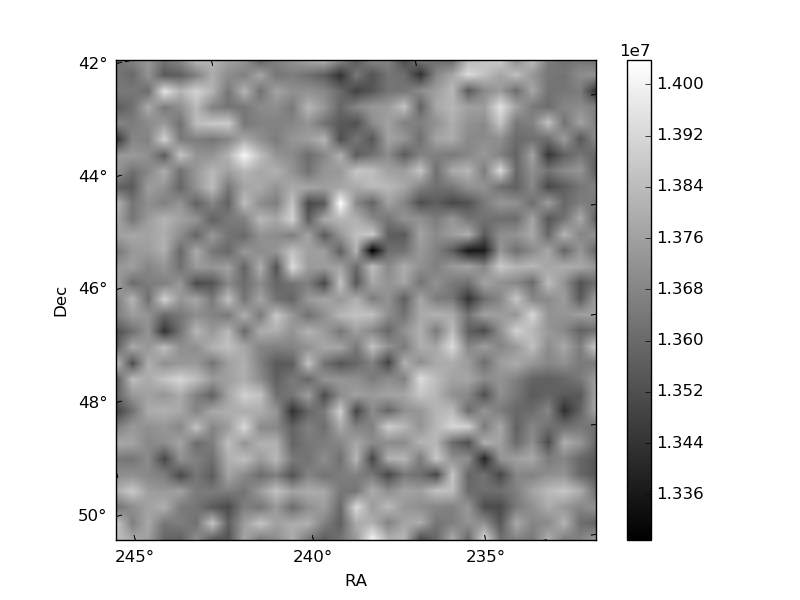
Quadrant B |
|---|---|---|---|
| Quadrant D | 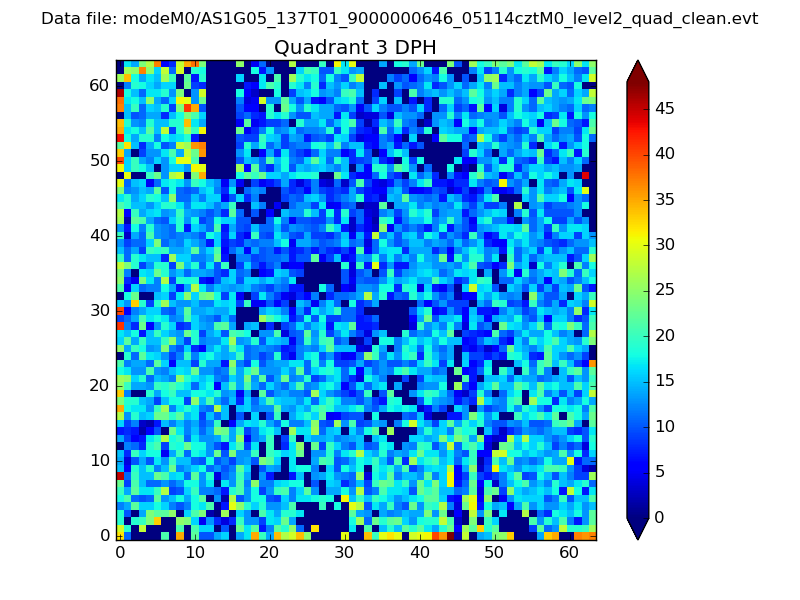 |
 |
Quadrant C |
| Plot type | Count rate plots | Images |
|---|---|---|
| Comparison with Poisson distribution Blue bars denote a histogram of data divided into 1 sec bins. Red curve is a Poisson curve with rate = median count rate of data. |
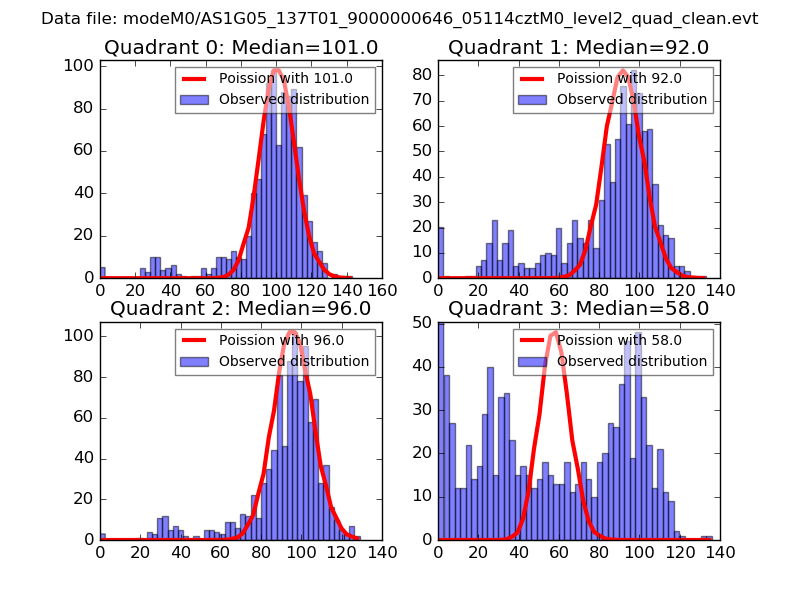 |
 |
| Quadrant-wise count rates Data is divided into 100 sec bins |
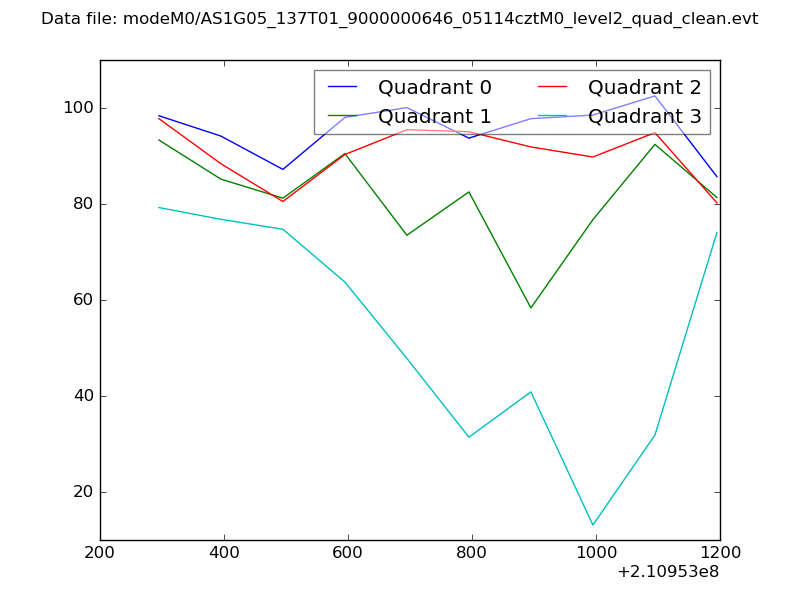 |
|
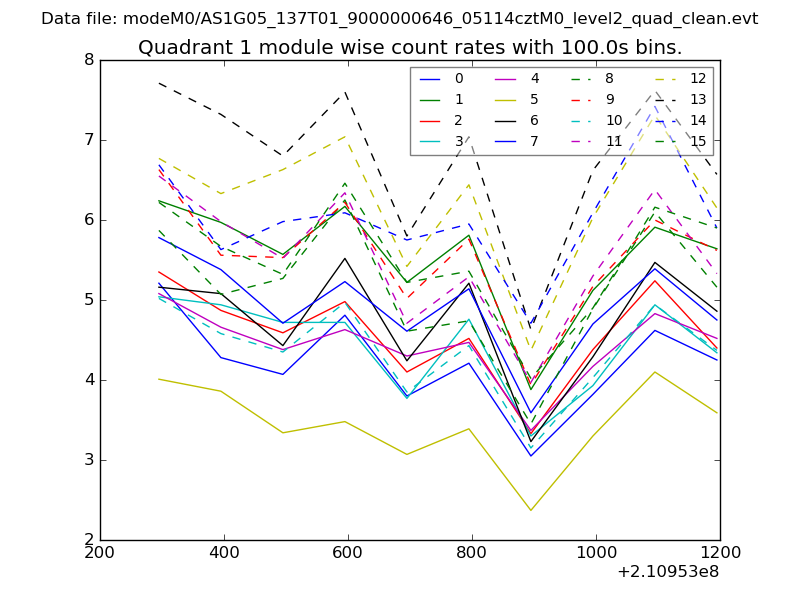
| Module-wise count rates for Quadrant A Data is divided into 100 sec bins |
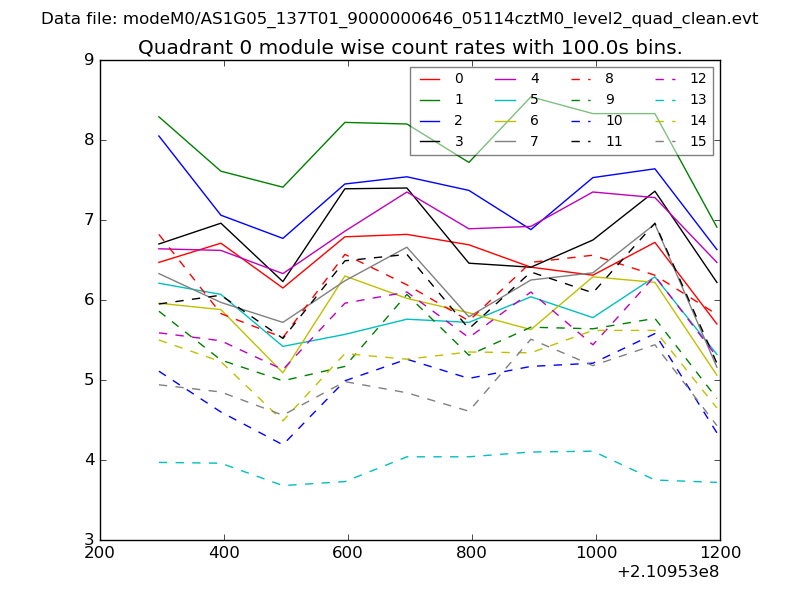 |
 |
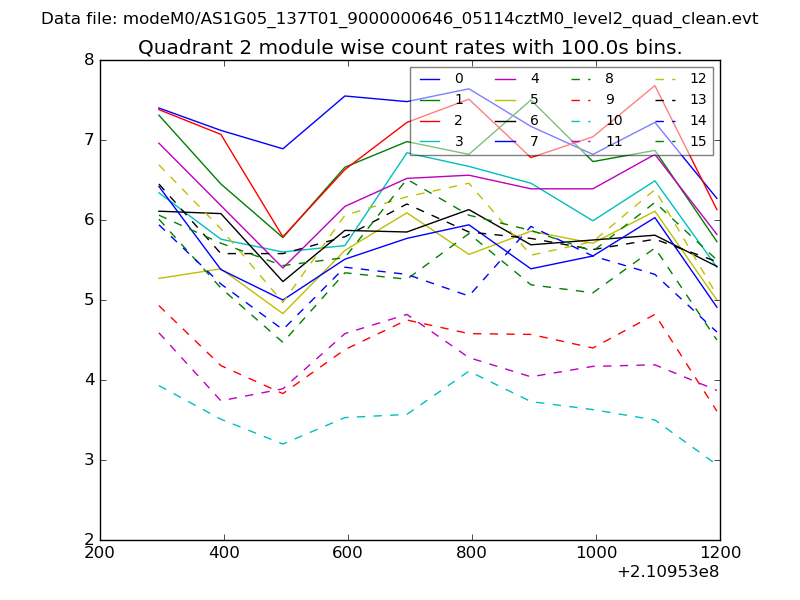
| Module-wise count rates for Quadrant B Data is divided into 100 sec bins |
 |
 |
| Module-wise count rates for Quadrant C Data is divided into 100 sec bins |
 |
 |
| Module-wise count rates for Quadrant D Data is divided into 100 sec bins |
 |
 |
| Parameter | Plot |
|---|---|
| CZT HV Monitor | 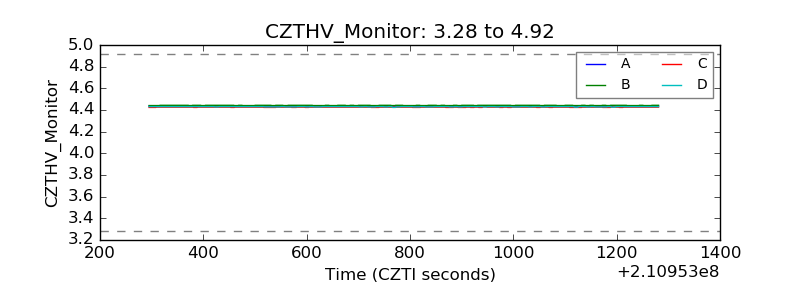 |
| D_VDD | 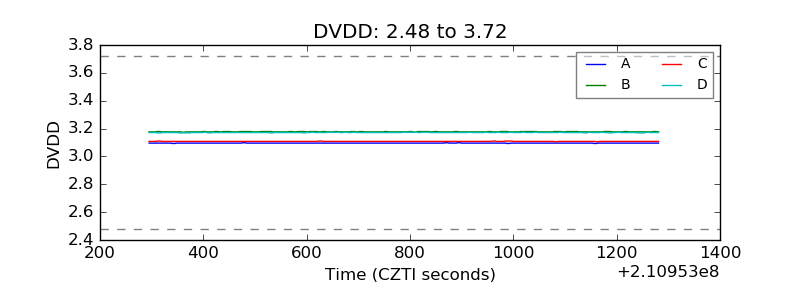 |
| Temperature 1 | 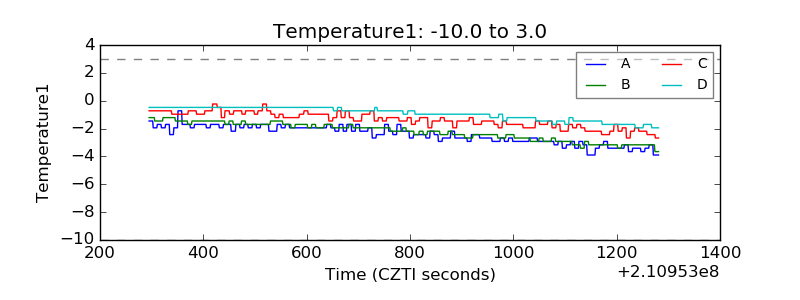 |
| Veto HV Monitor | 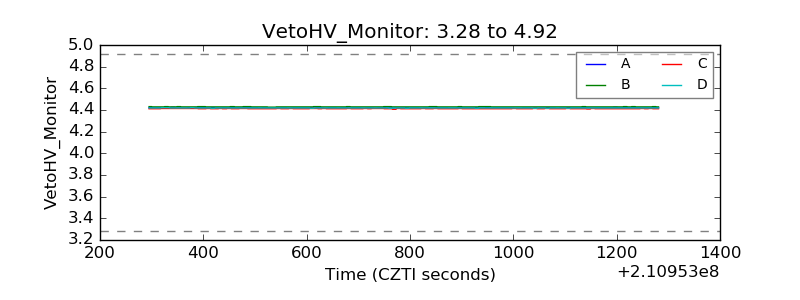 |
| Veto LLD | 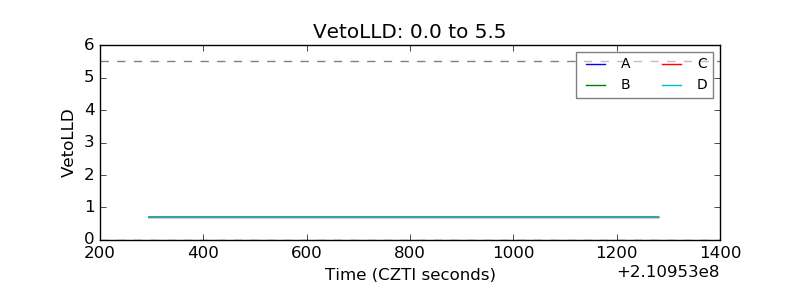 |
| Alpha Counter | 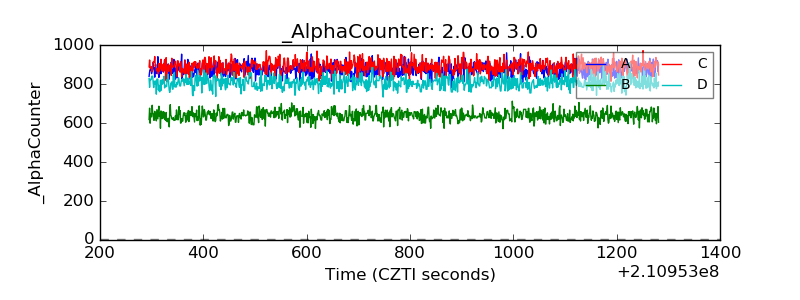 |
| _CPM_Rate | 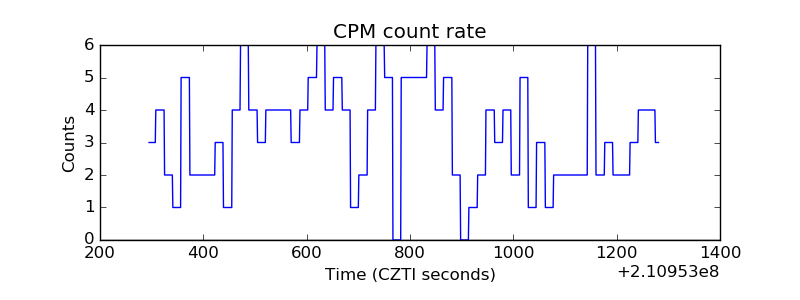 |
| CZT Counter | 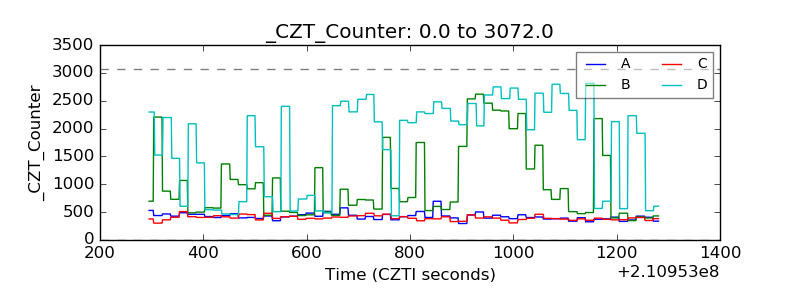 |
| +2.5 Volts monitor |  |
| +5 Volts monitor |  |
| _ROLL_ROT | 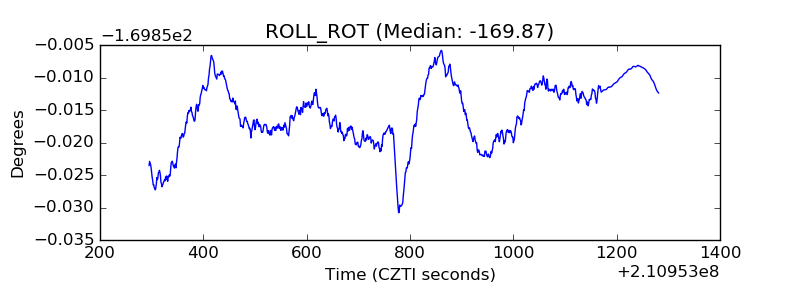 |
| _Roll_DEC | 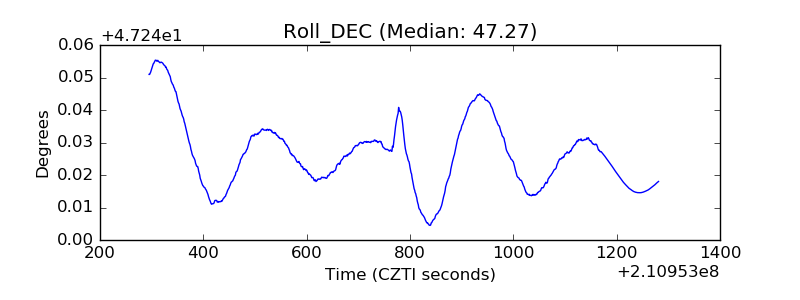 |
| _Roll_RA | 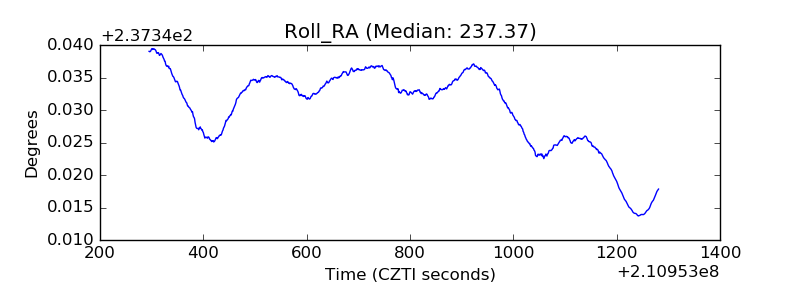 |
| Veto Counter | 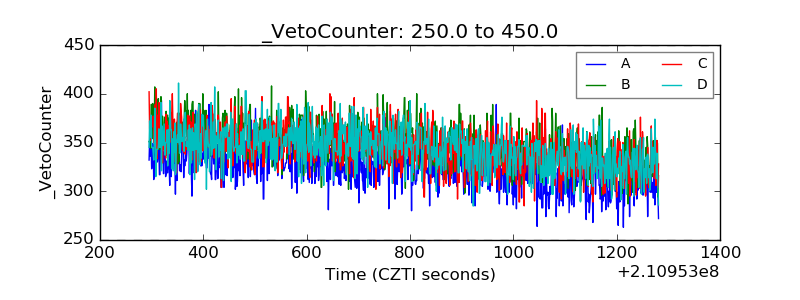 |