| Param | Original file | Final file |
|---|---|---|
| Filename | modeM0/AS1G05_230T05_9000000648_05114cztM0_level2.evt | modeM0/AS1G05_230T05_9000000648_05114cztM0_level2_quad_clean.evt |
| Size (bytes) | 307,298,880 | 45,023,040 |
| Size | 293.1 MB | 42.9 MB |
| Events in quadrant A | 1,999,620 | 269,577 |
| Events in quadrant B | 2,330,438 | 273,016 |
| Events in quadrant C | 1,949,401 | 270,345 |
| Events in quadrant D | 2,743,225 | 256,868 |
| Mode SS | |||
|---|---|---|---|
| Quadrant | BADHDUFLAG | Total packets | Discarded packets |
| A | 0 | 88 | 0 |
| B | 0 | 88 | 2 |
| C | 0 | 88 | 2 |
| D | 0 | 88 | 0 |
| Mode M0 | |||
|---|---|---|---|
| Quadrant | BADHDUFLAG | Total packets | Discarded packets |
| A | 0 | 8985 | 98 |
| B | 0 | 9757 | 140 |
| C | 0 | 8823 | 105 |
| D | 0 | 11119 | 154 |
| Mode M9 | |||
|---|---|---|---|
| Quadrant | BADHDUFLAG | Total packets | Discarded packets |
| A | 0 | 1 | 0 |
| B | 0 | 1 | 0 |
| C | 0 | 1 | 0 |
| D | 0 | 1 | 0 |
| Quadrant | Total seconds | Saturated seconds | Saturation percentage |
|---|---|---|---|
| A | 4158 | 152 | 3.655604% |
| B | 4144 | 185 | 4.464286% |
| C | 4153 | 72 | 1.733686% |
| D | 4152 | 200 | 4.816956% |
Noise dominated data is calculated using 1-second bins in cleaned event files. If a bin has >2000 counts, and if more than 50% of those come from <1% of pixels, then it is considered to be noise-dominated and hence unusable.
| Quadrant | # 1 sec bins | Bins with >0 counts | Bins with >2000 counts | High rate bins dominated by noise | Noise dominated (total time) | Noise dominated (detector-on time) | Marked lightcurve |
|---|---|---|---|---|---|---|---|
| A | 4387 | 4204 | 8 | 8 | 0.18% | 0.19% | 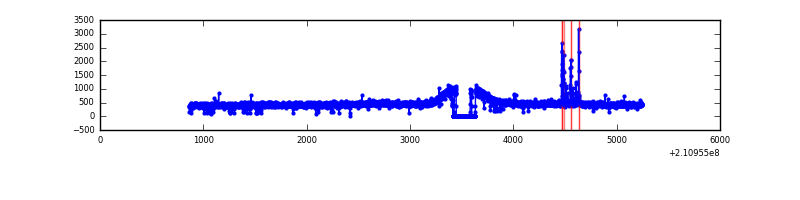 |
| B | 4387 | 4203 | 15 | 15 | 0.34% | 0.36% | 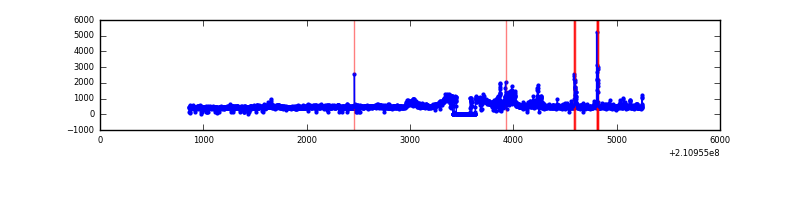 |
| C | 4387 | 4204 | 0 | 0 | 0.00% | 0.00% | 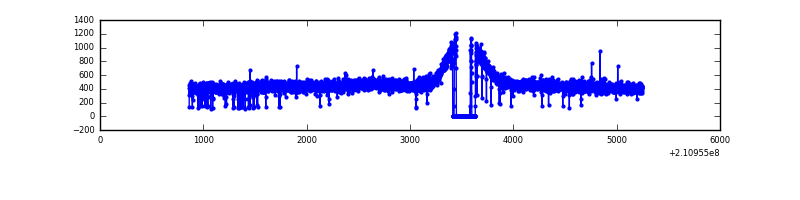 |
| D | 4387 | 4199 | 83 | 83 | 1.89% | 1.98% | 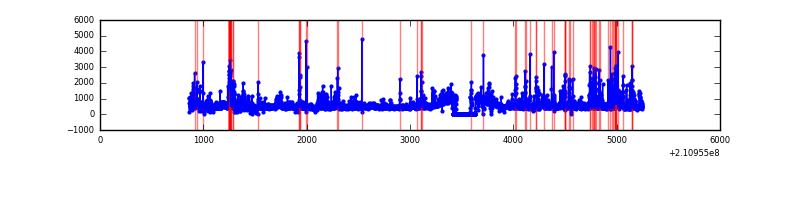 |
Top three noisy pixels from each quadrant. If the there are fewer than three noisy pixels in the level2.evt file, extra rows are filled as -1
| Pixel properties | Quadrant properties | ||||||
|---|---|---|---|---|---|---|---|
| Quadrant | DetID | PixID | Counts | Sigma | Mean | Median | Sigma |
| A | 15 | 174 | 52553 | 495.55 | 505 | 492 | 105.1 |
| A | 0 | 226 | 4978 | 42.7 | 505 | 492 | 105.1 |
| A | 12 | 194 | 4948 | 42.42 | 505 | 492 | 105.1 |
| B | 8 | 3 | 231052 | 2280.6 | 508 | 496 | 101.1 |
| B | 15 | 204 | 46326 | 453.34 | 508 | 496 | 101.1 |
| B | 5 | 200 | 28624 | 278.24 | 508 | 496 | 101.1 |
| C | 1 | 16 | 6207 | 48.9 | 495 | 496 | 116.8 |
| C | 8 | 128 | 4225 | 31.93 | 495 | 496 | 116.8 |
| C | 13 | 61 | 4158 | 31.35 | 495 | 496 | 116.8 |
| D | 1 | 239 | 342226 | 2785.37 | 491 | 476 | 122.7 |
| D | 13 | 235 | 242662 | 1973.89 | 491 | 476 | 122.7 |
| D | 2 | 136 | 108525 | 880.63 | 491 | 476 | 122.7 |
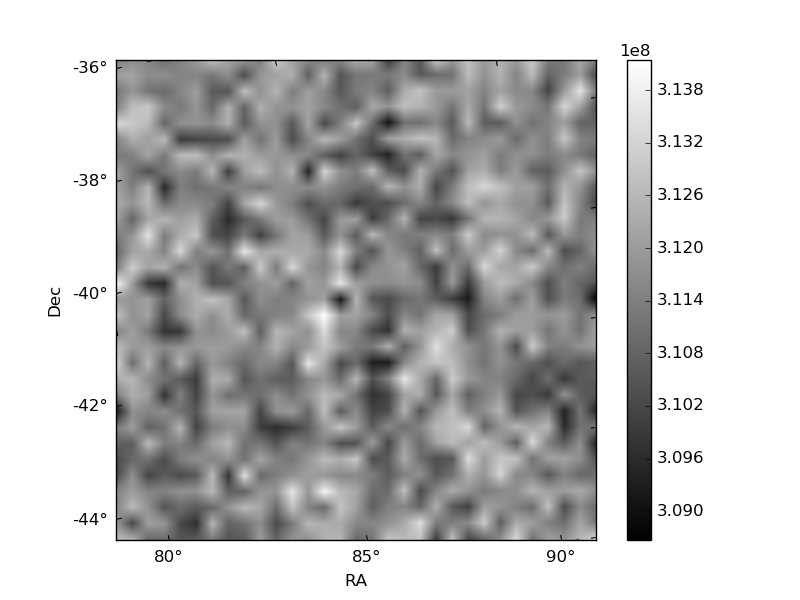
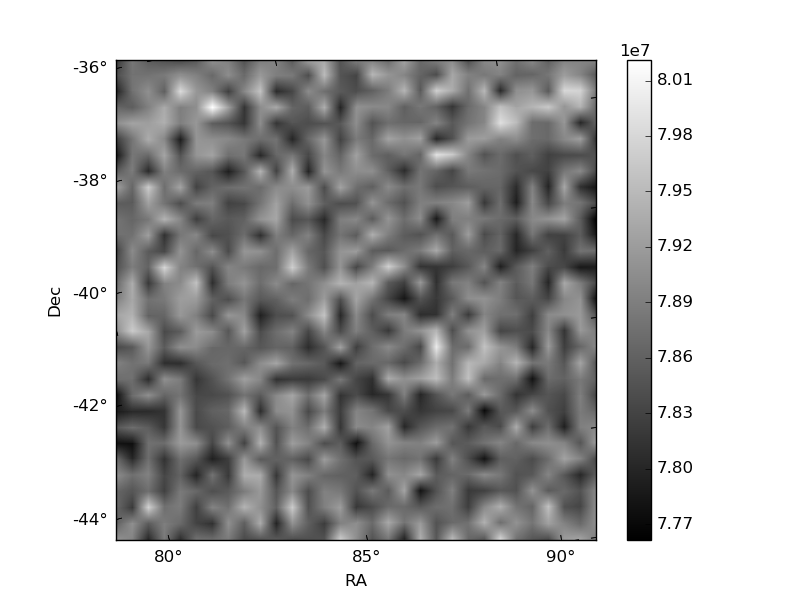
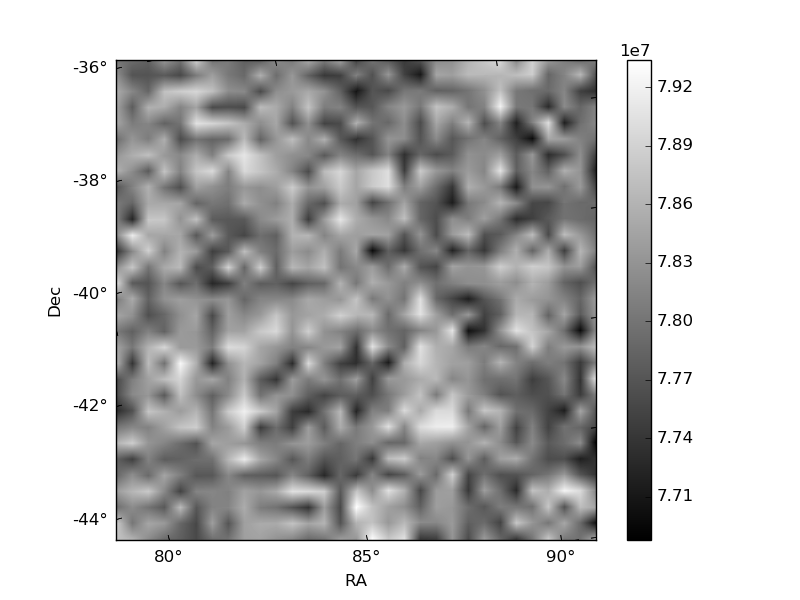
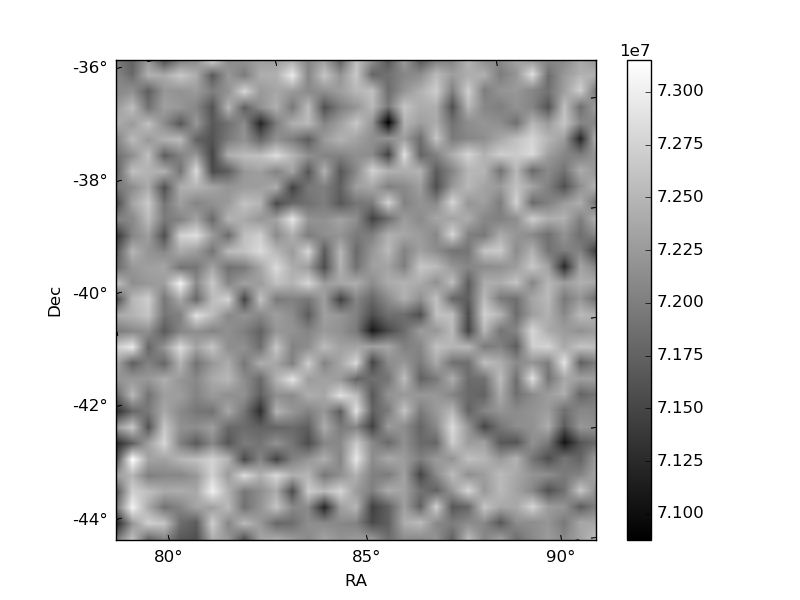
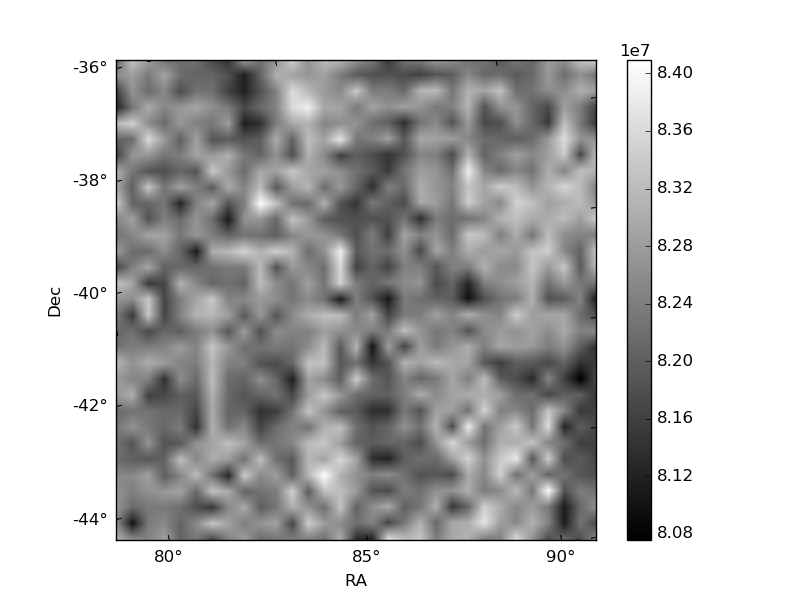
Histogram calculated using DETX and DETY for each event in the final _common_clean file
| Quadrant A | 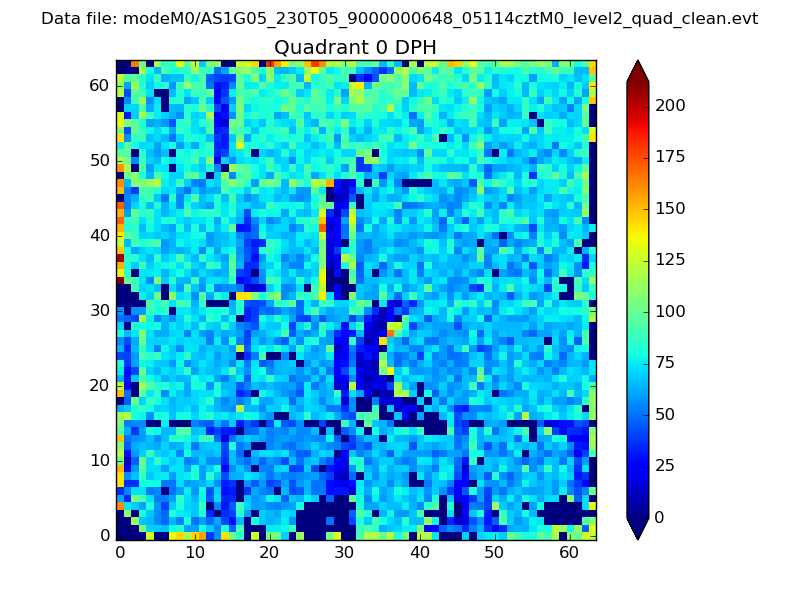 |
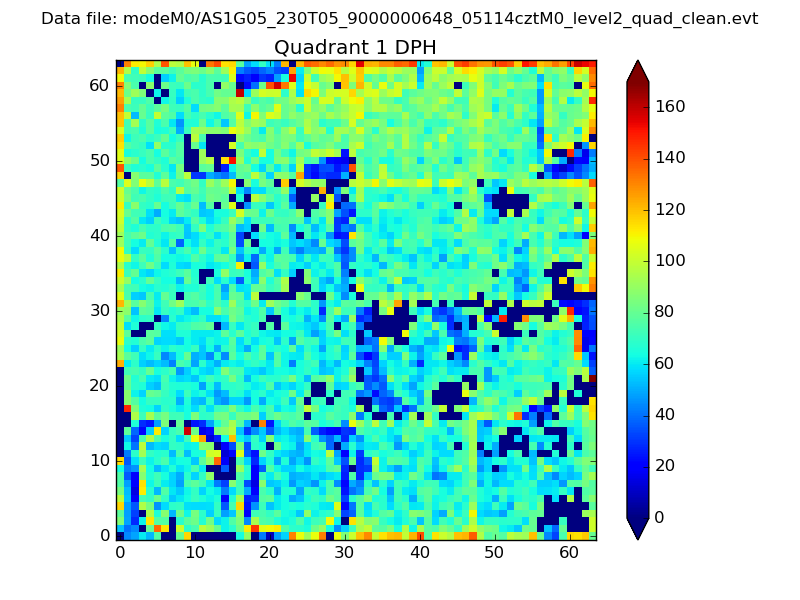 |
Quadrant B |
|---|---|---|---|
| Quadrant D | 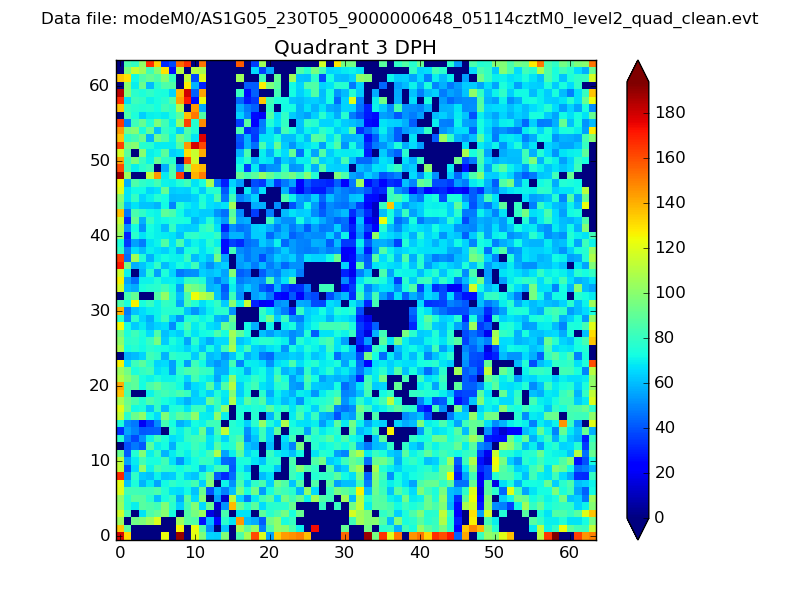 |
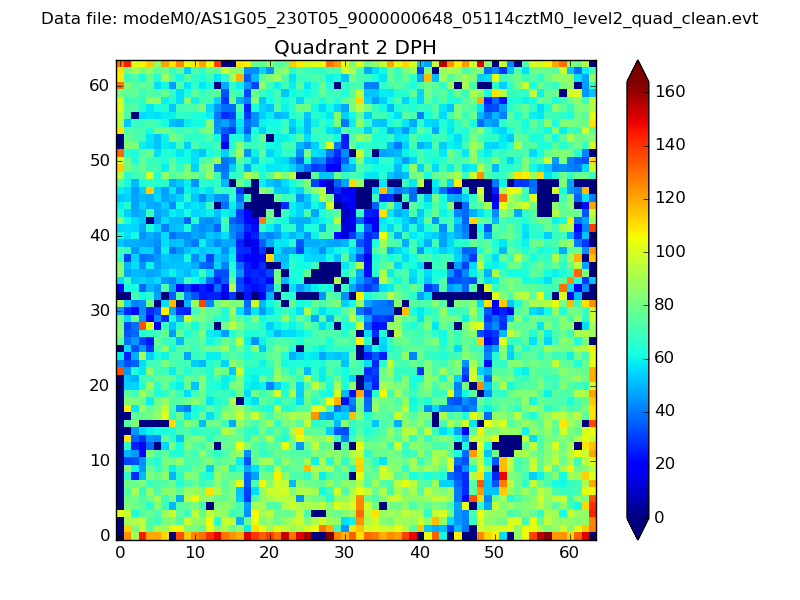 |
Quadrant C |
| Plot type | Count rate plots | Images |
|---|---|---|
| Comparison with Poisson distribution Blue bars denote a histogram of data divided into 1 sec bins. Red curve is a Poisson curve with rate = median count rate of data. |
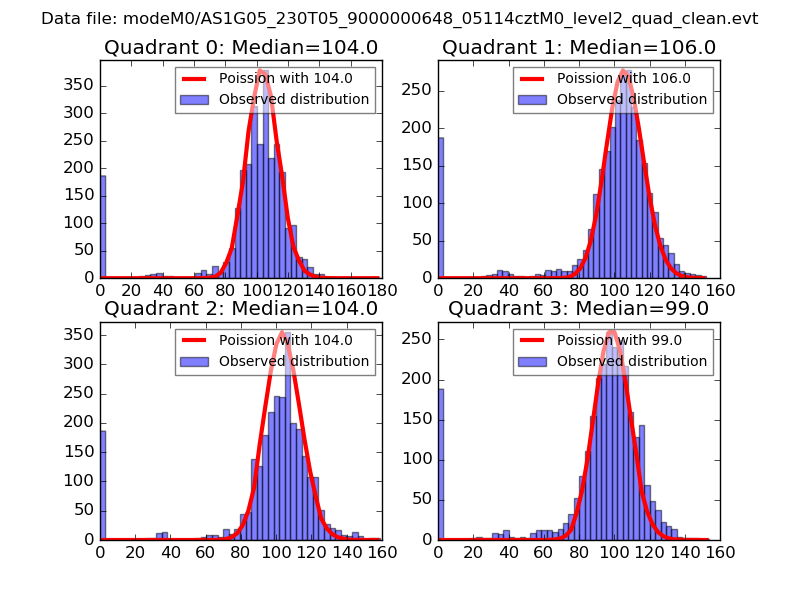 |
 |
| Quadrant-wise count rates Data is divided into 100 sec bins |
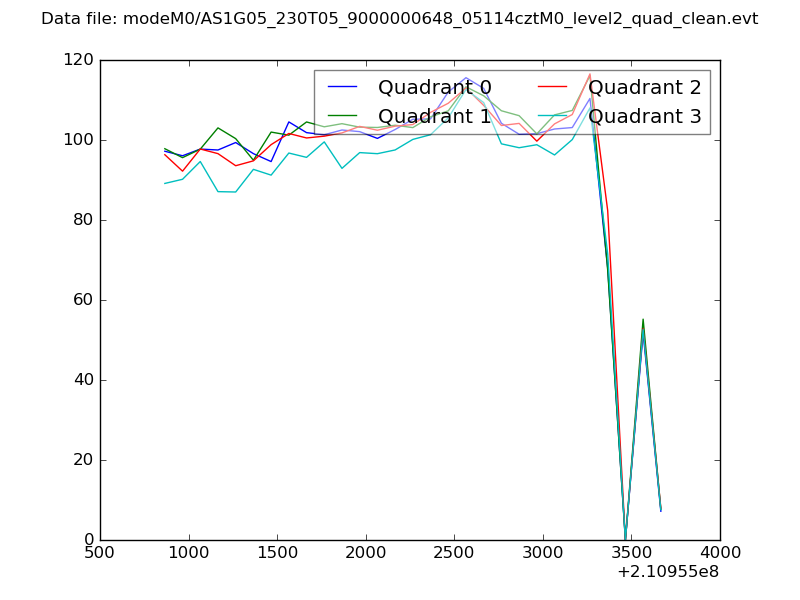 |
|
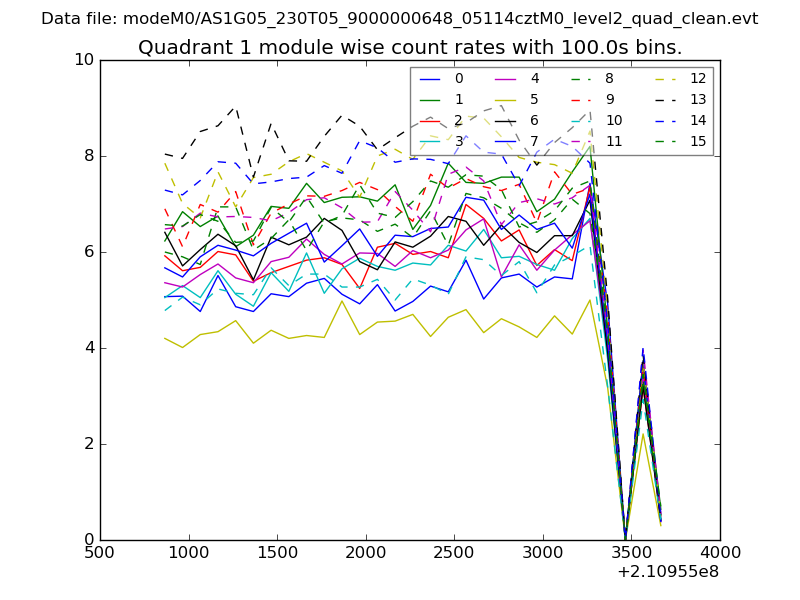
| Module-wise count rates for Quadrant A Data is divided into 100 sec bins |
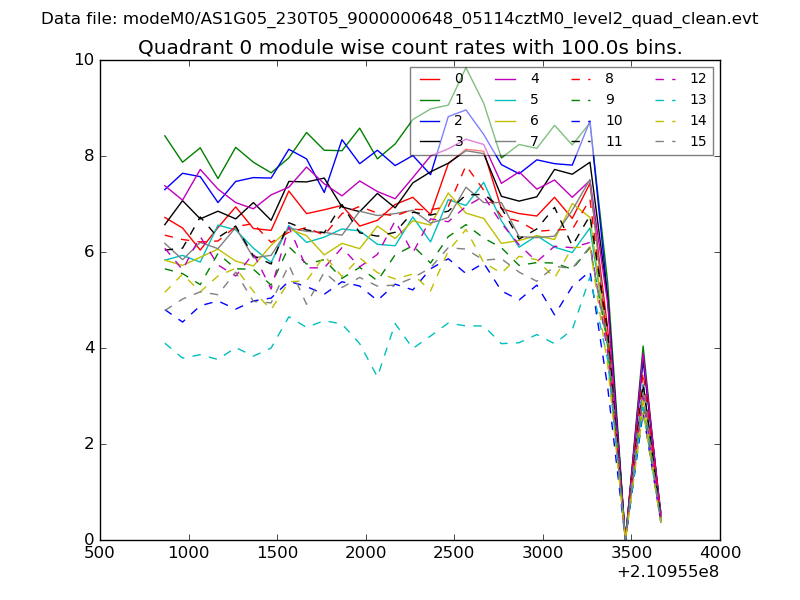 |
 |
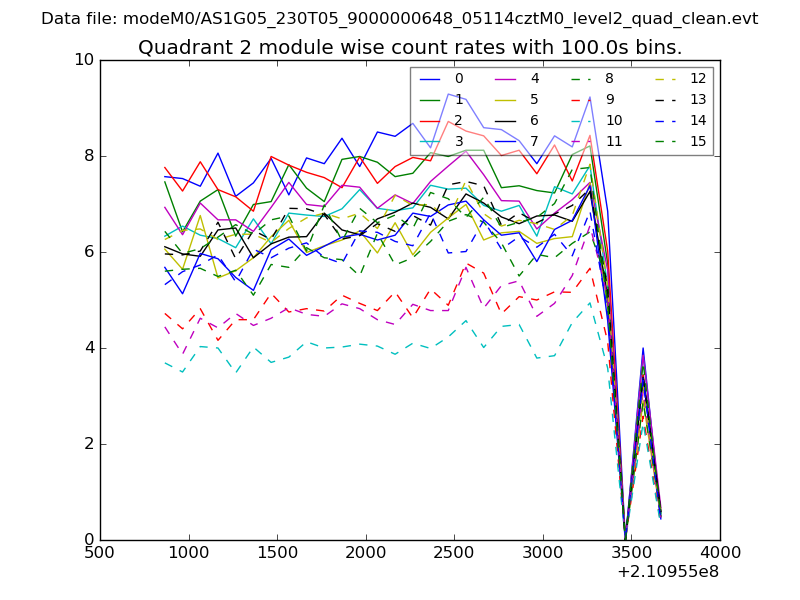
| Module-wise count rates for Quadrant B Data is divided into 100 sec bins |
 |
 |
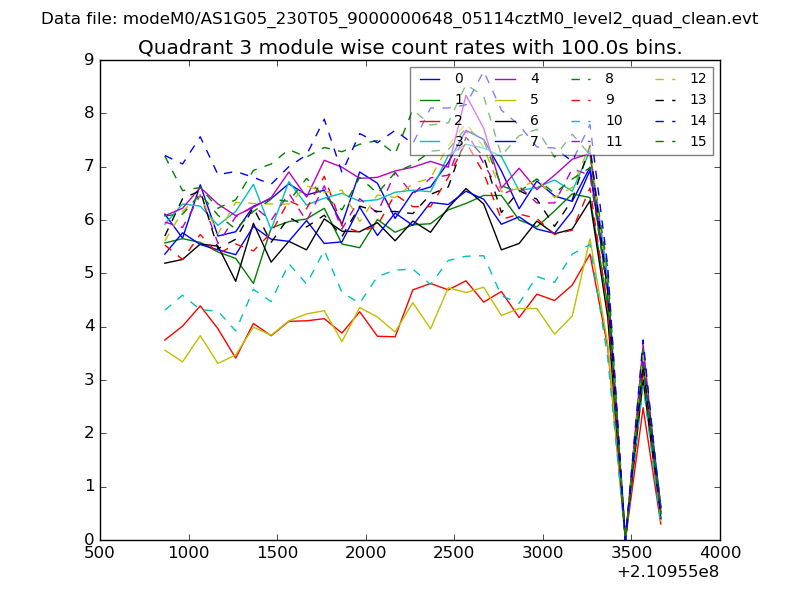
| Module-wise count rates for Quadrant C Data is divided into 100 sec bins |
 |
 |
| Module-wise count rates for Quadrant D Data is divided into 100 sec bins |
 |
 |
| Parameter | Plot |
|---|---|
| CZT HV Monitor | 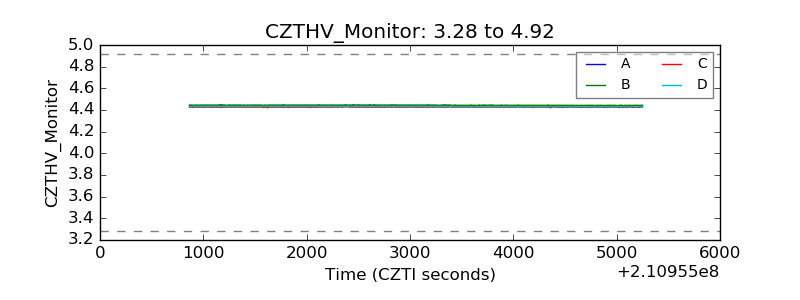 |
| D_VDD | 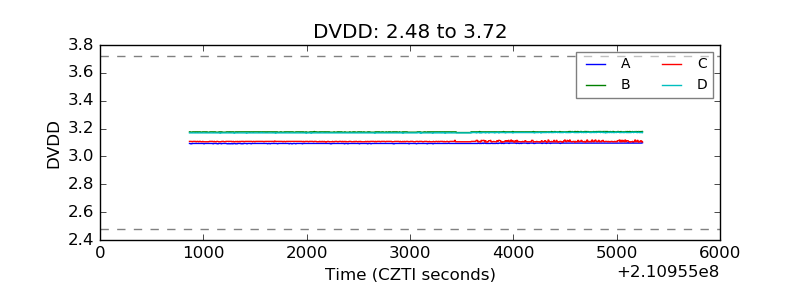 |
| Temperature 1 | 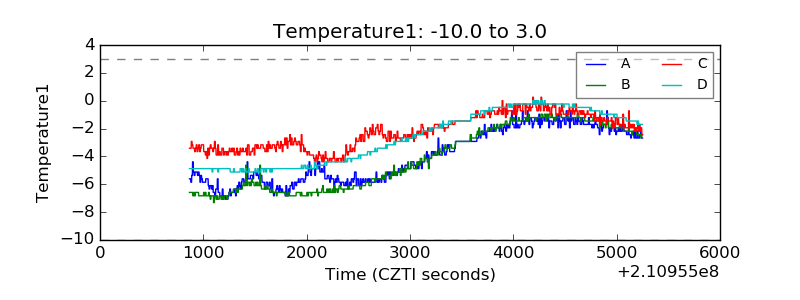 |
| Veto HV Monitor | 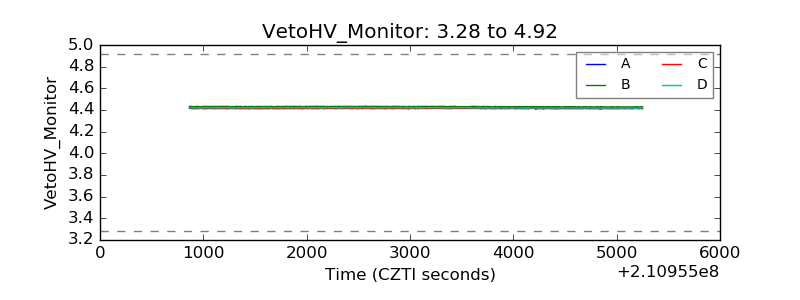 |
| Veto LLD | 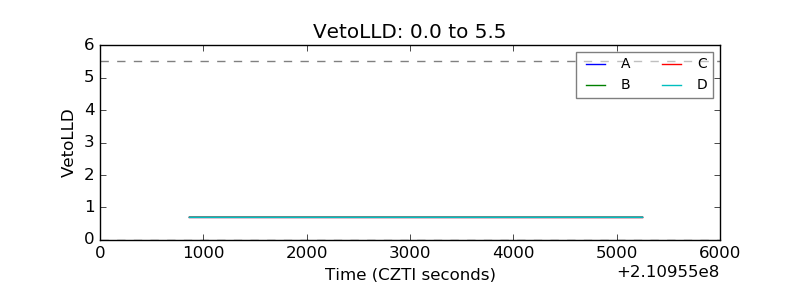 |
| Alpha Counter | 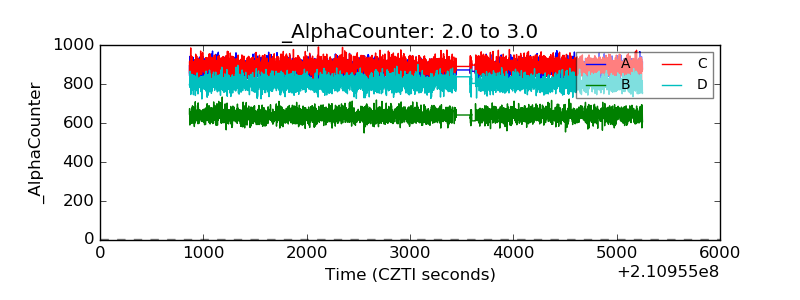 |
| _CPM_Rate | 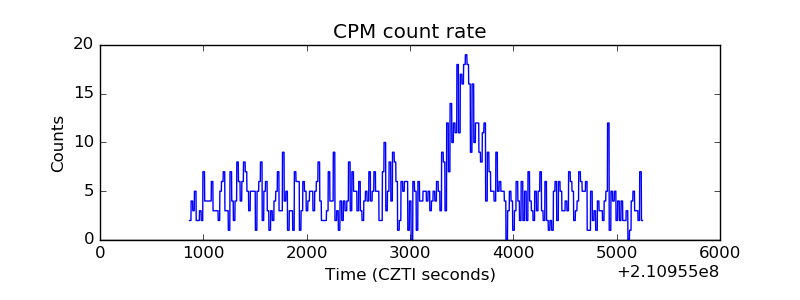 |
| CZT Counter | 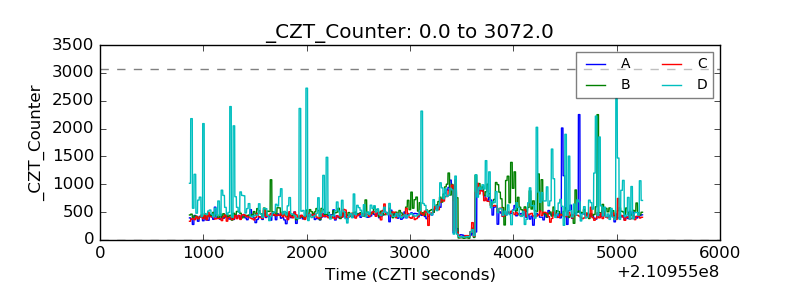 |
| +2.5 Volts monitor |  |
| +5 Volts monitor |  |
| _ROLL_ROT | 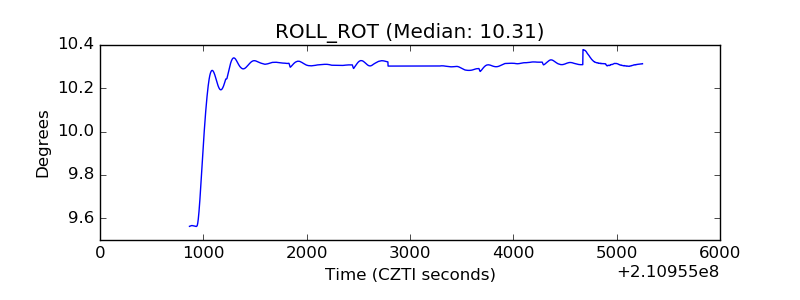 |
| _Roll_DEC | 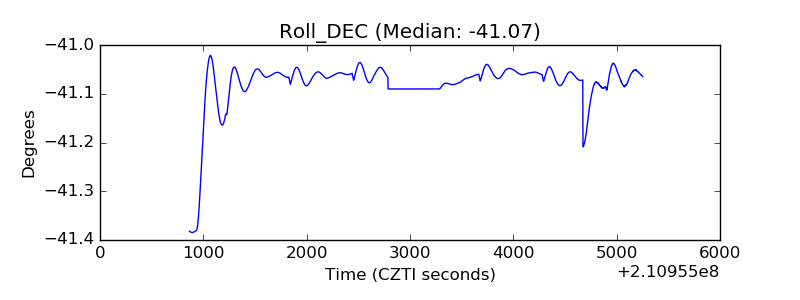 |
| _Roll_RA | 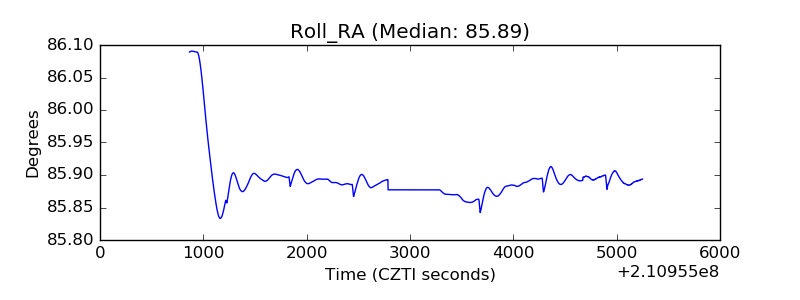 |
| Veto Counter | 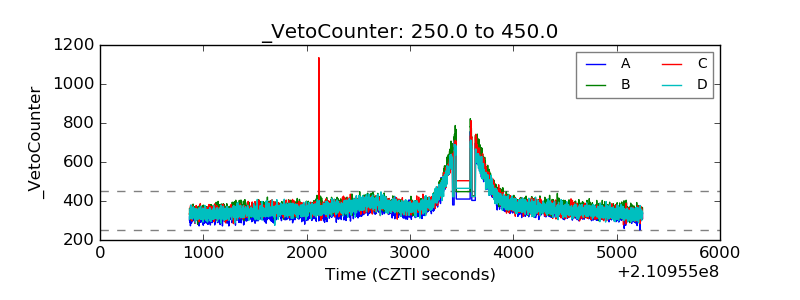 |