| Param | Original file | Final file |
|---|---|---|
| Filename | modeM0/AS1G05_230T05_9000000648_05117cztM0_level2.evt | modeM0/AS1G05_230T05_9000000648_05117cztM0_level2_quad_clean.evt |
| Size (bytes) | 679,504,320 | 95,284,800 |
| Size | 648.0 MB | 90.9 MB |
| Events in quadrant A | 3,508,008 | 606,543 |
| Events in quadrant B | 5,080,838 | 607,344 |
| Events in quadrant C | 3,586,588 | 606,782 |
| Events in quadrant D | 7,867,051 | 514,116 |
| Mode SS | |||
|---|---|---|---|
| Quadrant | BADHDUFLAG | Total packets | Discarded packets |
| A | 0 | 166 | 0 |
| B | 0 | 166 | 6 |
| C | 0 | 166 | 2 |
| D | 0 | 166 | 2 |
| Mode M0 | |||
|---|---|---|---|
| Quadrant | BADHDUFLAG | Total packets | Discarded packets |
| A | 0 | 16553 | 369 |
| B | 0 | 21533 | 1090 |
| C | 0 | 16485 | 368 |
| D | 0 | 30433 | 1704 |
| Mode M9 | |||
|---|---|---|---|
| Quadrant | BADHDUFLAG | Total packets | Discarded packets |
| A | 0 | 4 | 0 |
| B | 0 | 4 | 0 |
| C | 0 | 4 | 0 |
| D | 0 | 4 | 0 |
| Quadrant | Total seconds | Saturated seconds | Saturation percentage |
|---|---|---|---|
| A | 7951 | 36 | 0.452773% |
| B | 7862 | 410 | 5.214958% |
| C | 7951 | 11 | 0.138347% |
| D | 7823 | 1308 | 16.719928% |
Noise dominated data is calculated using 1-second bins in cleaned event files. If a bin has >2000 counts, and if more than 50% of those come from <1% of pixels, then it is considered to be noise-dominated and hence unusable.
| Quadrant | # 1 sec bins | Bins with >0 counts | Bins with >2000 counts | High rate bins dominated by noise | Noise dominated (total time) | Noise dominated (detector-on time) | Marked lightcurve |
|---|---|---|---|---|---|---|---|
| A | 8553 | 8124 | 3 | 3 | 0.04% | 0.04% | 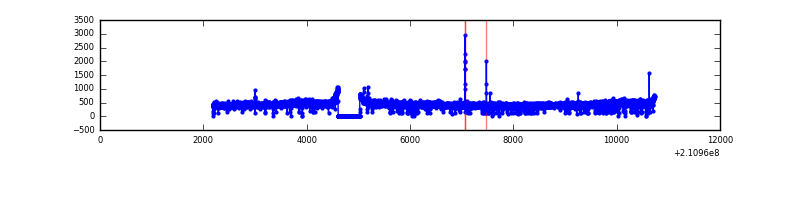 |
| B | 8553 | 8107 | 236 | 236 | 2.76% | 2.91% | 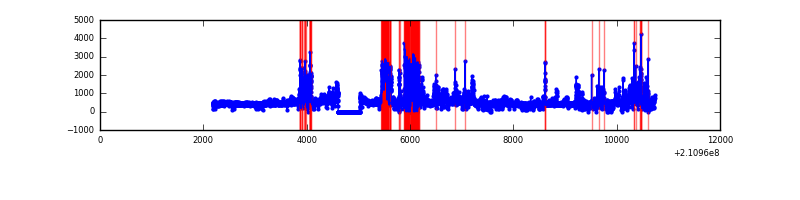 |
| C | 8553 | 8127 | 0 | 0 | 0.00% | 0.00% | 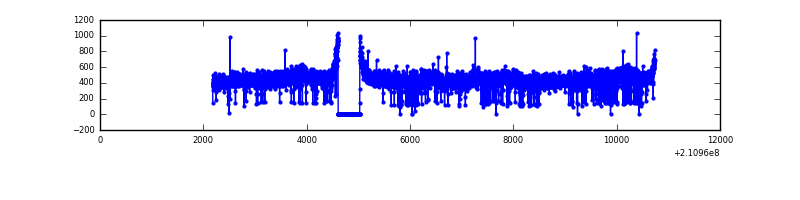 |
| D | 8553 | 8084 | 1098 | 1098 | 12.84% | 13.58% | 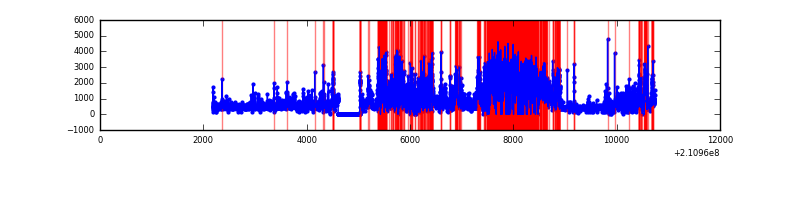 |
Top three noisy pixels from each quadrant. If the there are fewer than three noisy pixels in the level2.evt file, extra rows are filled as -1
| Pixel properties | Quadrant properties | ||||||
|---|---|---|---|---|---|---|---|
| Quadrant | DetID | PixID | Counts | Sigma | Mean | Median | Sigma |
| A | 0 | 50 | 22171 | 114.34 | 902 | 881 | 186.2 |
| A | 13 | 14 | 11462 | 56.82 | 902 | 881 | 186.2 |
| A | 12 | 194 | 9042 | 43.83 | 902 | 881 | 186.2 |
| B | 8 | 3 | 1082188 | 6308.08 | 890 | 868 | 171.4 |
| B | 10 | 16 | 196062 | 1138.7 | 890 | 868 | 171.4 |
| B | 4 | 48 | 175915 | 1021.17 | 890 | 868 | 171.4 |
| C | 10 | 34 | 103052 | 494.56 | 886 | 891 | 206.6 |
| C | 12 | 4 | 8238 | 35.57 | 886 | 891 | 206.6 |
| C | 13 | 61 | 7123 | 30.17 | 886 | 891 | 206.6 |
| D | 13 | 235 | 3078452 | 15553.39 | 803 | 777 | 197.9 |
| D | 2 | 33 | 643703 | 3249.1 | 803 | 777 | 197.9 |
| D | 1 | 239 | 314342 | 1584.64 | 803 | 777 | 197.9 |
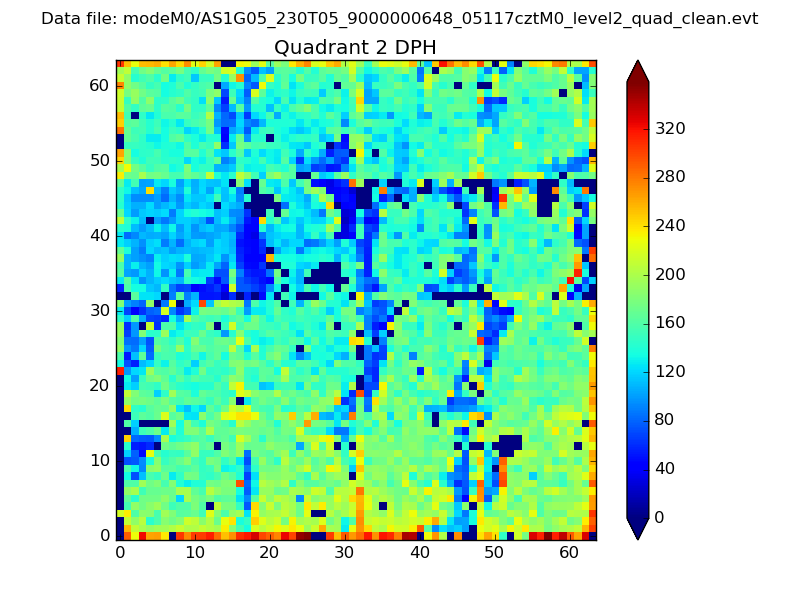
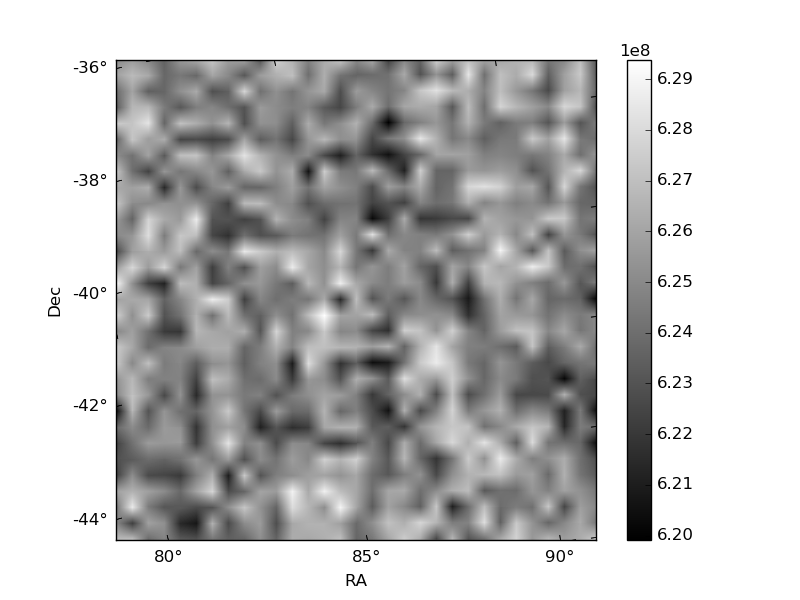
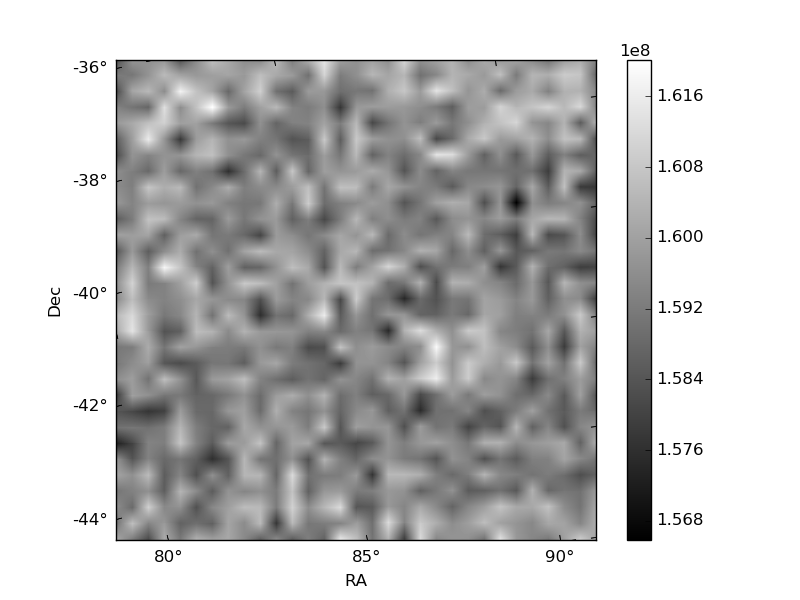
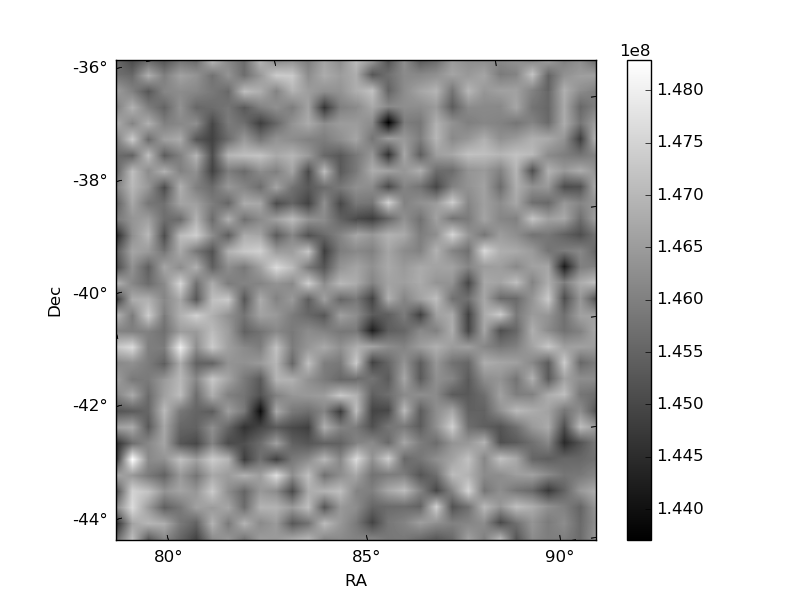
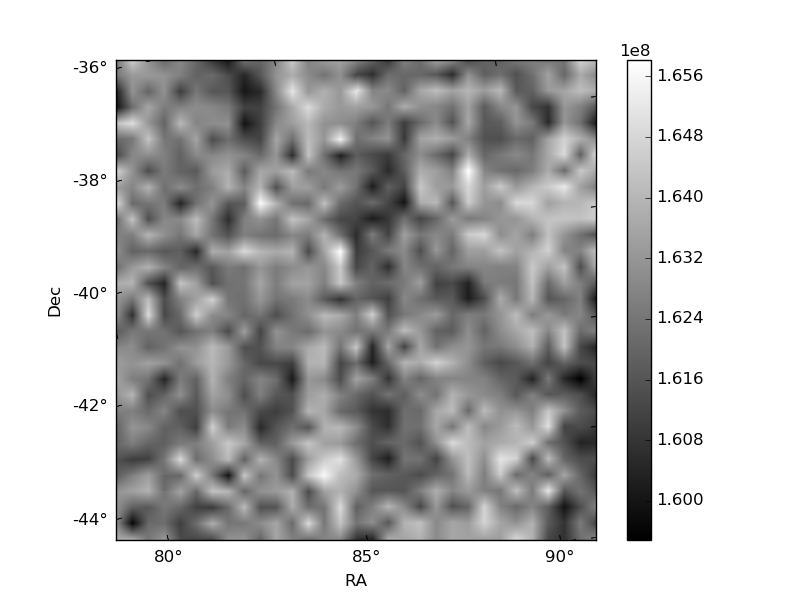
Histogram calculated using DETX and DETY for each event in the final _common_clean file
| Quadrant A | 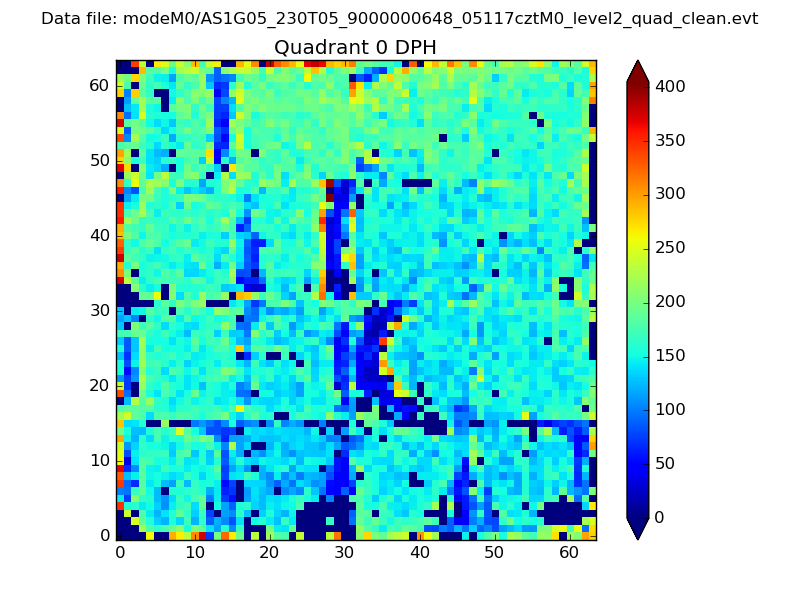 |
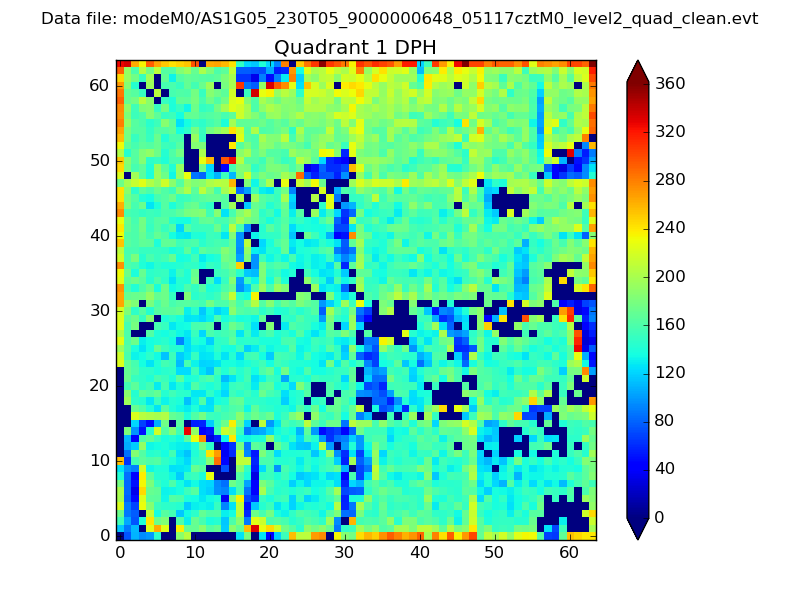 |
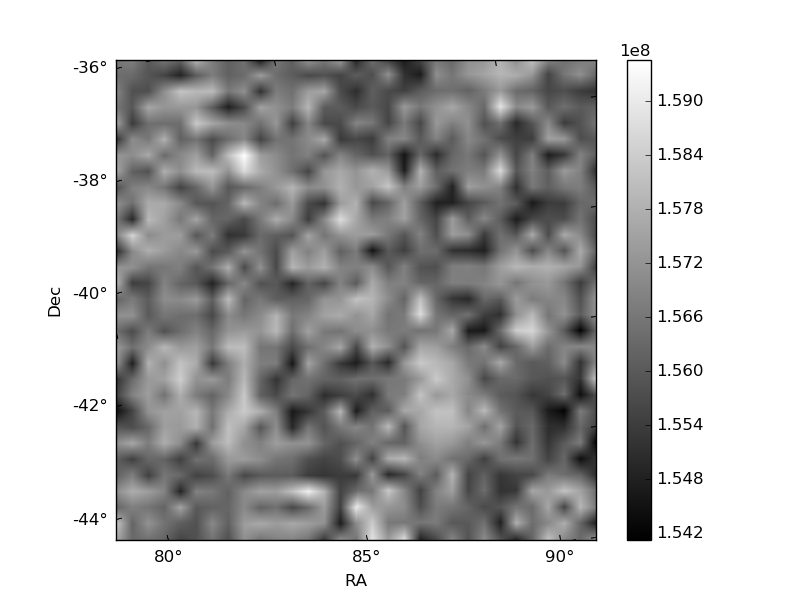
Quadrant B |
|---|---|---|---|
| Quadrant D | 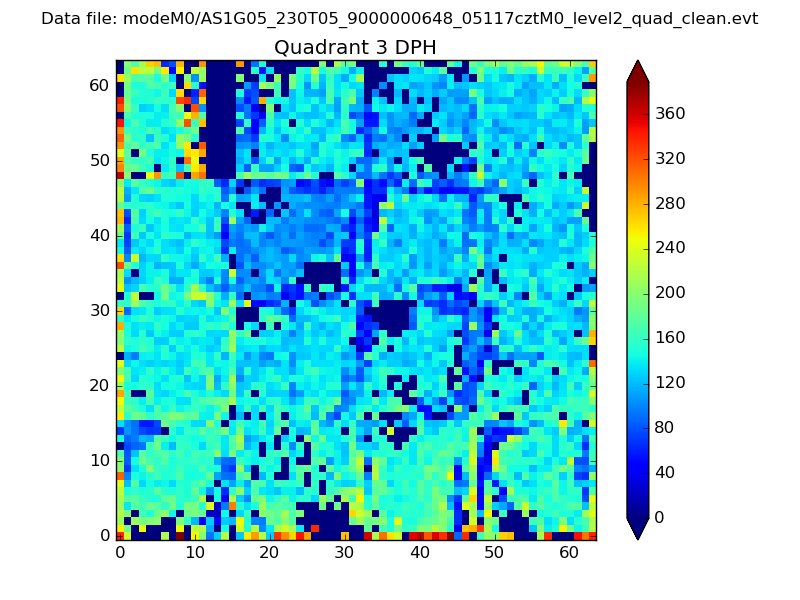 |
 |
Quadrant C |
| Plot type | Count rate plots | Images |
|---|---|---|
| Comparison with Poisson distribution Blue bars denote a histogram of data divided into 1 sec bins. Red curve is a Poisson curve with rate = median count rate of data. |
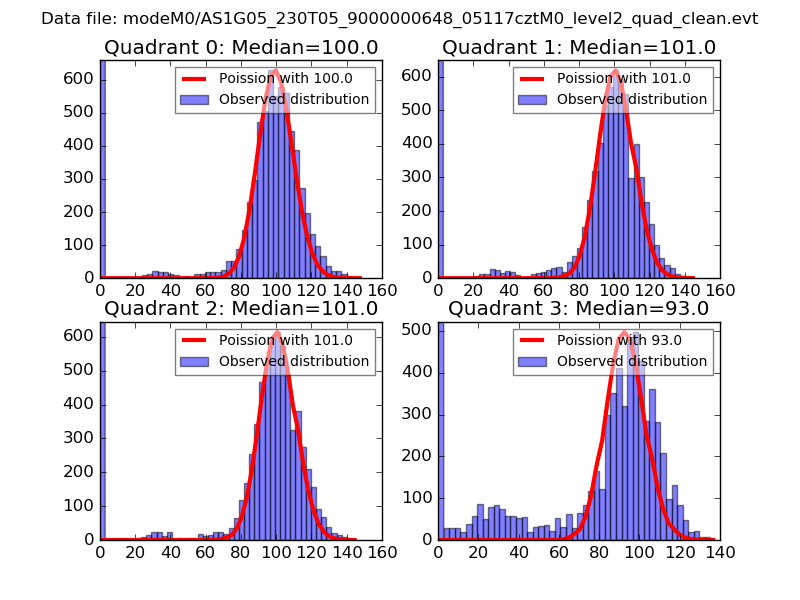 |
 |
| Quadrant-wise count rates Data is divided into 100 sec bins |
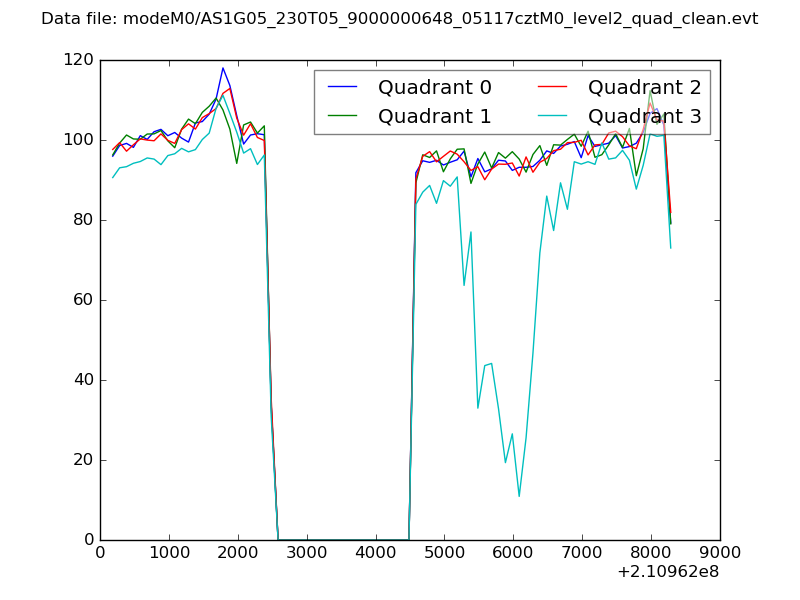 |
|
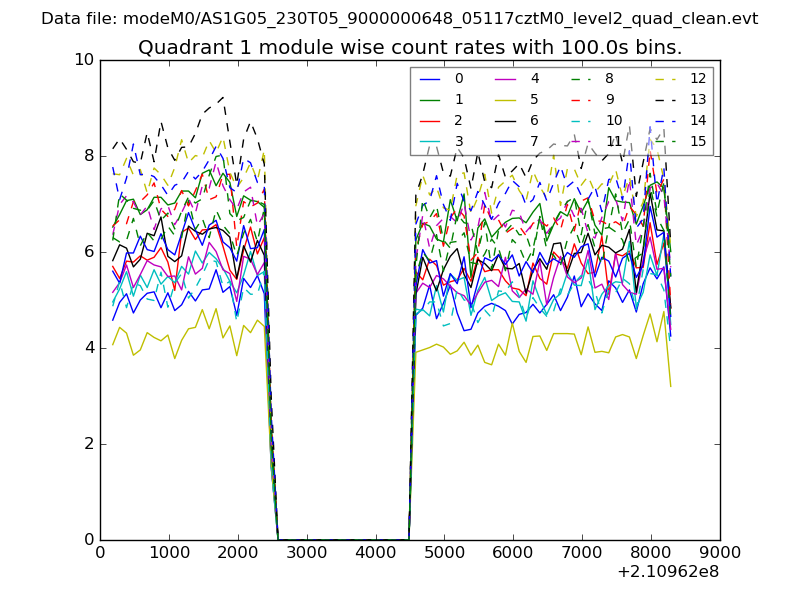
| Module-wise count rates for Quadrant A Data is divided into 100 sec bins |
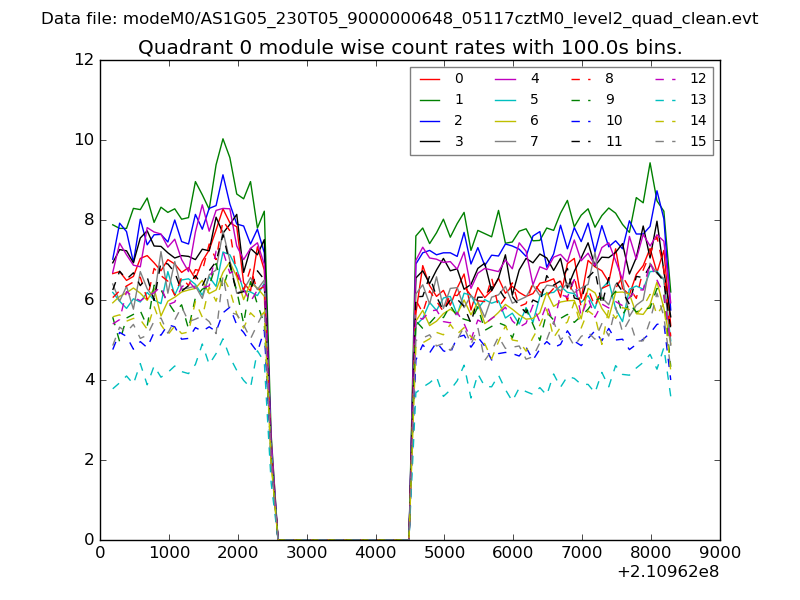 |
 |
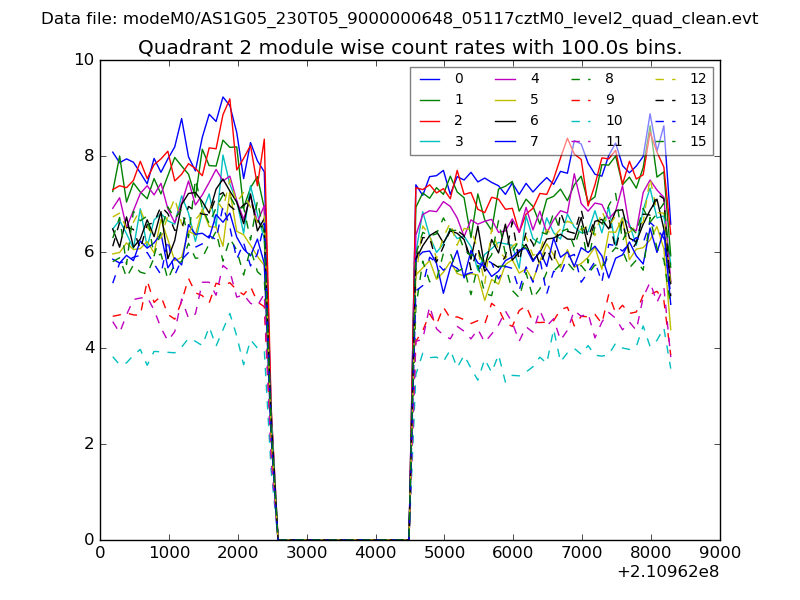
| Module-wise count rates for Quadrant B Data is divided into 100 sec bins |
 |
 |
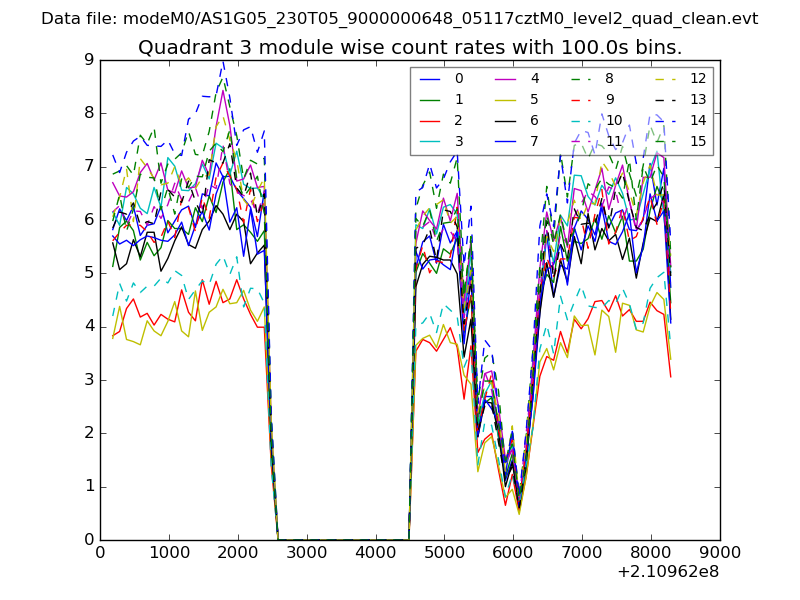
| Module-wise count rates for Quadrant C Data is divided into 100 sec bins |
 |
 |
| Module-wise count rates for Quadrant D Data is divided into 100 sec bins |
 |
 |
| Parameter | Plot |
|---|---|
| CZT HV Monitor | 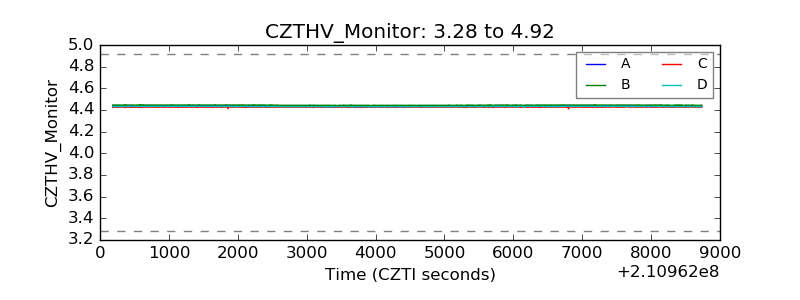 |
| D_VDD | 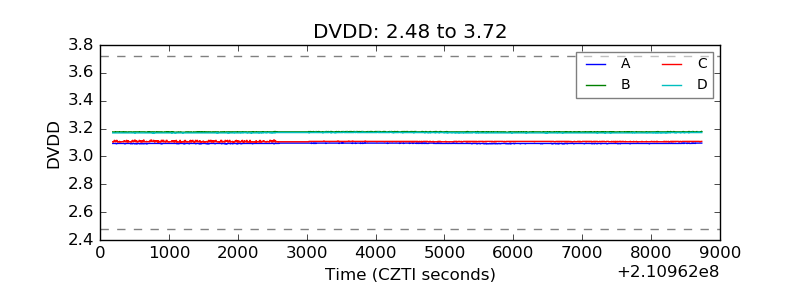 |
| Temperature 1 | 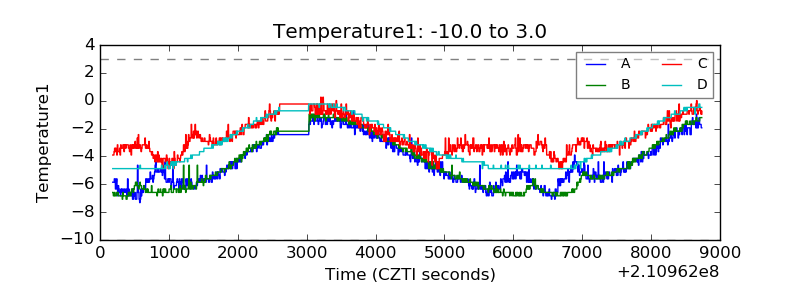 |
| Veto HV Monitor | 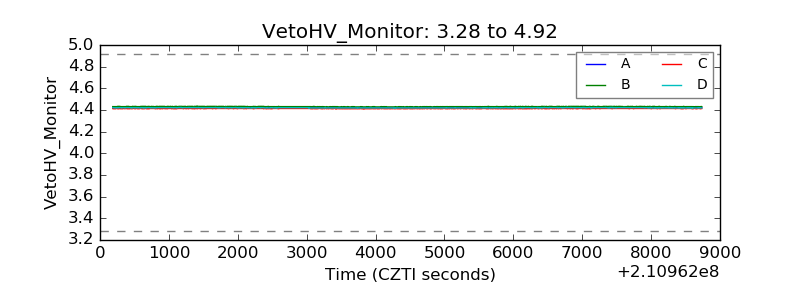 |
| Veto LLD | 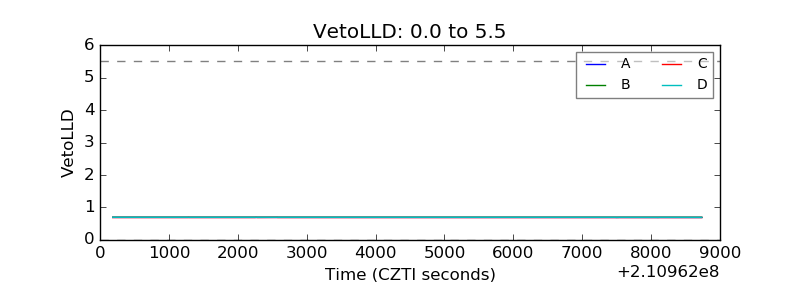 |
| Alpha Counter | 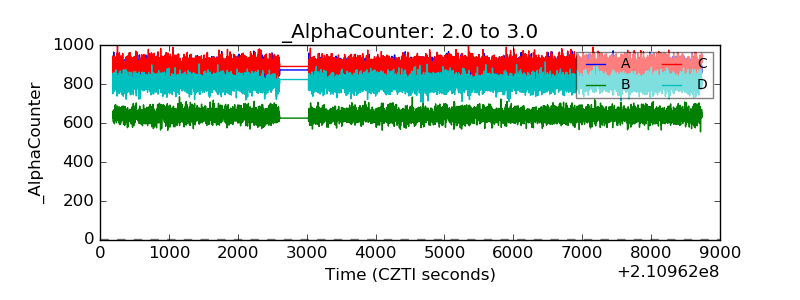 |
| _CPM_Rate | 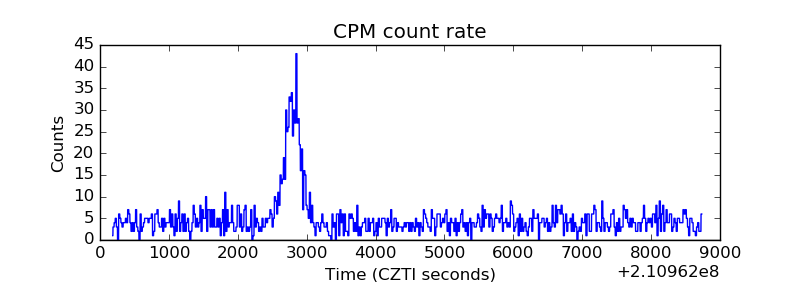 |
| CZT Counter | 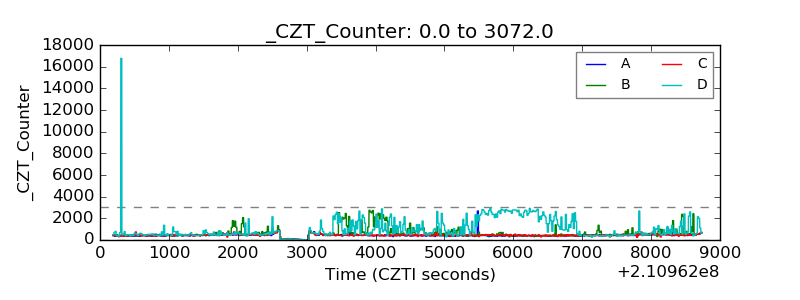 |
| +2.5 Volts monitor |  |
| +5 Volts monitor | 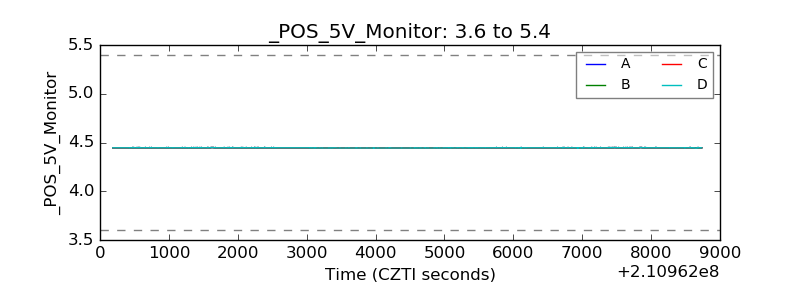 |
| _ROLL_ROT | 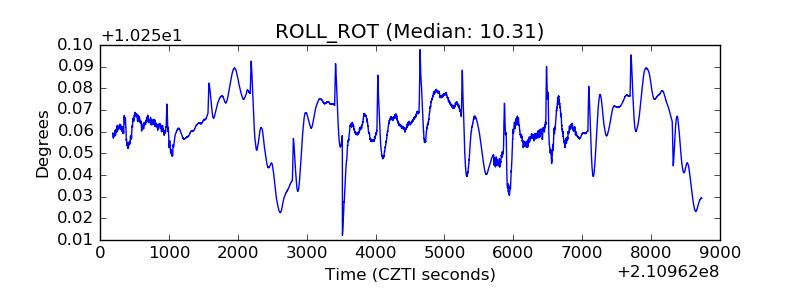 |
| _Roll_DEC | 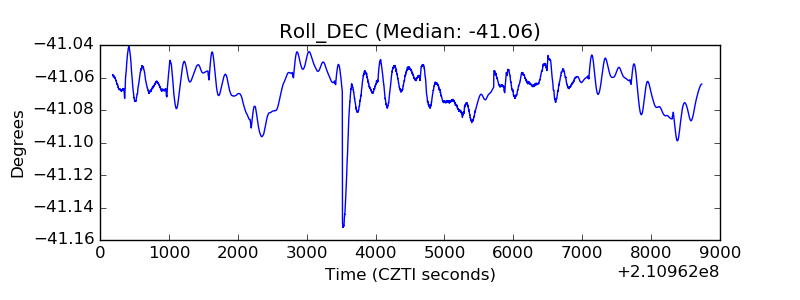 |
| _Roll_RA |  |
| Veto Counter | 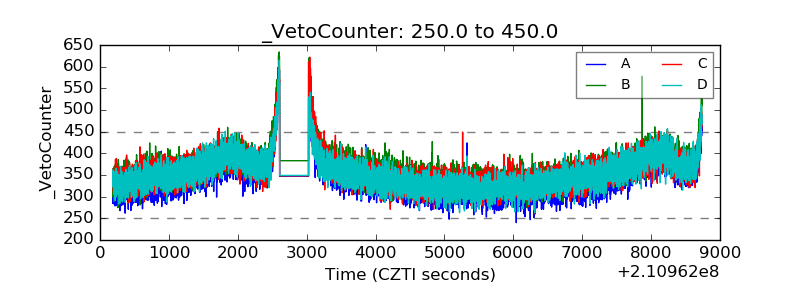 |