| Param | Original file | Final file |
|---|---|---|
| Filename | modeM0/AS1G05_230T05_9000000648_05118cztM0_level2.evt | modeM0/AS1G05_230T05_9000000648_05118cztM0_level2_quad_clean.evt |
| Size (bytes) | 1,027,198,080 | 149,109,120 |
| Size | 979.6 MB | 142.2 MB |
| Events in quadrant A | 6,037,799 | 914,204 |
| Events in quadrant B | 7,737,343 | 932,626 |
| Events in quadrant C | 5,873,399 | 924,210 |
| Events in quadrant D | 10,559,623 | 824,674 |
| Mode SS | |||
|---|---|---|---|
| Quadrant | BADHDUFLAG | Total packets | Discarded packets |
| A | 0 | 272 | 0 |
| B | 0 | 272 | 0 |
| C | 0 | 272 | 0 |
| D | 0 | 272 | 0 |
| Mode M0 | |||
|---|---|---|---|
| Quadrant | BADHDUFLAG | Total packets | Discarded packets |
| A | 0 | 27376 | 23 |
| B | 0 | 32093 | 25 |
| C | 0 | 26986 | 23 |
| D | 0 | 40688 | 25 |
| Mode M9 | |||
|---|---|---|---|
| Quadrant | BADHDUFLAG | Total packets | Discarded packets |
| A | 0 | 22 | 0 |
| B | 0 | 22 | 0 |
| C | 0 | 22 | 0 |
| D | 0 | 22 | 0 |
| Quadrant | Total seconds | Saturated seconds | Saturation percentage |
|---|---|---|---|
| A | 13313 | 123 | 0.923909% |
| B | 13311 | 544 | 4.086845% |
| C | 13312 | 57 | 0.428185% |
| D | 13315 | 1473 | 11.062711% |
Noise dominated data is calculated using 1-second bins in cleaned event files. If a bin has >2000 counts, and if more than 50% of those come from <1% of pixels, then it is considered to be noise-dominated and hence unusable.
| Quadrant | # 1 sec bins | Bins with >0 counts | Bins with >2000 counts | High rate bins dominated by noise | Noise dominated (total time) | Noise dominated (detector-on time) | Marked lightcurve |
|---|---|---|---|---|---|---|---|
| A | 15442 | 13325 | 21 | 21 | 0.14% | 0.16% |  |
| B | 15442 | 13325 | 293 | 293 | 1.90% | 2.20% | 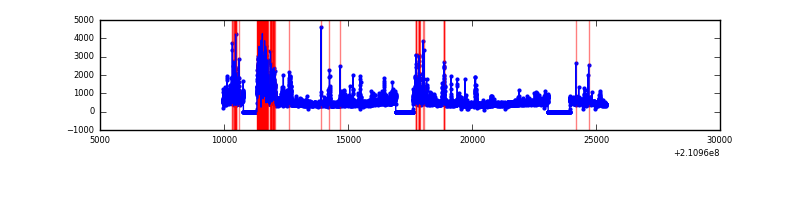 |
| C | 15442 | 13325 | 0 | 0 | 0.00% | 0.00% |  |
| D | 15442 | 13324 | 1097 | 1097 | 7.10% | 8.23% | 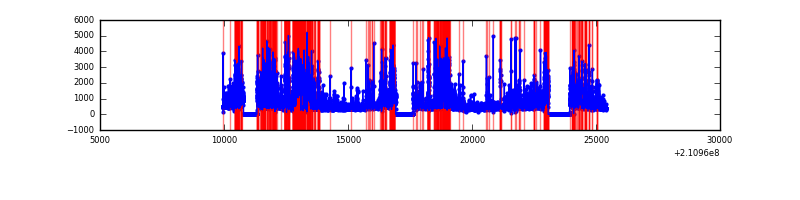 |
Top three noisy pixels from each quadrant. If the there are fewer than three noisy pixels in the level2.evt file, extra rows are filled as -1
| Pixel properties | Quadrant properties | ||||||
|---|---|---|---|---|---|---|---|
| Quadrant | DetID | PixID | Counts | Sigma | Mean | Median | Sigma |
| A | 0 | 50 | 133216 | 424.86 | 1520 | 1486 | 310.1 |
| A | 13 | 14 | 35317 | 109.11 | 1520 | 1486 | 310.1 |
| A | 0 | 226 | 15747 | 45.99 | 1520 | 1486 | 310.1 |
| B | 8 | 3 | 1080540 | 3689.02 | 1524 | 1486 | 292.5 |
| B | 10 | 16 | 296425 | 1008.33 | 1524 | 1486 | 292.5 |
| B | 0 | 219 | 162448 | 550.29 | 1524 | 1486 | 292.5 |
| C | 12 | 4 | 21517 | 57.65 | 1489 | 1495 | 347.3 |
| C | 8 | 128 | 15817 | 41.24 | 1489 | 1495 | 347.3 |
| C | 13 | 61 | 12024 | 30.32 | 1489 | 1495 | 347.3 |
| D | 13 | 235 | 2558009 | 7371.16 | 1409 | 1365 | 346.8 |
| D | 2 | 33 | 1053947 | 3034.74 | 1409 | 1365 | 346.8 |
| D | 12 | 22 | 585324 | 1683.63 | 1409 | 1365 | 346.8 |
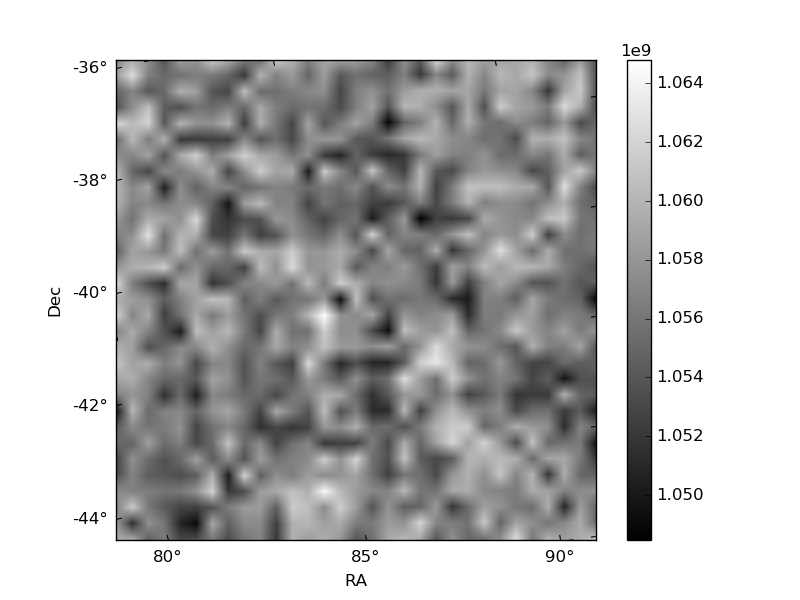
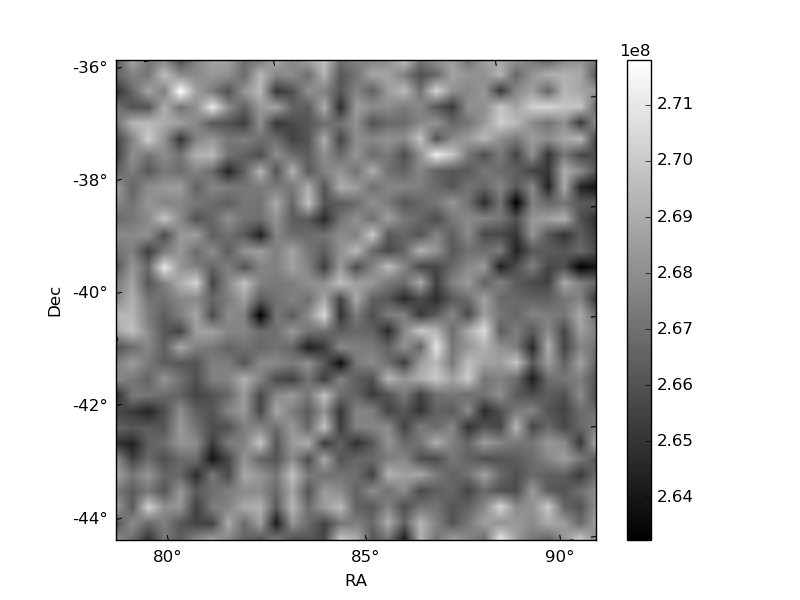
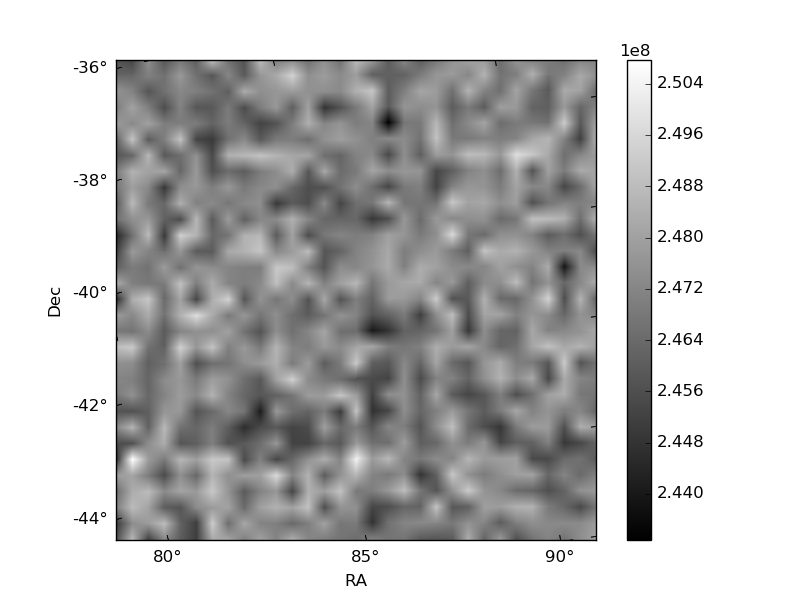
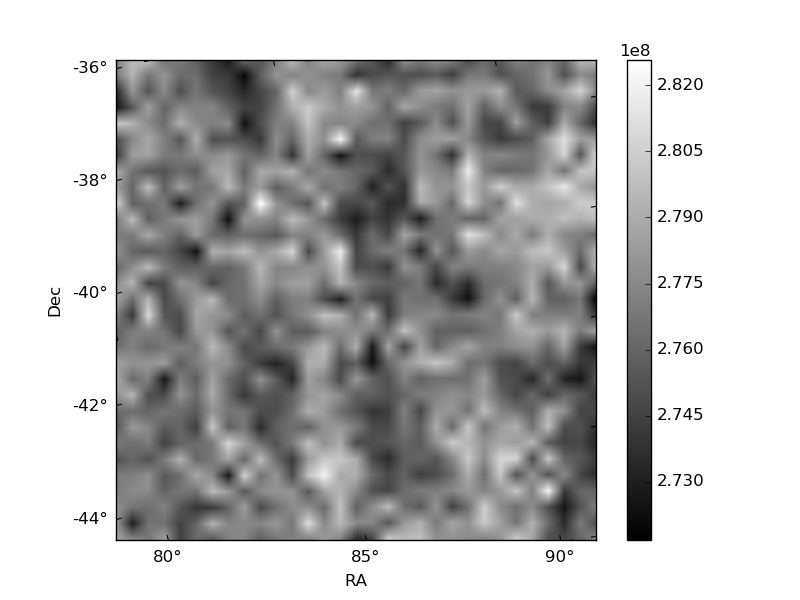
Histogram calculated using DETX and DETY for each event in the final _common_clean file
| Quadrant A | 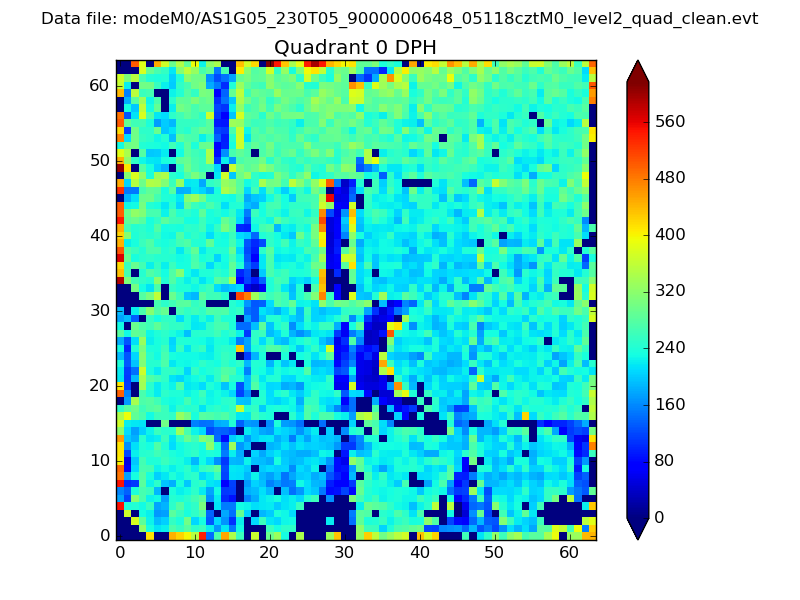 |
 |
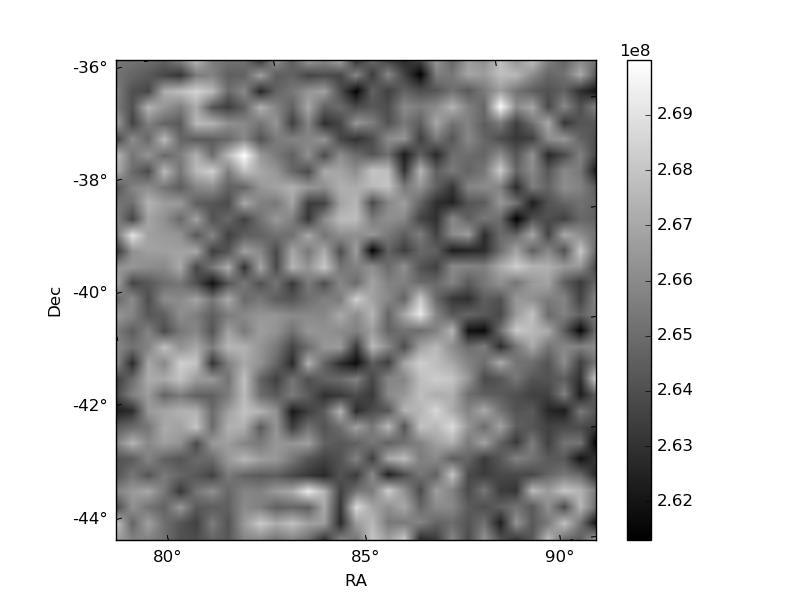
Quadrant B |
|---|---|---|---|
| Quadrant D | 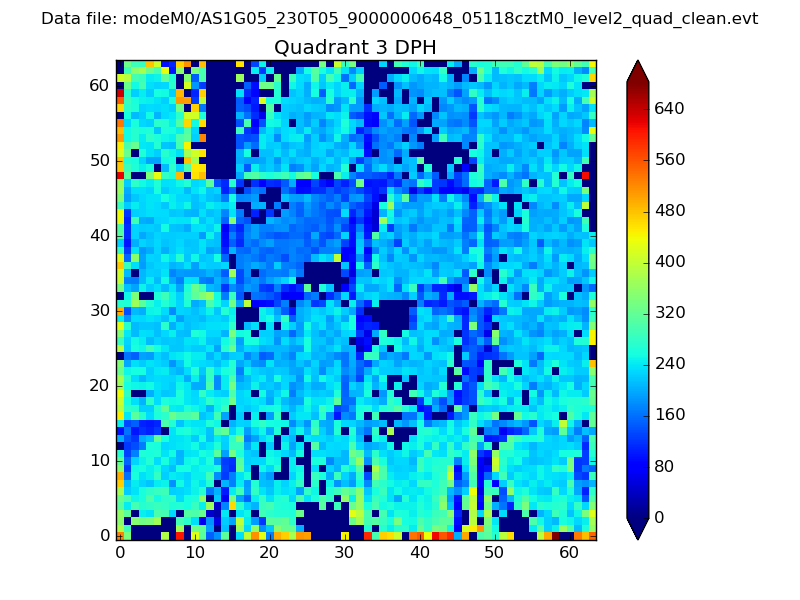 |
 |
Quadrant C |
| Plot type | Count rate plots | Images |
|---|---|---|
| Comparison with Poisson distribution Blue bars denote a histogram of data divided into 1 sec bins. Red curve is a Poisson curve with rate = median count rate of data. |
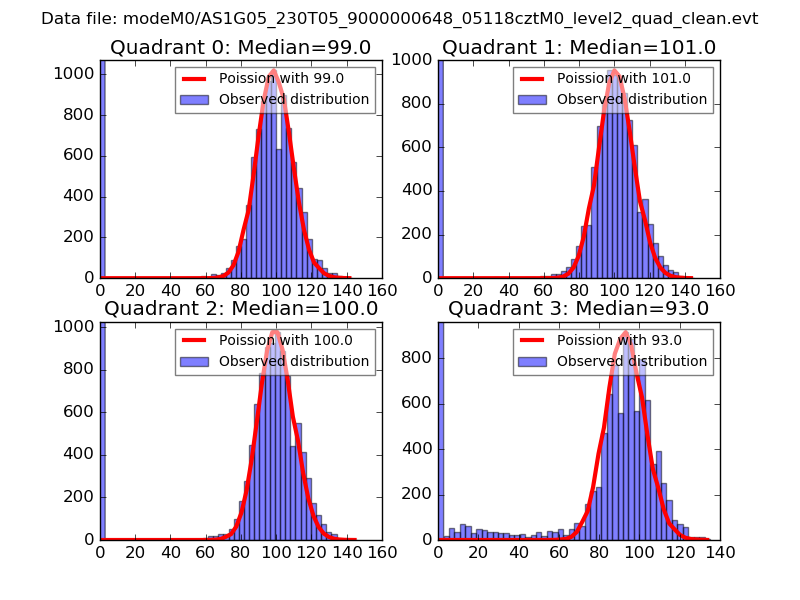 |
 |
| Quadrant-wise count rates Data is divided into 100 sec bins |
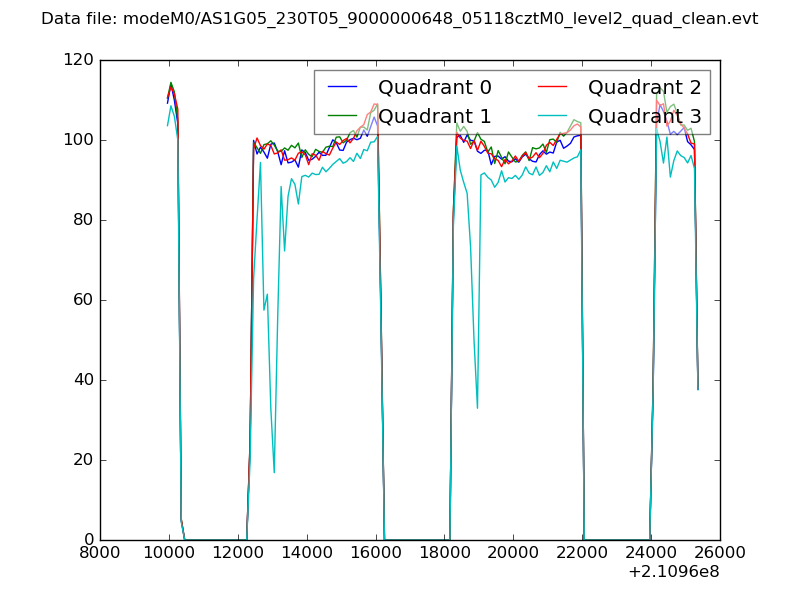 |
|
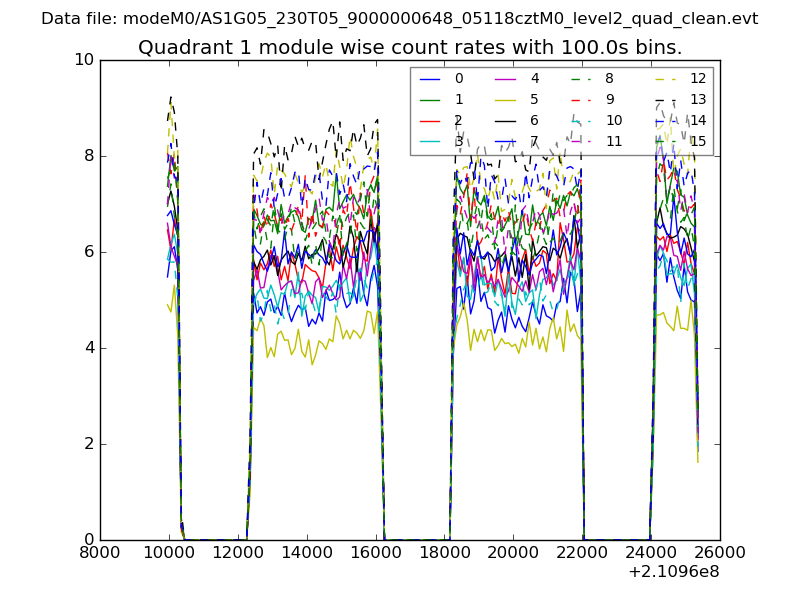
| Module-wise count rates for Quadrant A Data is divided into 100 sec bins |
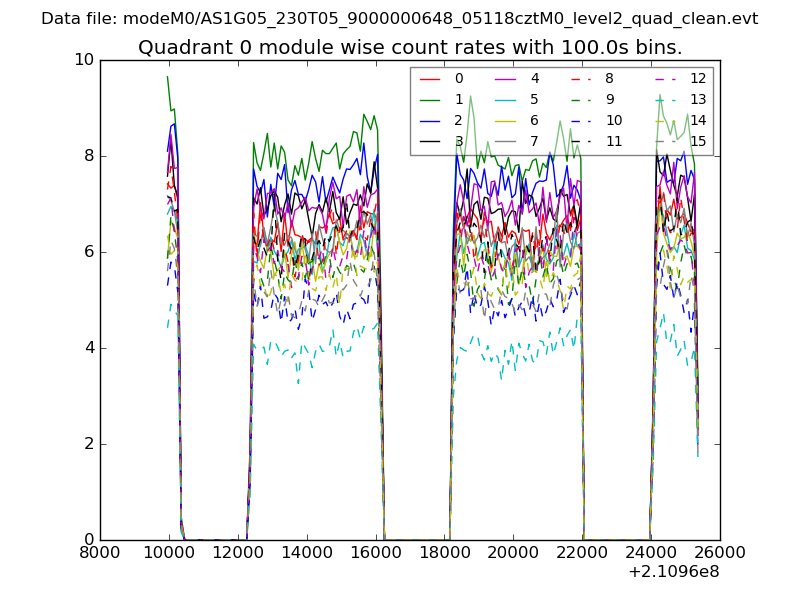 |
 |
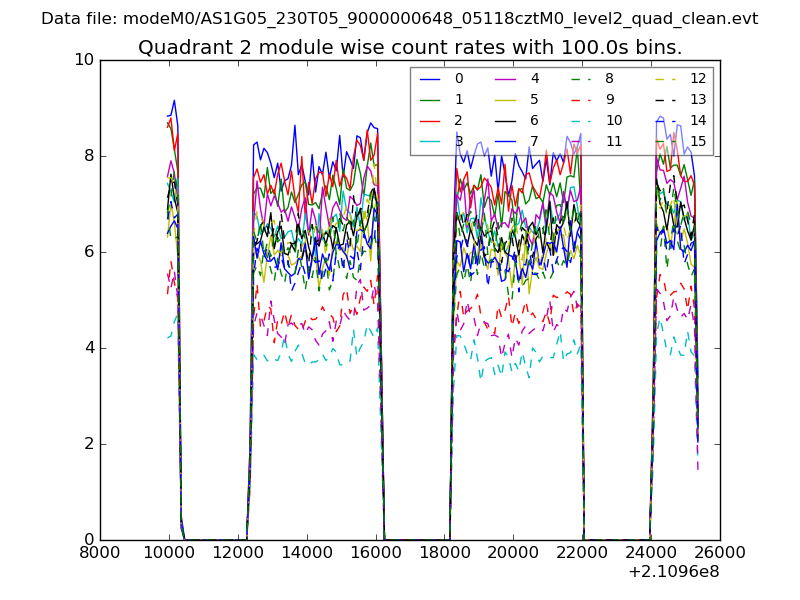
| Module-wise count rates for Quadrant B Data is divided into 100 sec bins |
 |
 |
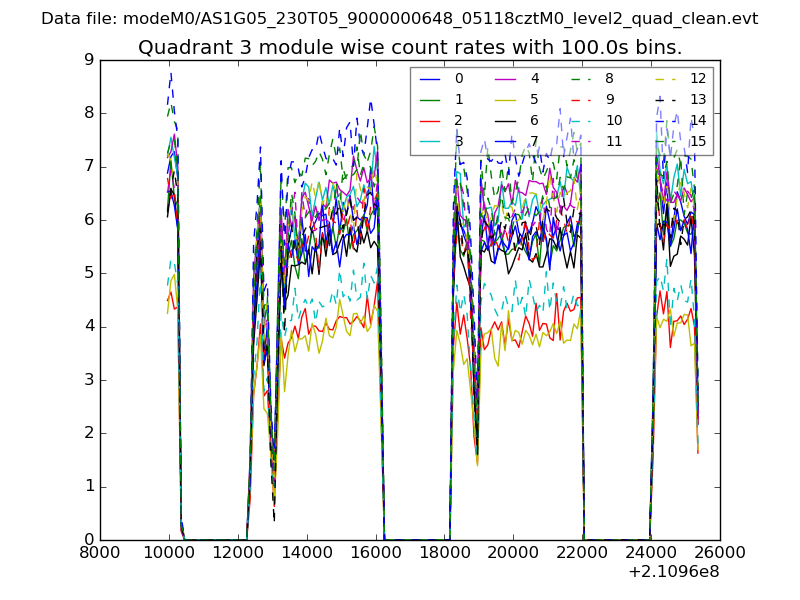
| Module-wise count rates for Quadrant C Data is divided into 100 sec bins |
 |
 |
| Module-wise count rates for Quadrant D Data is divided into 100 sec bins |
 |
 |
| Parameter | Plot |
|---|---|
| CZT HV Monitor | 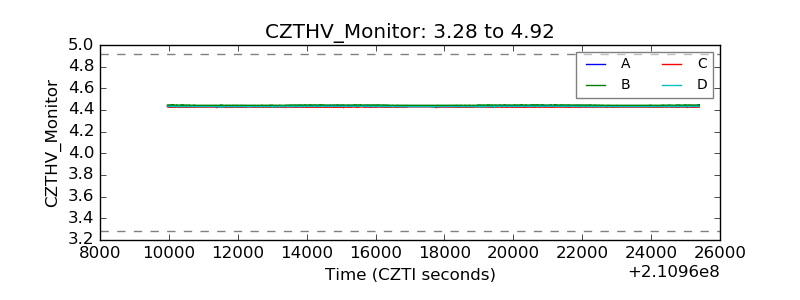 |
| D_VDD | 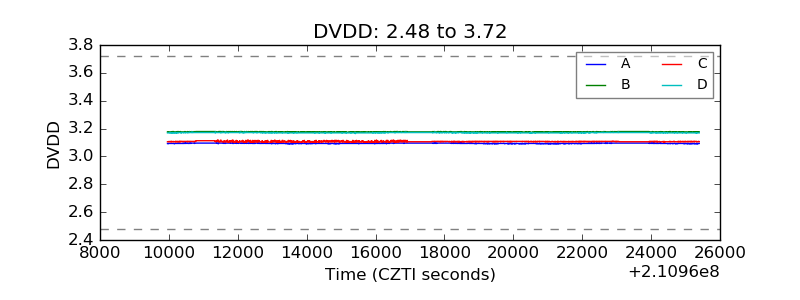 |
| Temperature 1 | 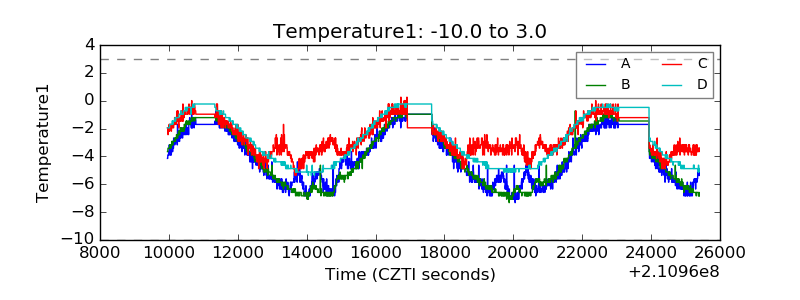 |
| Veto HV Monitor | 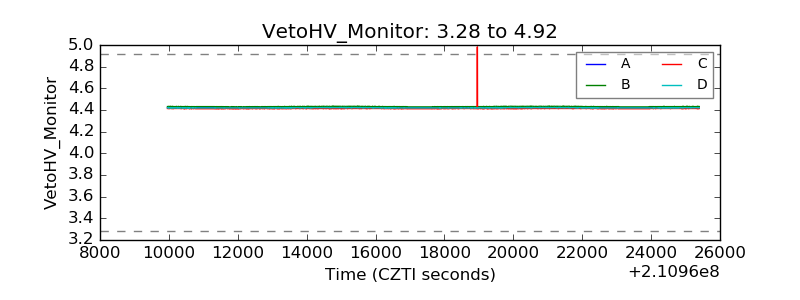 |
| Veto LLD | 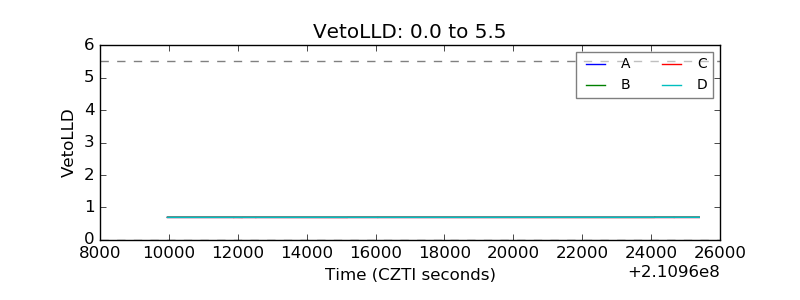 |
| Alpha Counter | 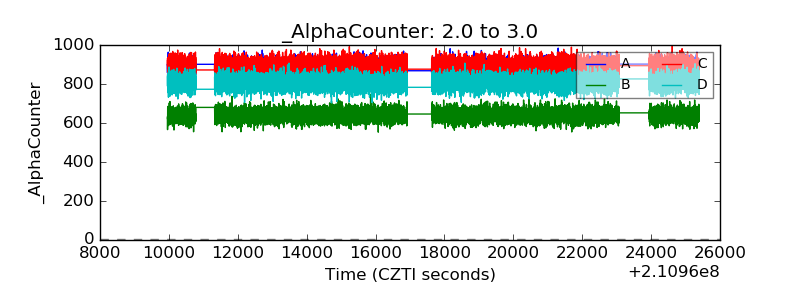 |
| _CPM_Rate | 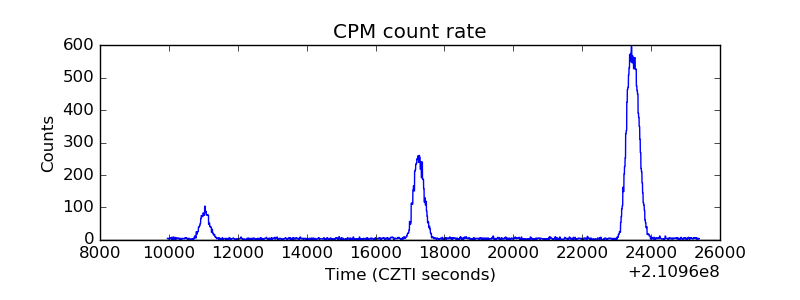 |
| CZT Counter |  |
| +2.5 Volts monitor |  |
| +5 Volts monitor |  |
| _ROLL_ROT | 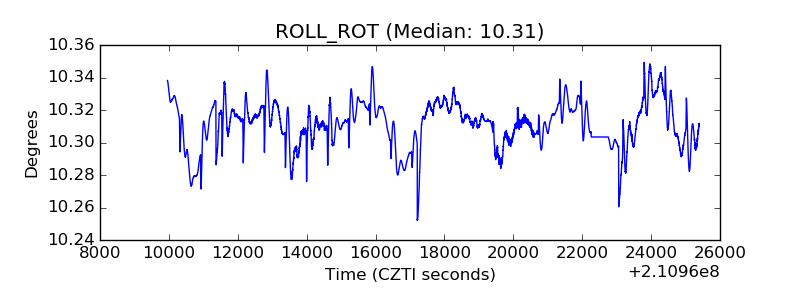 |
| _Roll_DEC | 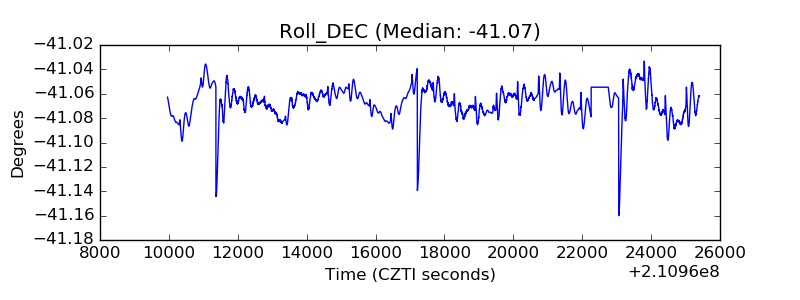 |
| _Roll_RA | 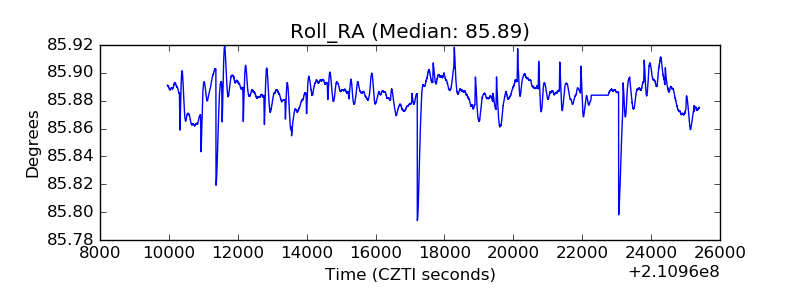 |
| Veto Counter | 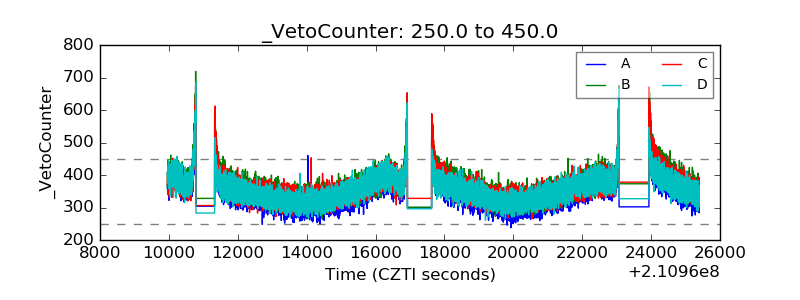 |