| Param | Original file | Final file |
|---|---|---|
| Filename | modeM0/AS1G05_230T05_9000000648_05119cztM0_level2.evt | modeM0/AS1G05_230T05_9000000648_05119cztM0_level2_quad_clean.evt |
| Size (bytes) | 517,688,640 | 81,440,640 |
| Size | 493.7 MB | 77.7 MB |
| Events in quadrant A | 2,973,217 | 517,075 |
| Events in quadrant B | 3,250,227 | 532,828 |
| Events in quadrant C | 2,920,927 | 530,011 |
| Events in quadrant D | 6,087,088 | 427,094 |
| Mode SS | |||
|---|---|---|---|
| Quadrant | BADHDUFLAG | Total packets | Discarded packets |
| A | 0 | 134 | 0 |
| B | 0 | 134 | 0 |
| C | 0 | 134 | 0 |
| D | 0 | 134 | 0 |
| Mode M0 | |||
|---|---|---|---|
| Quadrant | BADHDUFLAG | Total packets | Discarded packets |
| A | 0 | 13492 | 3 |
| B | 0 | 14084 | 2 |
| C | 0 | 13329 | 2 |
| D | 0 | 22788 | 2 |
| Mode M9 | |||
|---|---|---|---|
| Quadrant | BADHDUFLAG | Total packets | Discarded packets |
| A | 0 | 16 | 0 |
| B | 0 | 16 | 0 |
| C | 0 | 16 | 0 |
| D | 0 | 17 | 0 |
| Quadrant | Total seconds | Saturated seconds | Saturation percentage |
|---|---|---|---|
| A | 6576 | 32 | 0.486618% |
| B | 6576 | 63 | 0.958029% |
| C | 6576 | 25 | 0.380170% |
| D | 6576 | 1134 | 17.244526% |
Noise dominated data is calculated using 1-second bins in cleaned event files. If a bin has >2000 counts, and if more than 50% of those come from <1% of pixels, then it is considered to be noise-dominated and hence unusable.
| Quadrant | # 1 sec bins | Bins with >0 counts | Bins with >2000 counts | High rate bins dominated by noise | Noise dominated (total time) | Noise dominated (detector-on time) | Marked lightcurve |
|---|---|---|---|---|---|---|---|
| A | 7596 | 6577 | 11 | 11 | 0.14% | 0.17% | 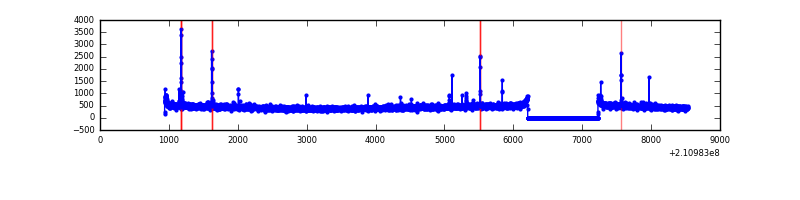 |
| B | 7596 | 6577 | 21 | 21 | 0.28% | 0.32% | 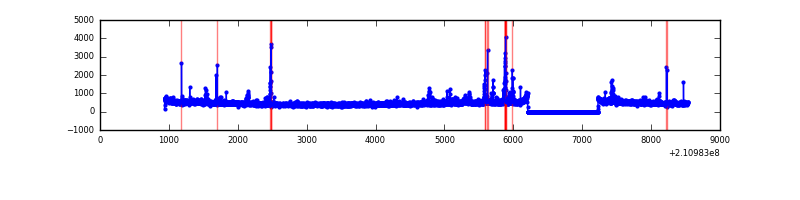 |
| C | 7596 | 6577 | 1 | 1 | 0.01% | 0.02% | 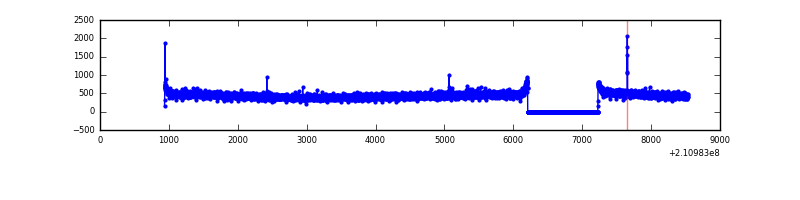 |
| D | 7596 | 6577 | 860 | 860 | 11.32% | 13.08% | 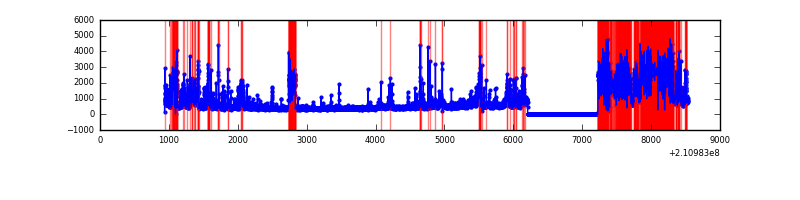 |
Top three noisy pixels from each quadrant. If the there are fewer than three noisy pixels in the level2.evt file, extra rows are filled as -1
| Pixel properties | Quadrant properties | ||||||
|---|---|---|---|---|---|---|---|
| Quadrant | DetID | PixID | Counts | Sigma | Mean | Median | Sigma |
| A | 0 | 50 | 70732 | 450.63 | 749 | 732 | 155.3 |
| A | 13 | 14 | 17725 | 109.39 | 749 | 732 | 155.3 |
| A | 0 | 226 | 7464 | 43.34 | 749 | 732 | 155.3 |
| B | 10 | 16 | 106769 | 720.13 | 767 | 749 | 147.2 |
| B | 15 | 54 | 39759 | 264.97 | 767 | 749 | 147.2 |
| B | 8 | 3 | 38918 | 259.26 | 767 | 749 | 147.2 |
| C | 12 | 4 | 10007 | 53.57 | 743 | 748 | 172.8 |
| C | 14 | 225 | 6795 | 34.99 | 743 | 748 | 172.8 |
| C | 13 | 61 | 5804 | 29.25 | 743 | 748 | 172.8 |
| D | 12 | 22 | 1585555 | 9745.67 | 661 | 640 | 162.6 |
| D | 13 | 235 | 1112466 | 6836.64 | 661 | 640 | 162.6 |
| D | 2 | 33 | 453707 | 2785.92 | 661 | 640 | 162.6 |
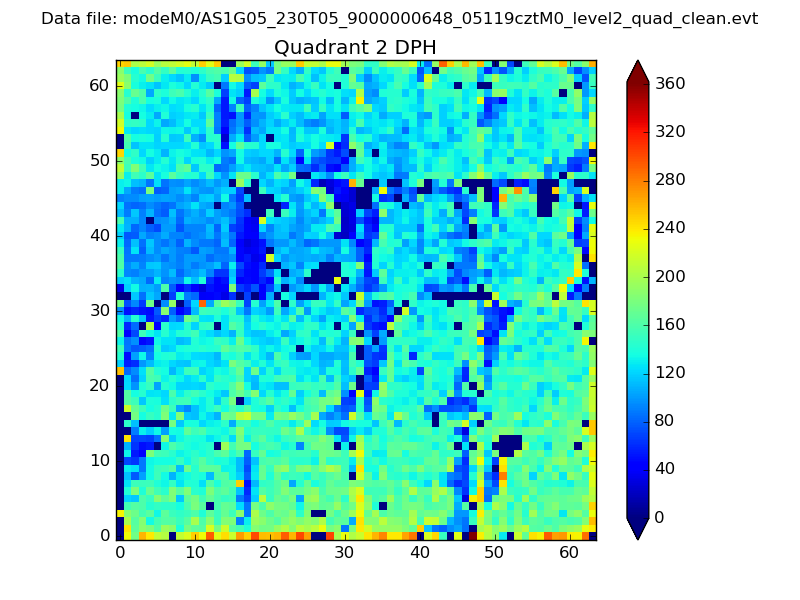
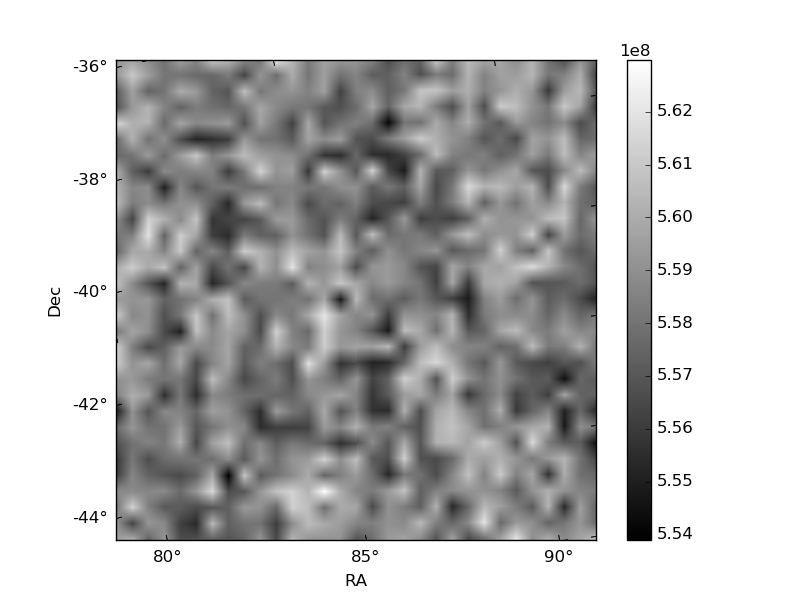
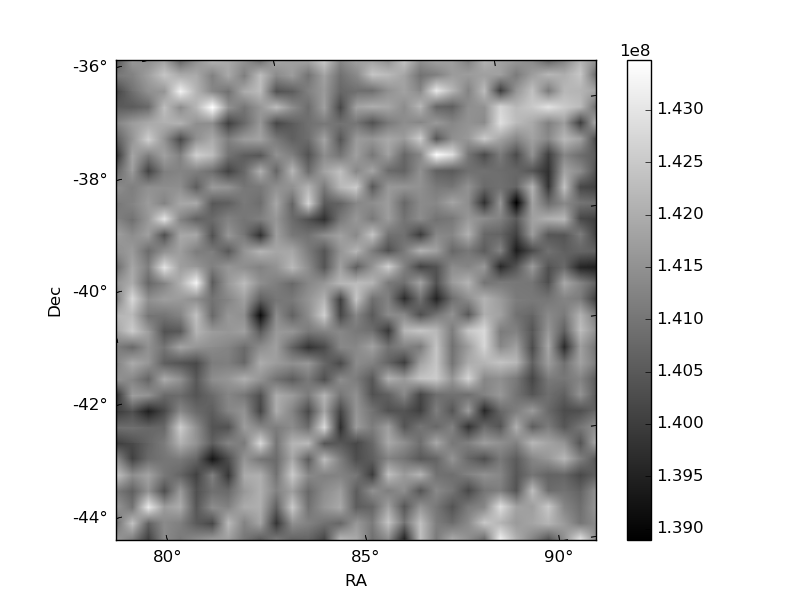
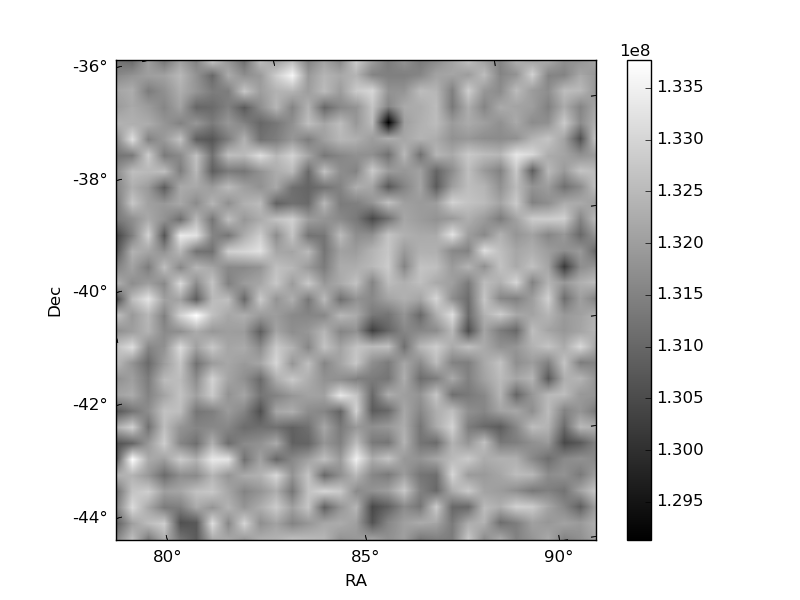
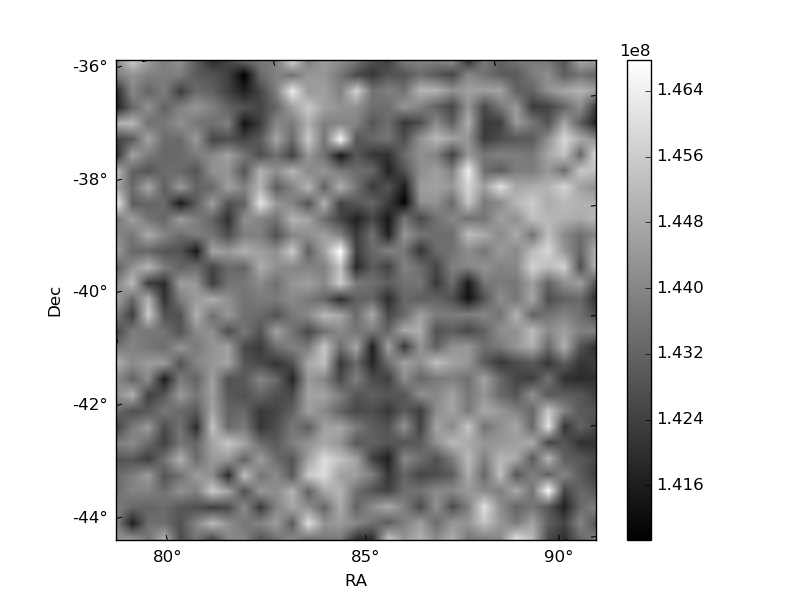
Histogram calculated using DETX and DETY for each event in the final _common_clean file
| Quadrant A | 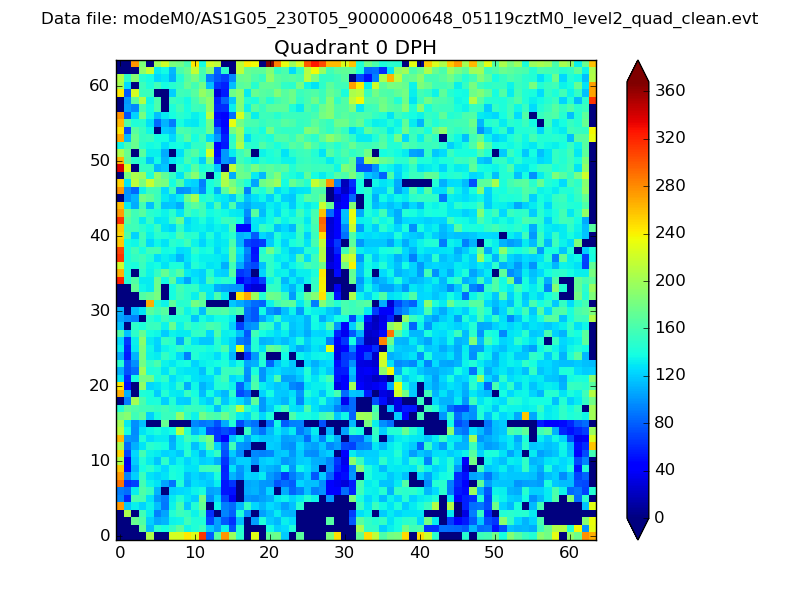 |
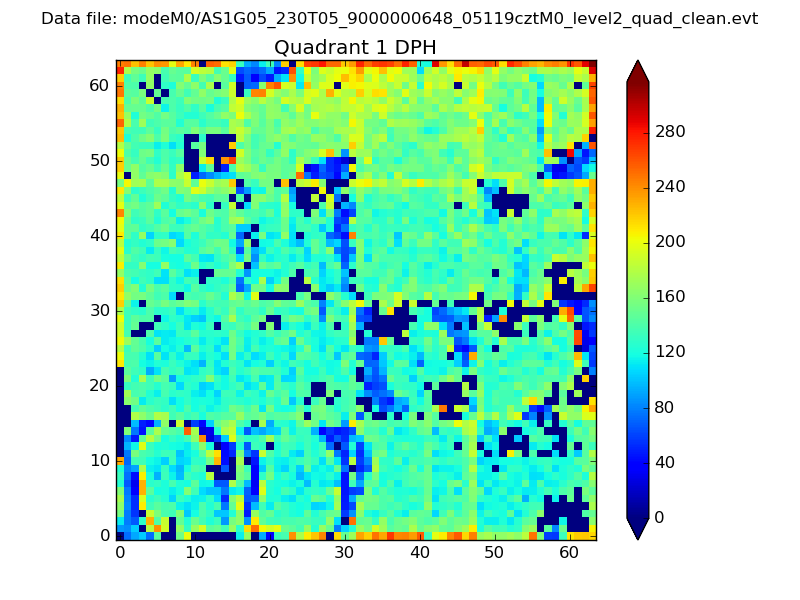 |
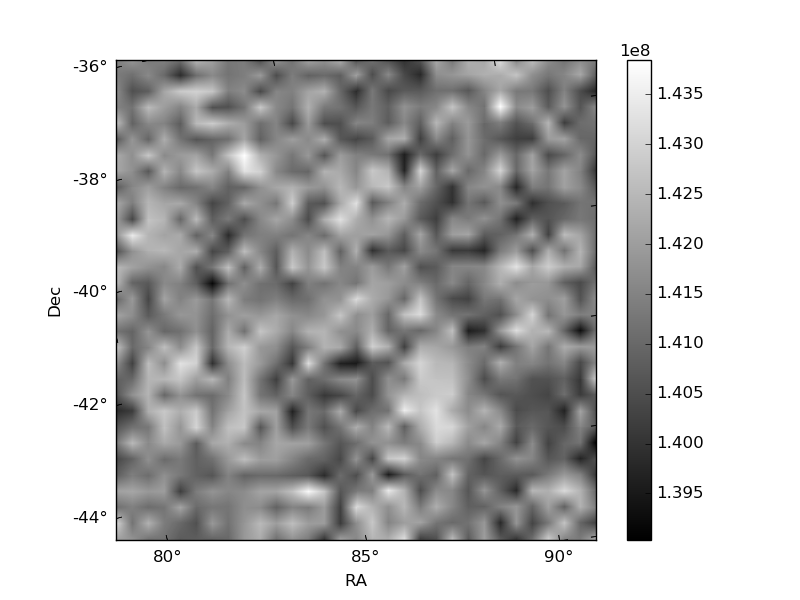
Quadrant B |
|---|---|---|---|
| Quadrant D | 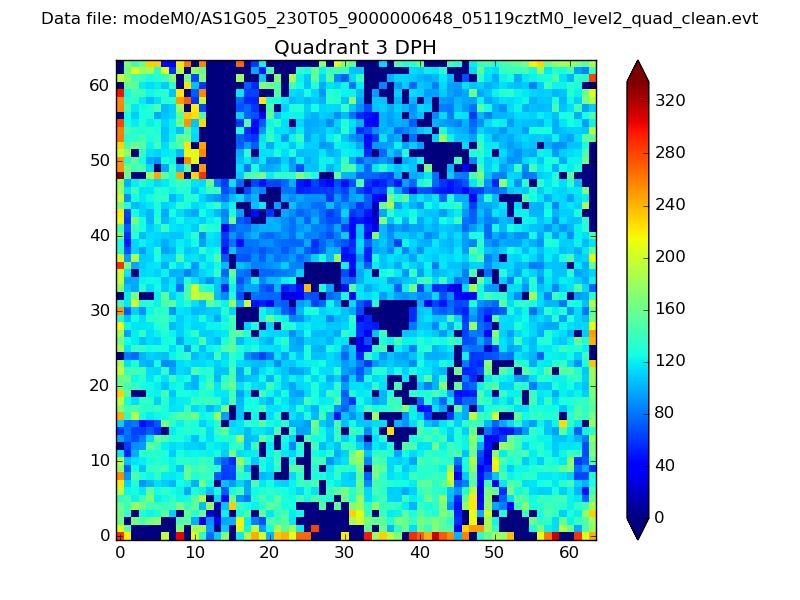 |
 |
Quadrant C |
| Plot type | Count rate plots | Images |
|---|---|---|
| Comparison with Poisson distribution Blue bars denote a histogram of data divided into 1 sec bins. Red curve is a Poisson curve with rate = median count rate of data. |
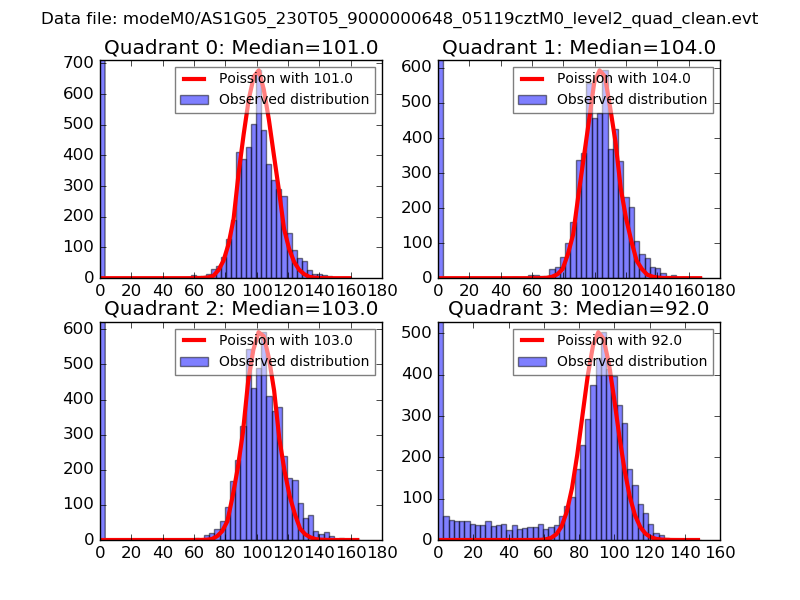 |
 |
| Quadrant-wise count rates Data is divided into 100 sec bins |
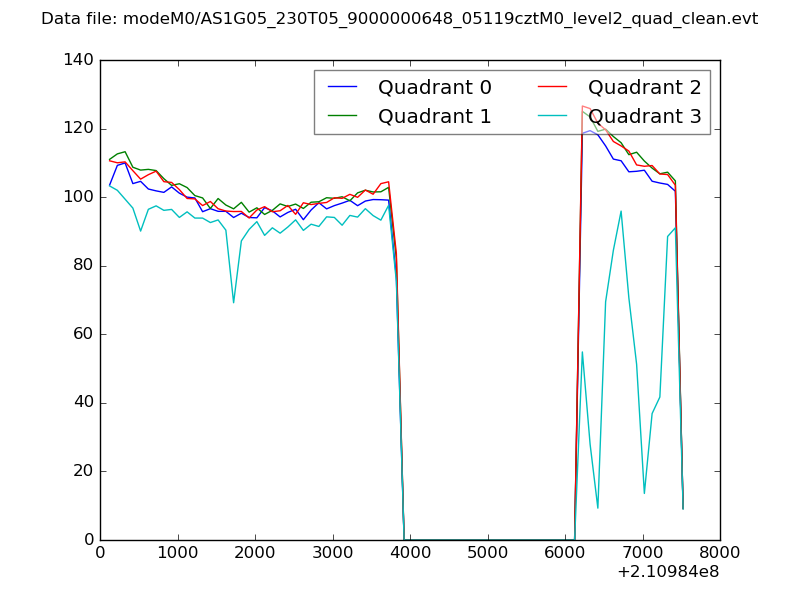 |
|
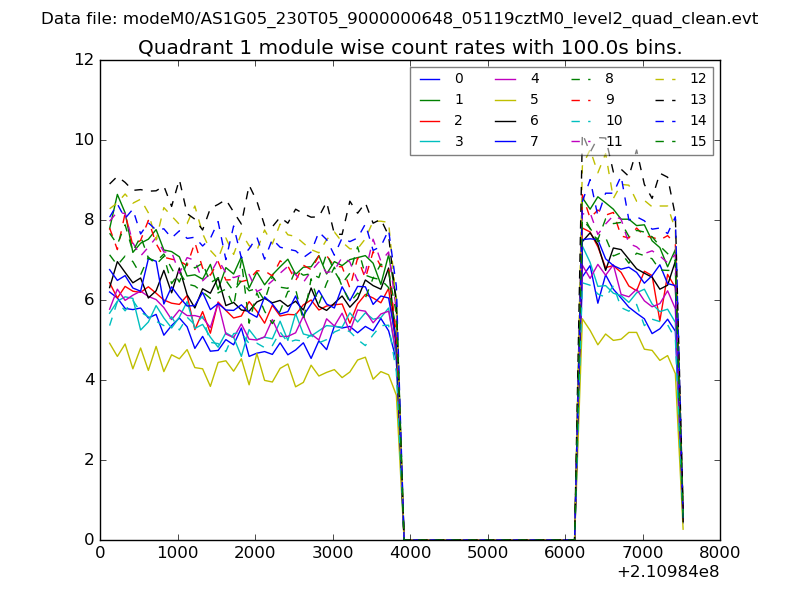
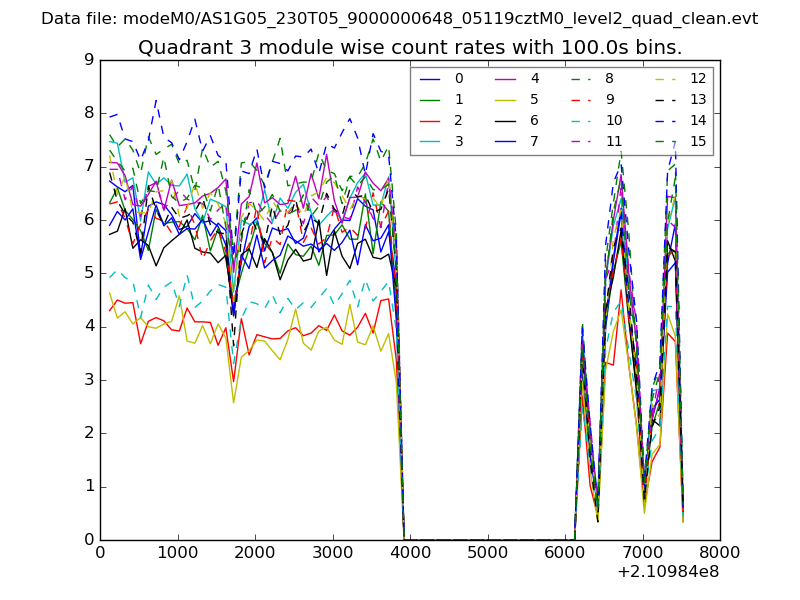
| Module-wise count rates for Quadrant A Data is divided into 100 sec bins |
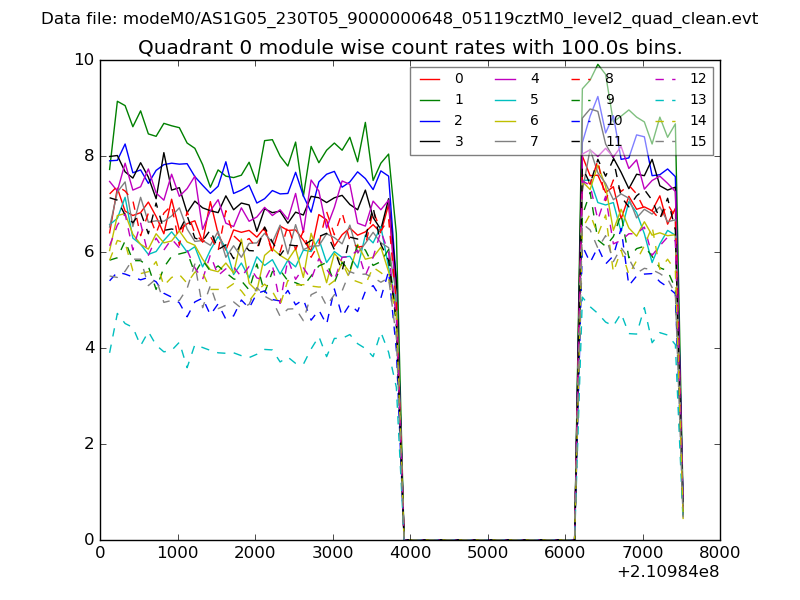 |
 |
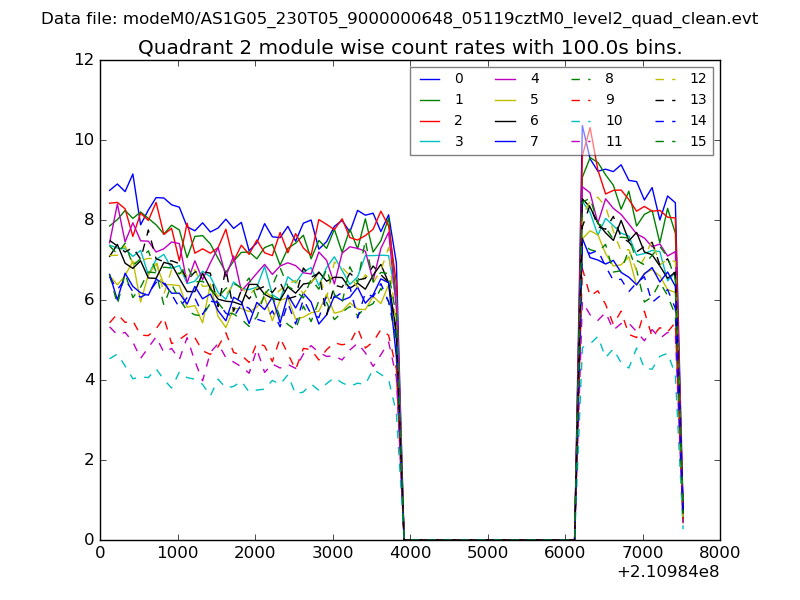
| Module-wise count rates for Quadrant B Data is divided into 100 sec bins |
 |
 |
| Module-wise count rates for Quadrant C Data is divided into 100 sec bins |
 |
 |
| Module-wise count rates for Quadrant D Data is divided into 100 sec bins |
 |
 |
| Parameter | Plot |
|---|---|
| CZT HV Monitor | 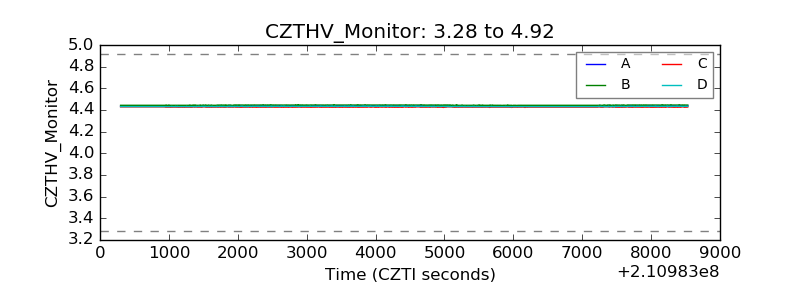 |
| D_VDD |  |
| Temperature 1 | 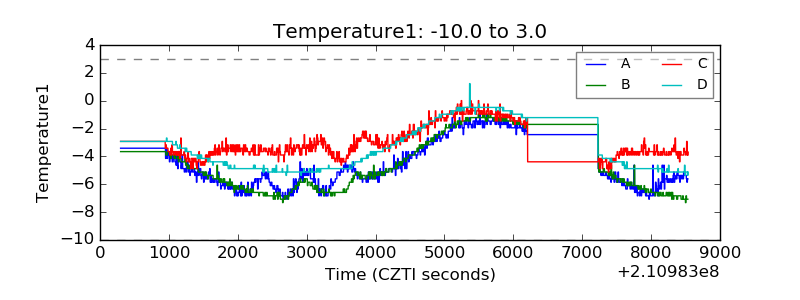 |
| Veto HV Monitor | 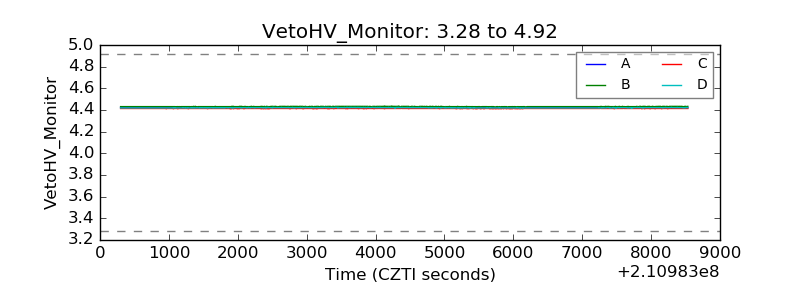 |
| Veto LLD | 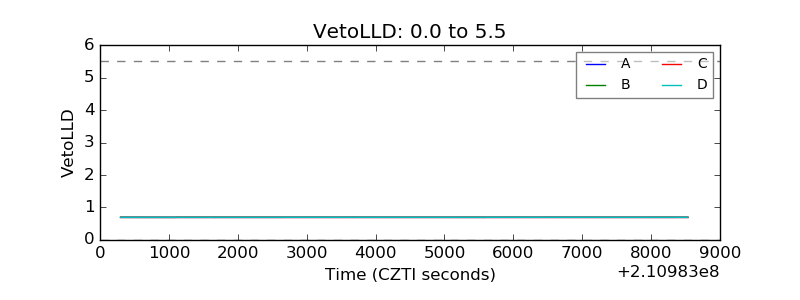 |
| Alpha Counter | 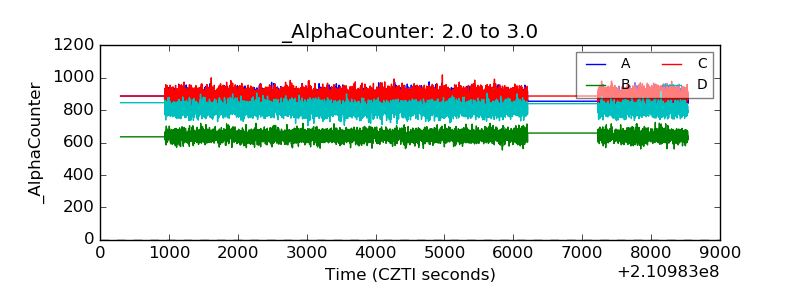 |
| _CPM_Rate | 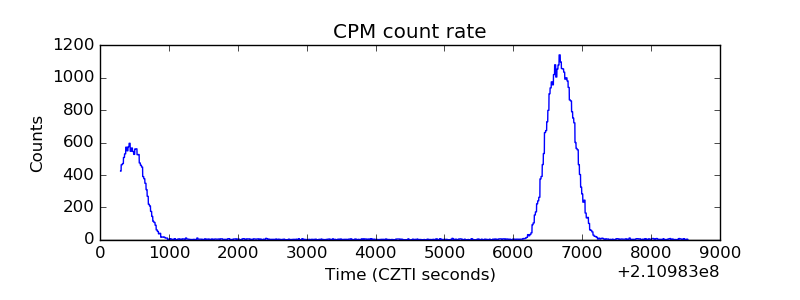 |
| CZT Counter | 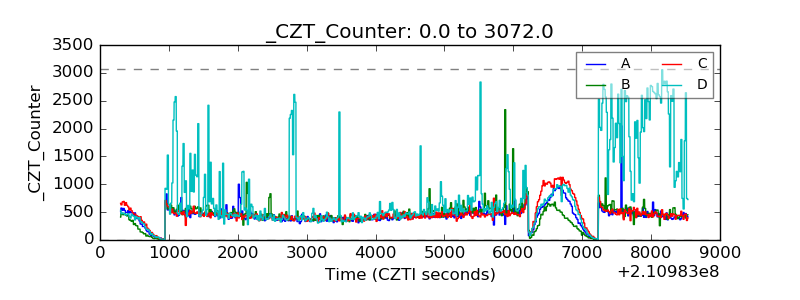 |
| +2.5 Volts monitor |  |
| +5 Volts monitor |  |
| _ROLL_ROT | 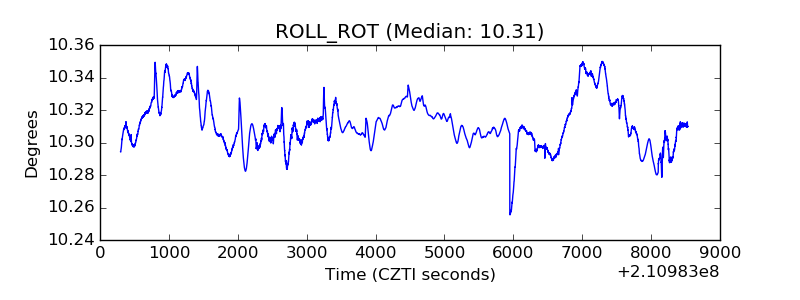 |
| _Roll_DEC | 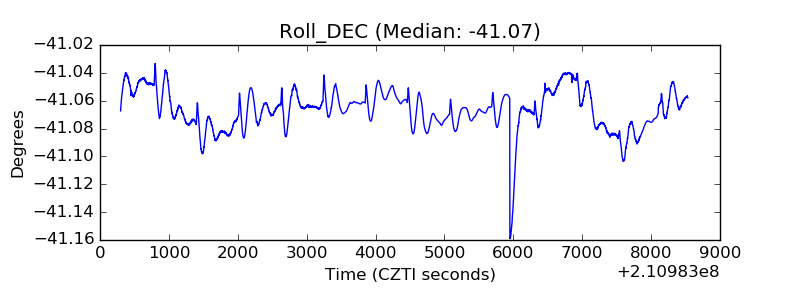 |
| _Roll_RA | 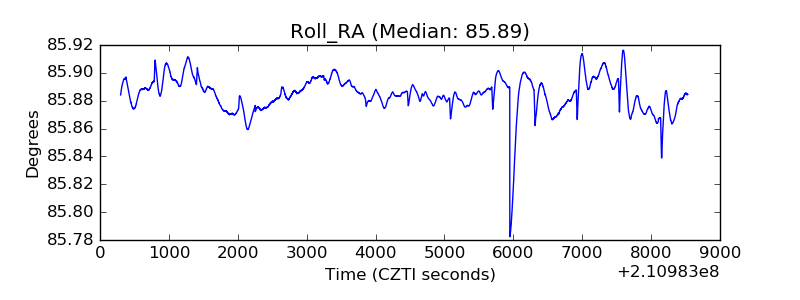 |
| Veto Counter | 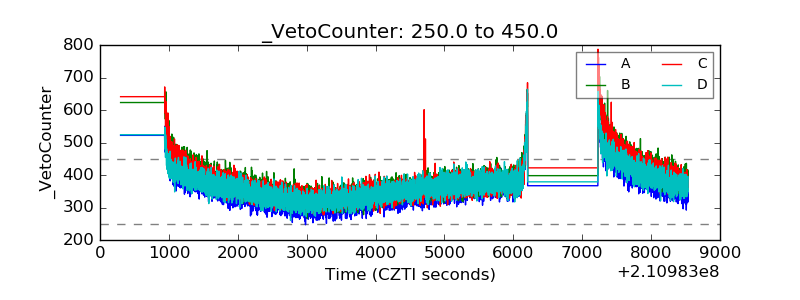 |