| Param | Original file | Final file |
|---|---|---|
| Filename | modeM0/AS1G05_230T05_9000000648_05121cztM0_level2.evt | modeM0/AS1G05_230T05_9000000648_05121cztM0_level2_quad_clean.evt |
| Size (bytes) | 368,781,120 | 43,522,560 |
| Size | 351.7 MB | 41.5 MB |
| Events in quadrant A | 2,009,185 | 263,887 |
| Events in quadrant B | 2,202,682 | 275,760 |
| Events in quadrant C | 1,999,614 | 276,550 |
| Events in quadrant D | 4,673,689 | 207,888 |
| Mode SS | |||
|---|---|---|---|
| Quadrant | BADHDUFLAG | Total packets | Discarded packets |
| A | 0 | 97 | 11 |
| B | 0 | 97 | 13 |
| C | 0 | 96 | 10 |
| D | 0 | 94 | 10 |
| Mode M0 | |||
|---|---|---|---|
| Quadrant | BADHDUFLAG | Total packets | Discarded packets |
| A | 0 | 9523 | 872 |
| B | 0 | 9990 | 862 |
| C | 0 | 9477 | 861 |
| D | 0 | 18332 | 1568 |
| Mode M9 | |||
|---|---|---|---|
| Quadrant | BADHDUFLAG | Total packets | Discarded packets |
| A | 0 | 22 | 0 |
| B | 0 | 22 | 0 |
| C | 0 | 22 | 0 |
| D | 0 | 22 | 0 |
| Quadrant | Total seconds | Saturated seconds | Saturation percentage |
|---|---|---|---|
| A | 4166 | 22 | 0.528084% |
| B | 4169 | 36 | 0.863516% |
| C | 4168 | 24 | 0.575816% |
| D | 4163 | 909 | 21.835215% |
Noise dominated data is calculated using 1-second bins in cleaned event files. If a bin has >2000 counts, and if more than 50% of those come from <1% of pixels, then it is considered to be noise-dominated and hence unusable.
| Quadrant | # 1 sec bins | Bins with >0 counts | Bins with >2000 counts | High rate bins dominated by noise | Noise dominated (total time) | Noise dominated (detector-on time) | Marked lightcurve |
|---|---|---|---|---|---|---|---|
| A | 8911 | 4209 | 1 | 1 | 0.01% | 0.02% | 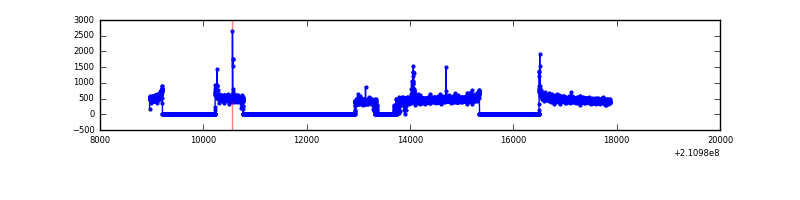 |
| B | 8911 | 4211 | 3 | 3 | 0.03% | 0.07% | 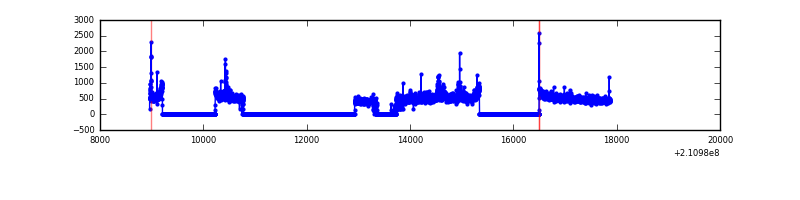 |
| C | 8911 | 4215 | 1 | 1 | 0.01% | 0.02% |  |
| D | 8910 | 4207 | 625 | 625 | 7.01% | 14.86% | 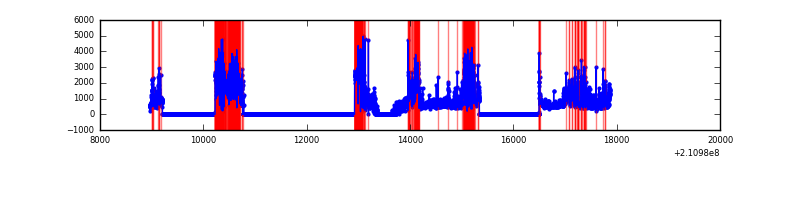 |
Top three noisy pixels from each quadrant. If the there are fewer than three noisy pixels in the level2.evt file, extra rows are filled as -1
| Pixel properties | Quadrant properties | ||||||
|---|---|---|---|---|---|---|---|
| Quadrant | DetID | PixID | Counts | Sigma | Mean | Median | Sigma |
| A | 0 | 50 | 29818 | 277.69 | 512 | 499 | 105.6 |
| A | 0 | 226 | 5363 | 46.07 | 512 | 499 | 105.6 |
| A | 12 | 194 | 5155 | 44.1 | 512 | 499 | 105.6 |
| B | 8 | 3 | 63798 | 622.41 | 522 | 510 | 101.7 |
| B | 15 | 204 | 51767 | 504.09 | 522 | 510 | 101.7 |
| B | 10 | 16 | 24327 | 234.23 | 522 | 510 | 101.7 |
| C | 14 | 225 | 6526 | 50.33 | 509 | 512 | 119.5 |
| C | 13 | 61 | 4060 | 29.69 | 509 | 512 | 119.5 |
| C | 1 | 16 | 3302 | 23.35 | 509 | 512 | 119.5 |
| D | 12 | 22 | 1197280 | 11112.07 | 437 | 422 | 107.7 |
| D | 13 | 235 | 1001143 | 9291.06 | 437 | 422 | 107.7 |
| D | 6 | 223 | 313378 | 2905.6 | 437 | 422 | 107.7 |
Histogram calculated using DETX and DETY for each event in the final _common_clean file
| Quadrant A |  |
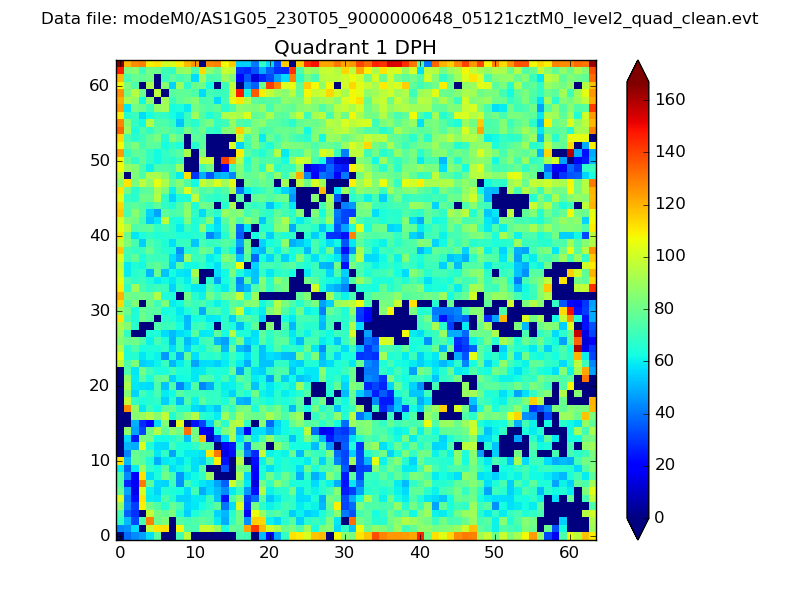 |
Quadrant B |
|---|---|---|---|
| Quadrant D | 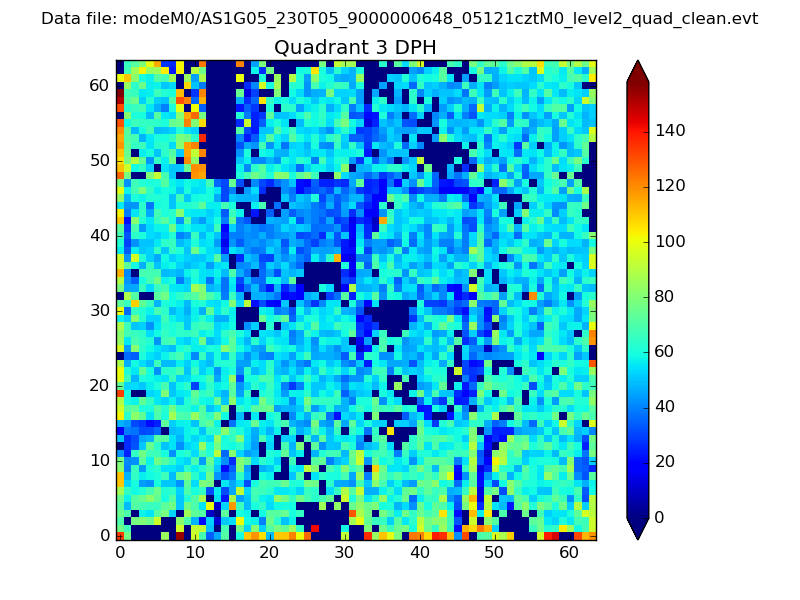 |
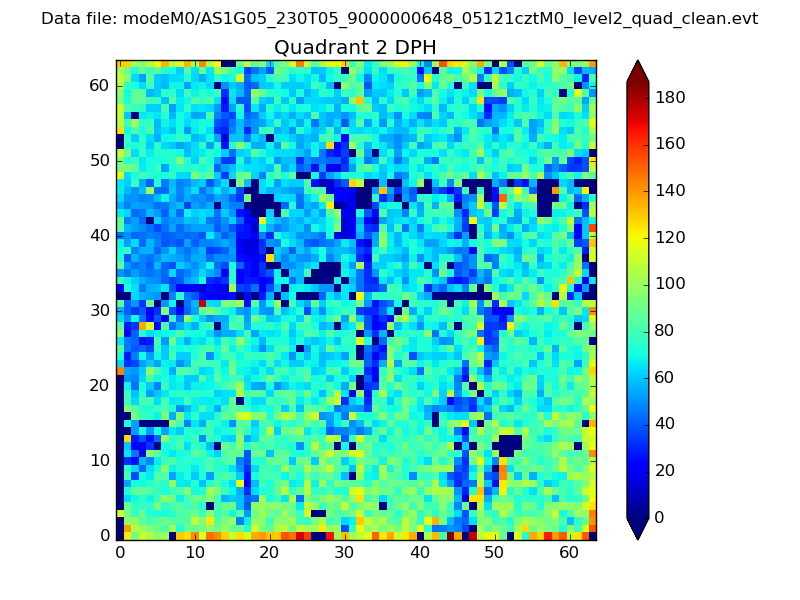 |
Quadrant C |
| Plot type | Count rate plots | Images |
|---|---|---|
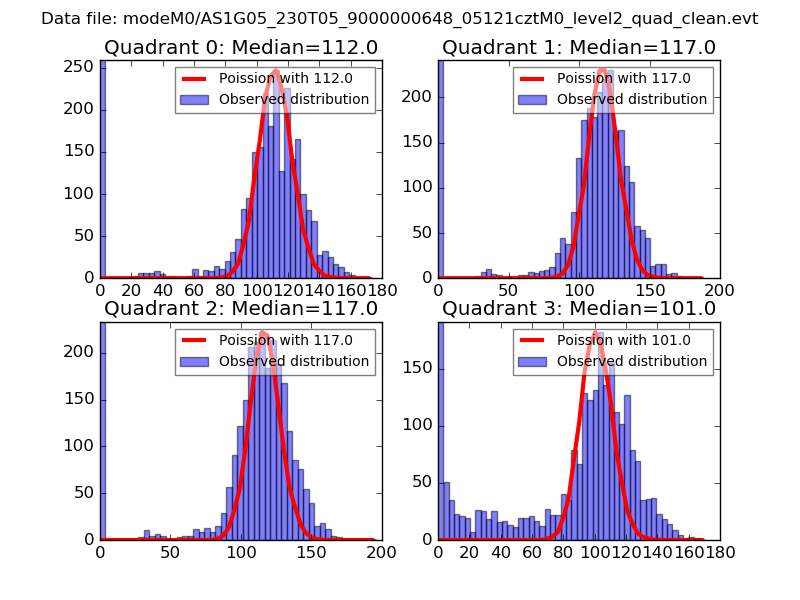
| Comparison with Poisson distribution Blue bars denote a histogram of data divided into 1 sec bins. Red curve is a Poisson curve with rate = median count rate of data. |
 |
 |
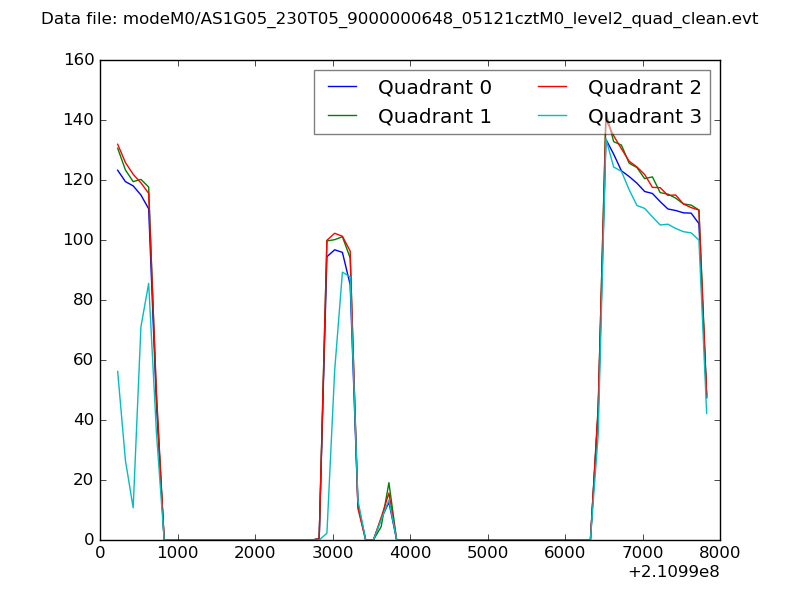
| Quadrant-wise count rates Data is divided into 100 sec bins |
 |
|
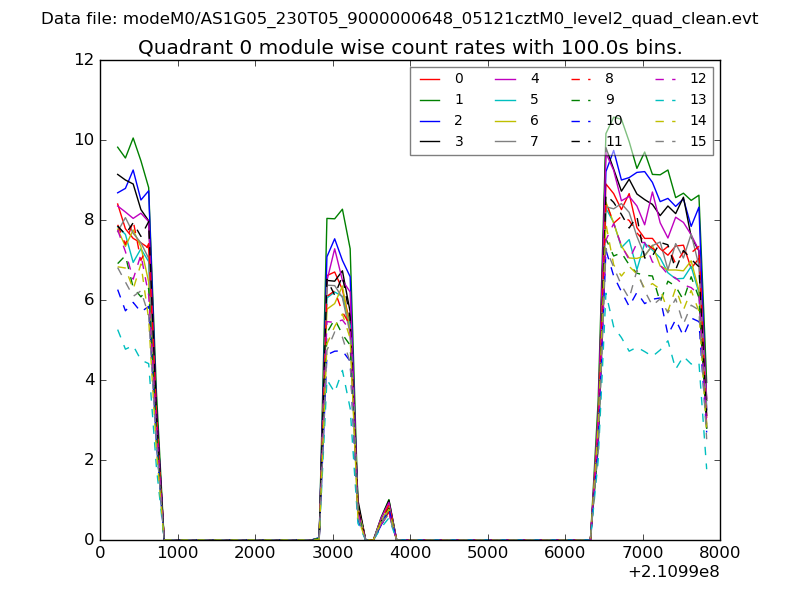
| Module-wise count rates for Quadrant A Data is divided into 100 sec bins |
 |
 |
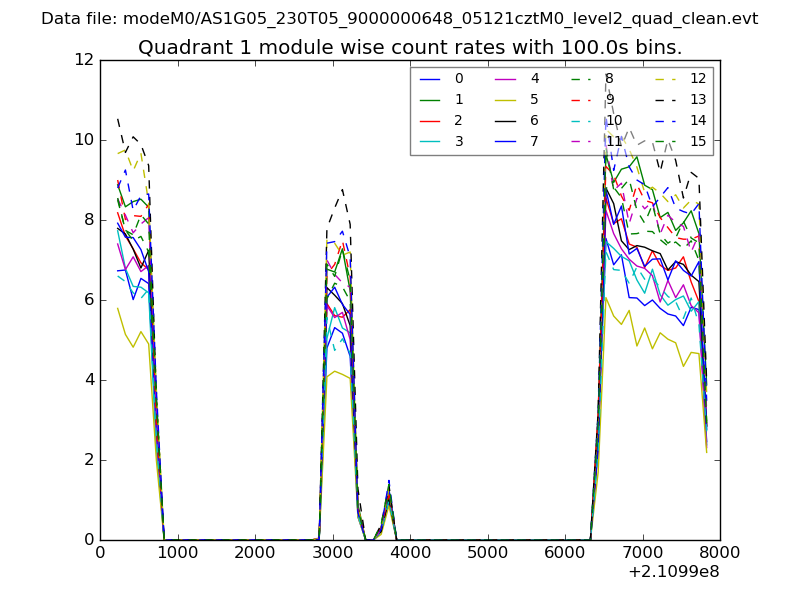
| Module-wise count rates for Quadrant B Data is divided into 100 sec bins |
 |
 |
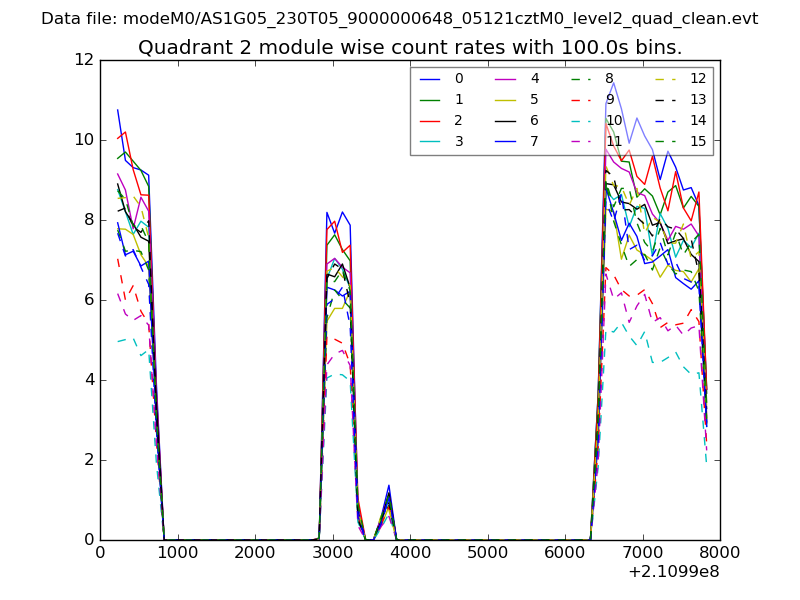
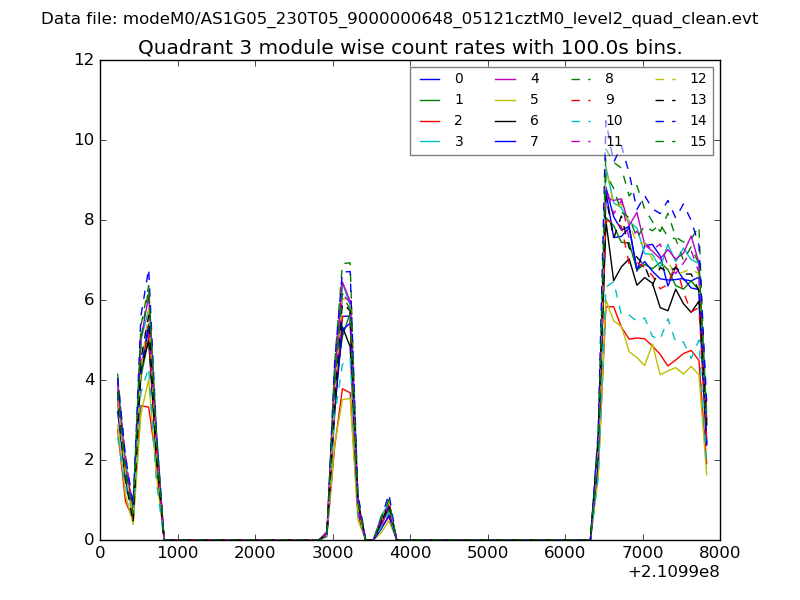
| Module-wise count rates for Quadrant C Data is divided into 100 sec bins |
 |
 |
| Module-wise count rates for Quadrant D Data is divided into 100 sec bins |
 |
 |
| Parameter | Plot |
|---|---|
| CZT HV Monitor | 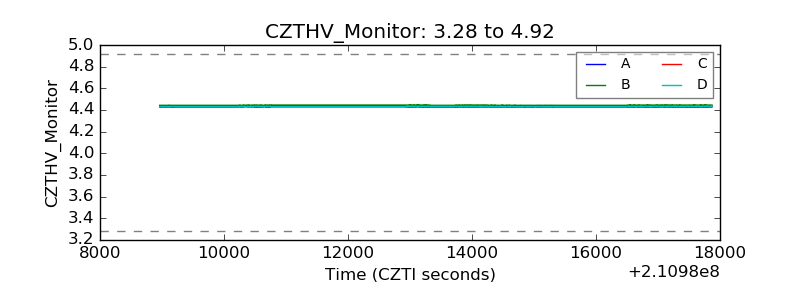 |
| D_VDD | 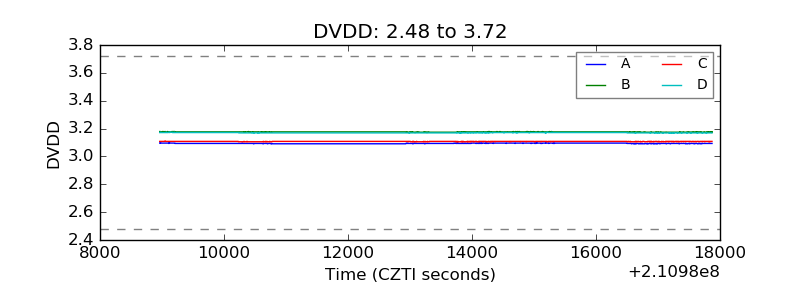 |
| Temperature 1 | 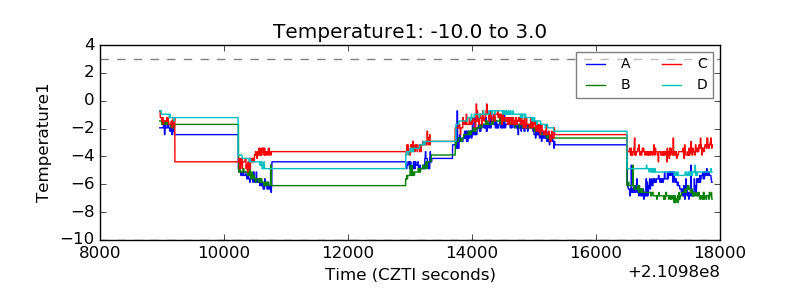 |
| Veto HV Monitor | 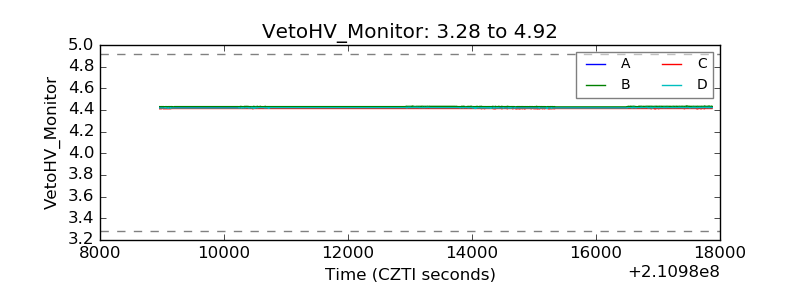 |
| Veto LLD | 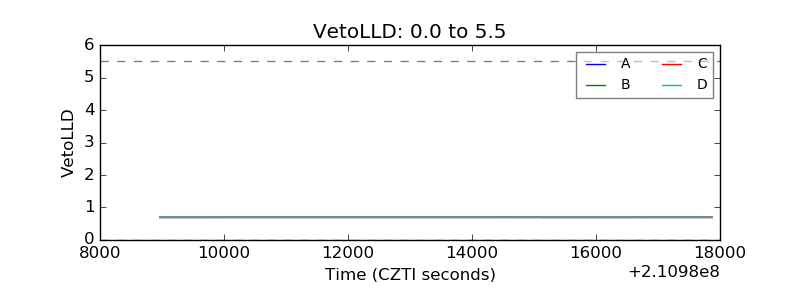 |
| Alpha Counter | 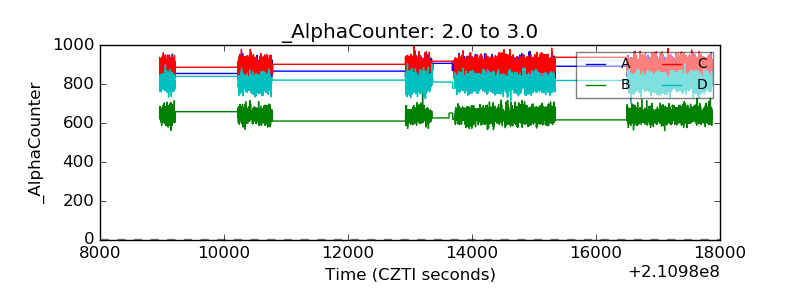 |
| _CPM_Rate | 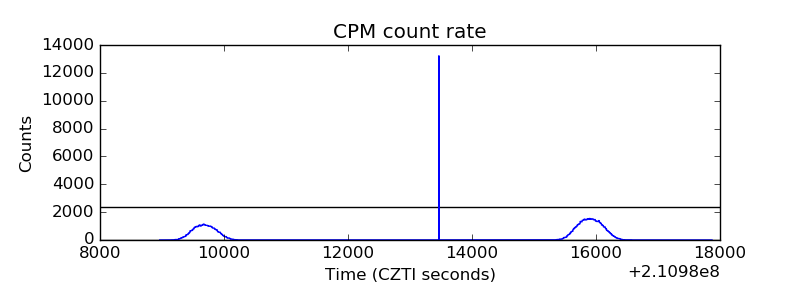 |
| CZT Counter | 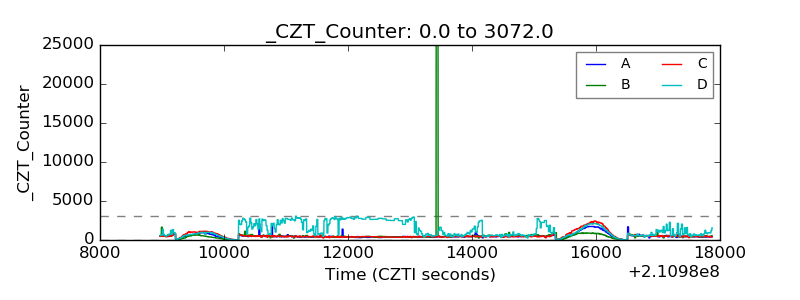 |
| +2.5 Volts monitor |  |
| +5 Volts monitor | 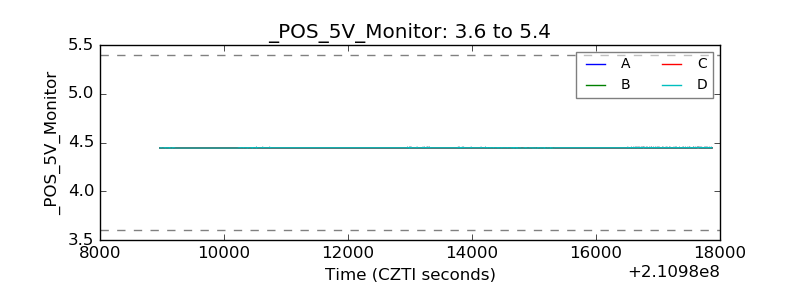 |
| _ROLL_ROT | 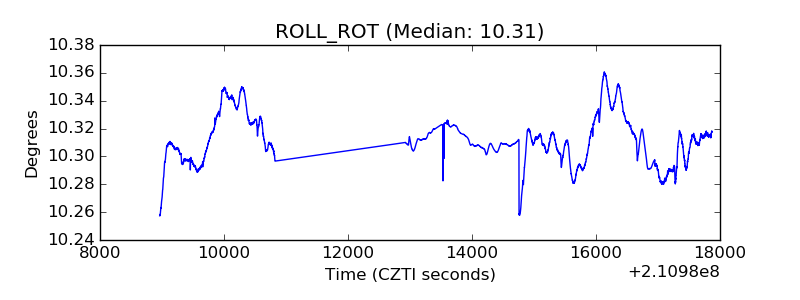 |
| _Roll_DEC | 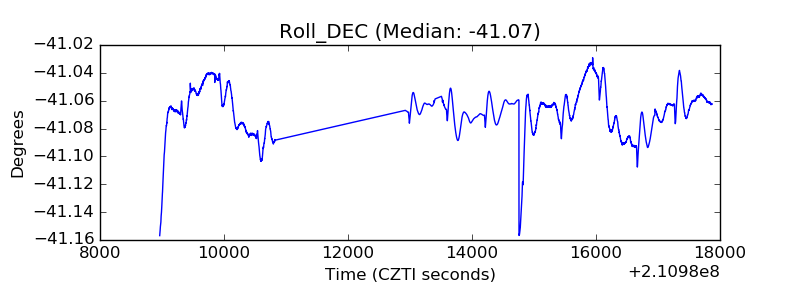 |
| _Roll_RA |  |
| Veto Counter | 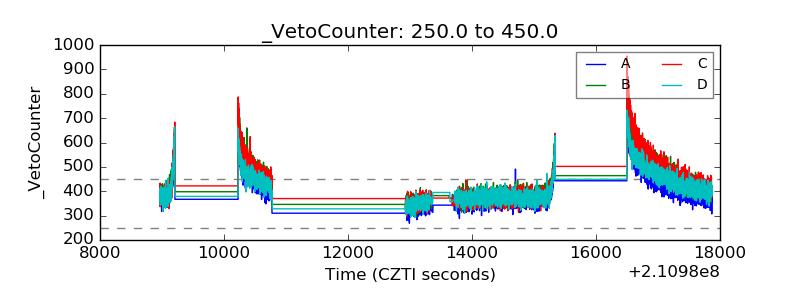 |