| Param | Original file | Final file |
|---|---|---|
| Filename | modeM0/AS1G05_230T05_9000000648_05122cztM0_level2.evt | modeM0/AS1G05_230T05_9000000648_05122cztM0_level2_quad_clean.evt |
| Size (bytes) | 1,033,476,480 | 137,733,120 |
| Size | 985.6 MB | 131.4 MB |
| Events in quadrant A | 5,261,323 | 882,584 |
| Events in quadrant B | 5,857,401 | 916,165 |
| Events in quadrant C | 5,292,741 | 916,282 |
| Events in quadrant D | 14,099,010 | 648,282 |
| Mode SS | |||
|---|---|---|---|
| Quadrant | BADHDUFLAG | Total packets | Discarded packets |
| A | 0 | 240 | 0 |
| B | 0 | 240 | 2 |
| C | 0 | 240 | 4 |
| D | 0 | 240 | 4 |
| Mode M0 | |||
|---|---|---|---|
| Quadrant | BADHDUFLAG | Total packets | Discarded packets |
| A | 0 | 24006 | 163 |
| B | 0 | 25290 | 187 |
| C | 0 | 23956 | 167 |
| D | 0 | 50675 | 886 |
| Mode M9 | |||
|---|---|---|---|
| Quadrant | BADHDUFLAG | Total packets | Discarded packets |
| A | 0 | 24 | 0 |
| B | 0 | 24 | 0 |
| C | 0 | 24 | 0 |
| D | 0 | 24 | 0 |
| Quadrant | Total seconds | Saturated seconds | Saturation percentage |
|---|---|---|---|
| A | 11684 | 26 | 0.222527% |
| B | 11680 | 71 | 0.607877% |
| C | 11682 | 25 | 0.214004% |
| D | 11598 | 3007 | 25.926884% |
Noise dominated data is calculated using 1-second bins in cleaned event files. If a bin has >2000 counts, and if more than 50% of those come from <1% of pixels, then it is considered to be noise-dominated and hence unusable.
| Quadrant | # 1 sec bins | Bins with >0 counts | Bins with >2000 counts | High rate bins dominated by noise | Noise dominated (total time) | Noise dominated (detector-on time) | Marked lightcurve |
|---|---|---|---|---|---|---|---|
| A | 14137 | 11766 | 4 | 4 | 0.03% | 0.03% | 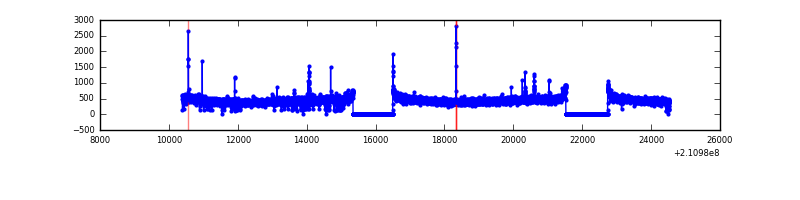 |
| B | 14137 | 11760 | 16 | 16 | 0.11% | 0.14% | 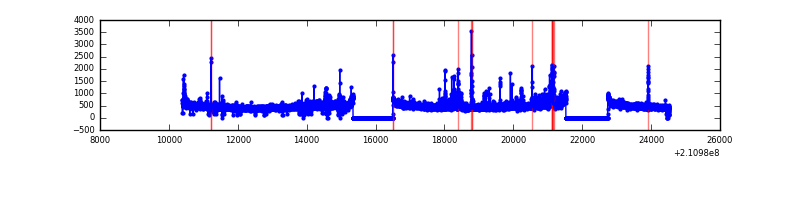 |
| C | 14137 | 11763 | 1 | 1 | 0.01% | 0.01% | 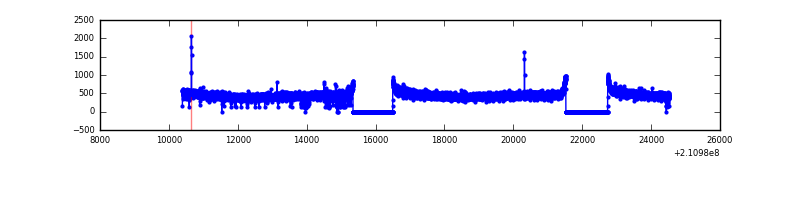 |
| D | 14136 | 11709 | 2617 | 2617 | 18.51% | 22.35% | 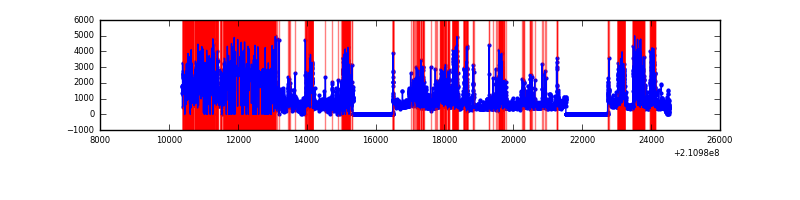 |
Top three noisy pixels from each quadrant. If the there are fewer than three noisy pixels in the level2.evt file, extra rows are filled as -1
| Pixel properties | Quadrant properties | ||||||
|---|---|---|---|---|---|---|---|
| Quadrant | DetID | PixID | Counts | Sigma | Mean | Median | Sigma |
| A | 0 | 50 | 53652 | 191.41 | 1349 | 1320 | 273.4 |
| A | 0 | 226 | 13614 | 44.97 | 1349 | 1320 | 273.4 |
| A | 12 | 194 | 13478 | 44.47 | 1349 | 1320 | 273.4 |
| B | 8 | 3 | 198918 | 762.28 | 1376 | 1345 | 259.2 |
| B | 10 | 16 | 109479 | 417.21 | 1376 | 1345 | 259.2 |
| B | 15 | 204 | 108666 | 414.07 | 1376 | 1345 | 259.2 |
| C | 13 | 61 | 10730 | 30.15 | 1351 | 1359 | 310.8 |
| C | 14 | 225 | 7969 | 21.27 | 1351 | 1359 | 310.8 |
| C | 1 | 16 | 7439 | 19.56 | 1351 | 1359 | 310.8 |
| D | 12 | 22 | 5073868 | 18733.91 | 1117 | 1085 | 270.8 |
| D | 13 | 235 | 1699758 | 6273.24 | 1117 | 1085 | 270.8 |
| D | 13 | 239 | 1472358 | 5433.45 | 1117 | 1085 | 270.8 |
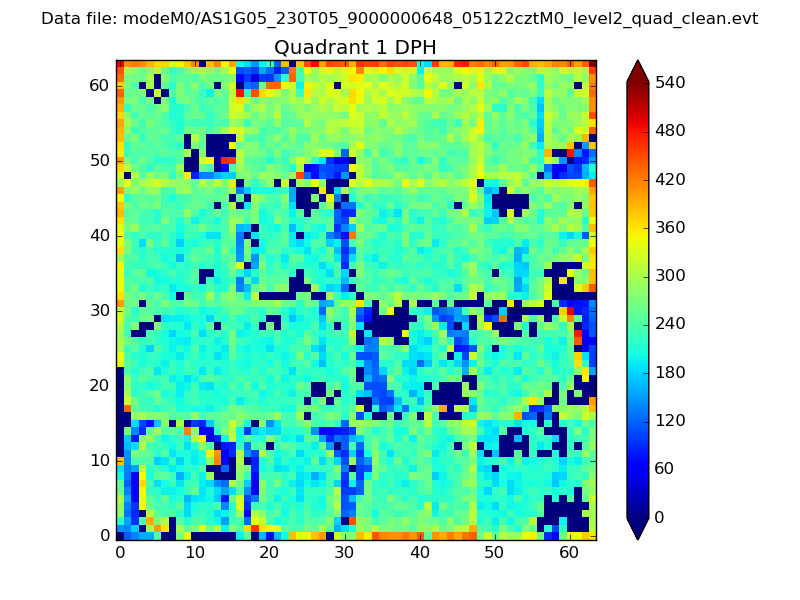
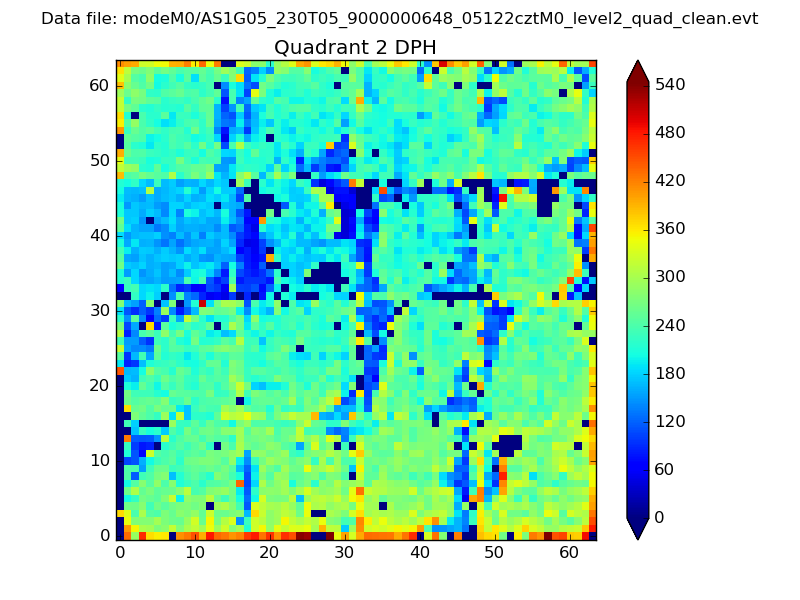
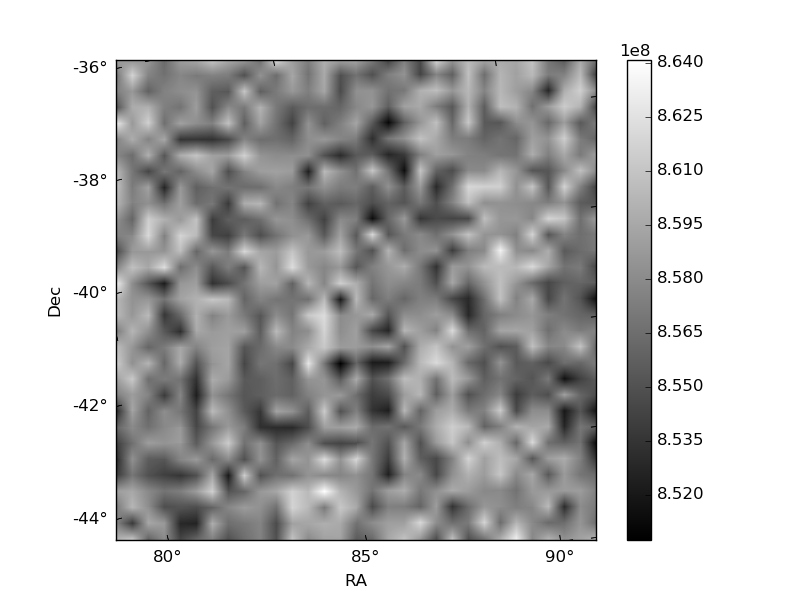
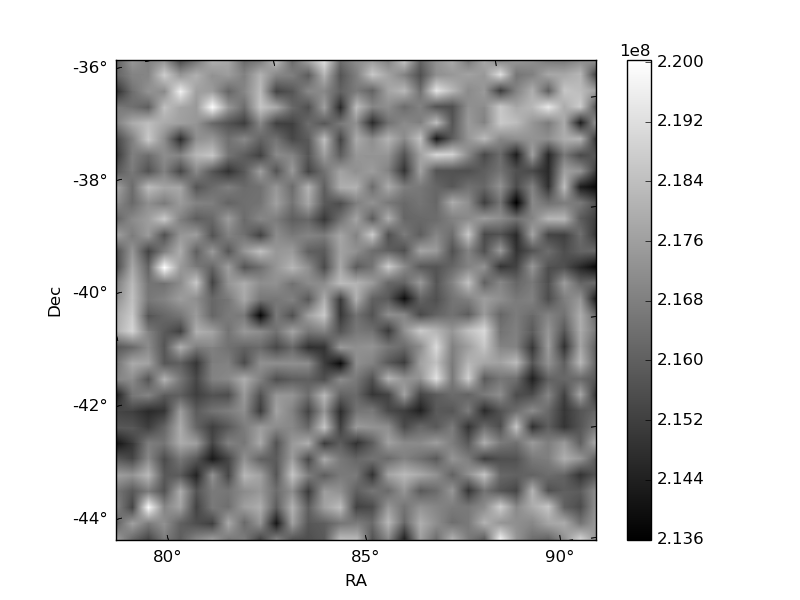
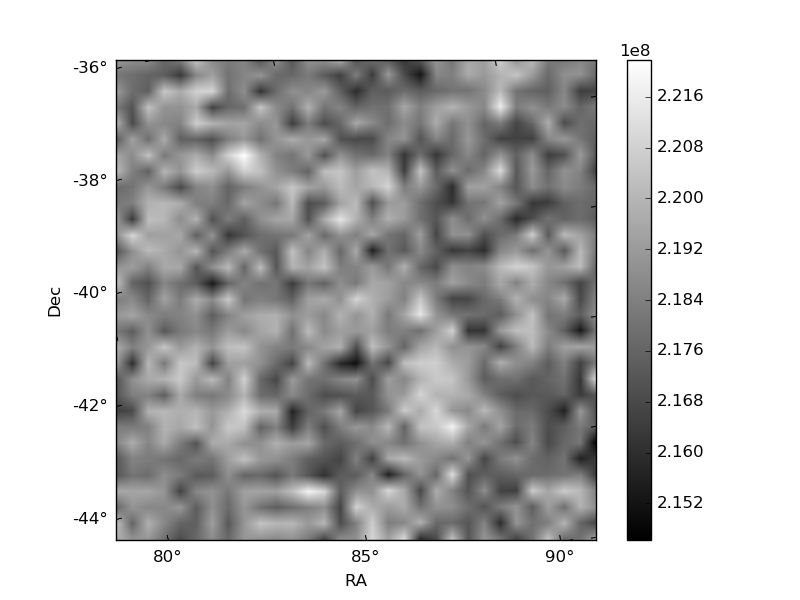
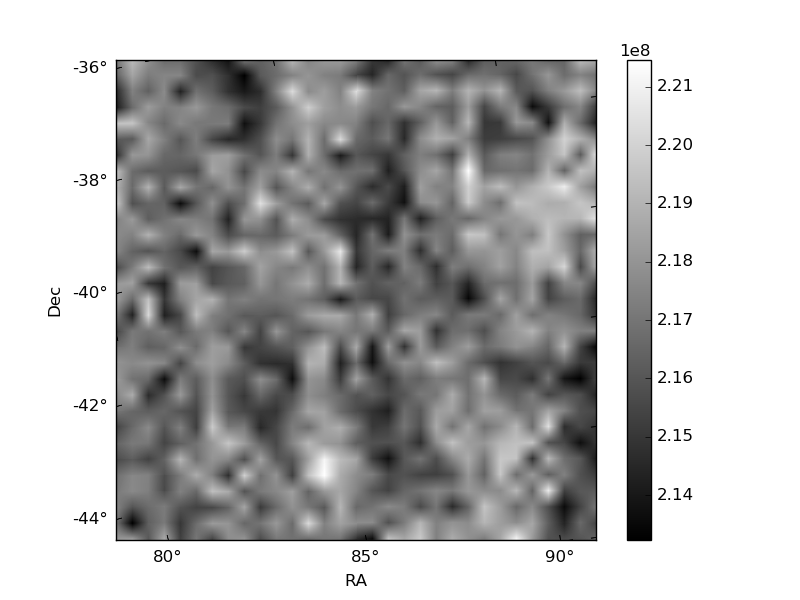
Histogram calculated using DETX and DETY for each event in the final _common_clean file
| Quadrant A |  |
 |
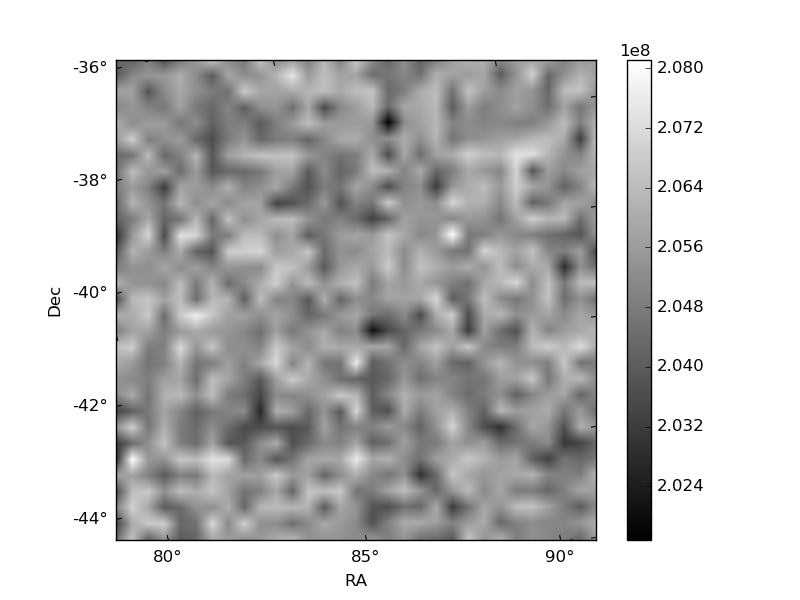
Quadrant B |
|---|---|---|---|
| Quadrant D | 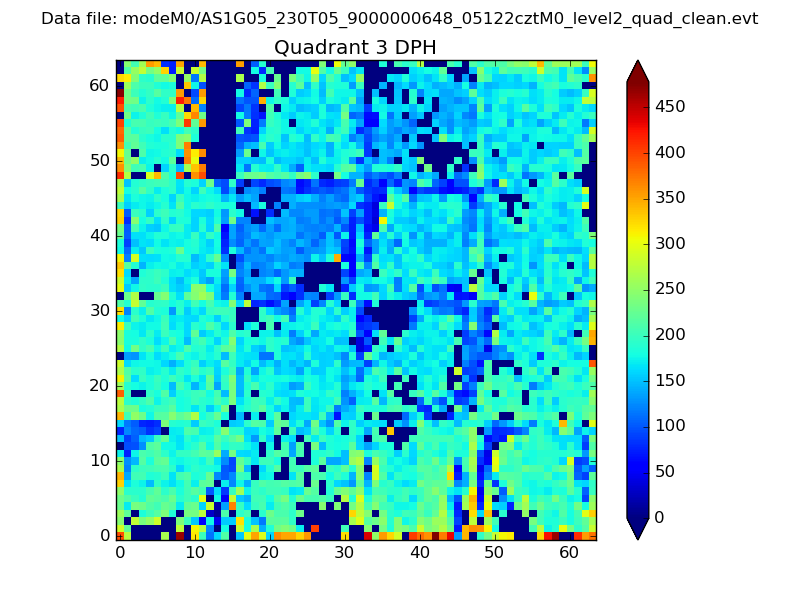 |
 |
Quadrant C |
| Plot type | Count rate plots | Images |
|---|---|---|
| Comparison with Poisson distribution Blue bars denote a histogram of data divided into 1 sec bins. Red curve is a Poisson curve with rate = median count rate of data. |
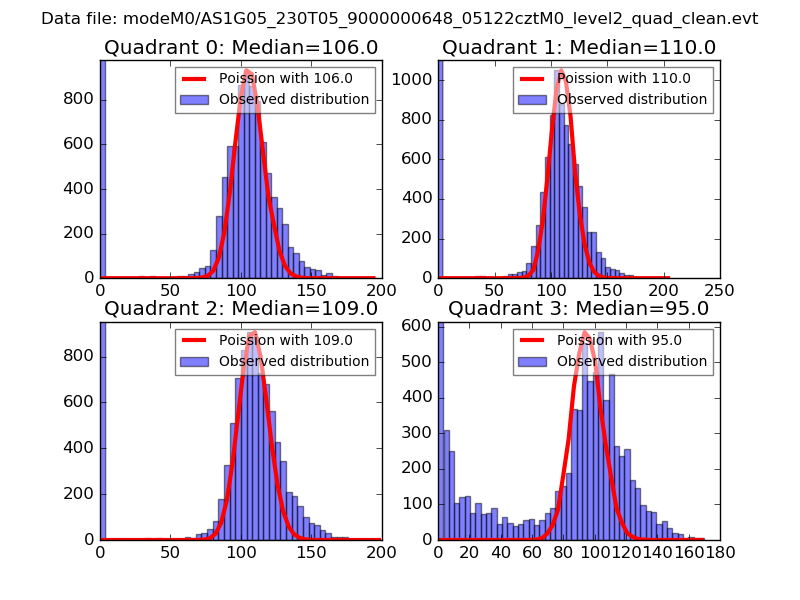 |
 |
| Quadrant-wise count rates Data is divided into 100 sec bins |
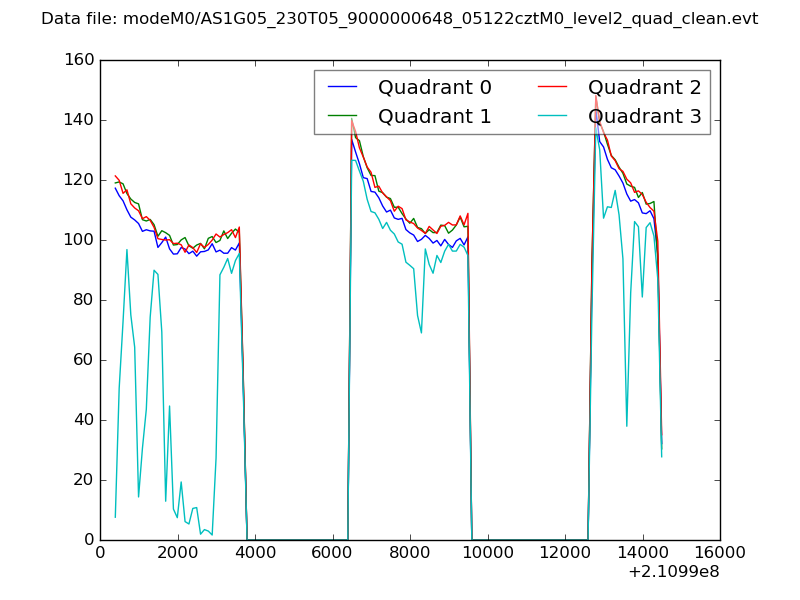 |
|
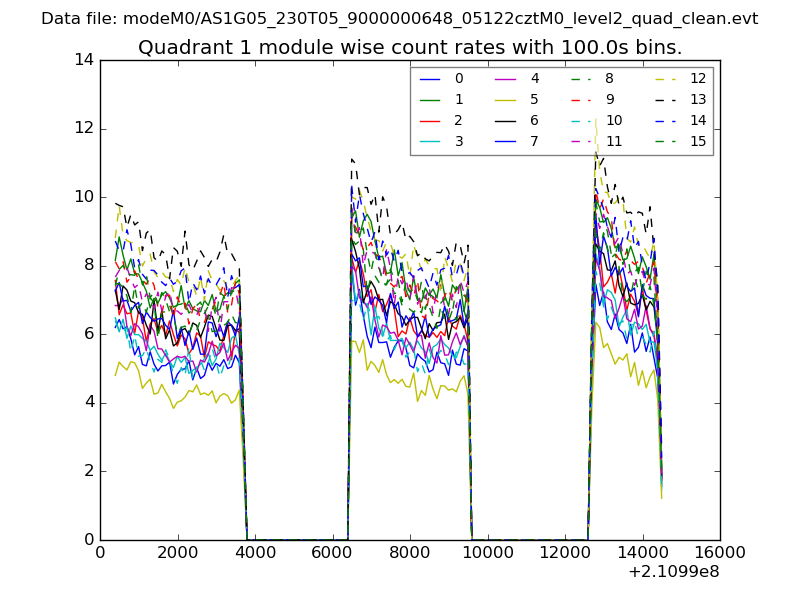
| Module-wise count rates for Quadrant A Data is divided into 100 sec bins |
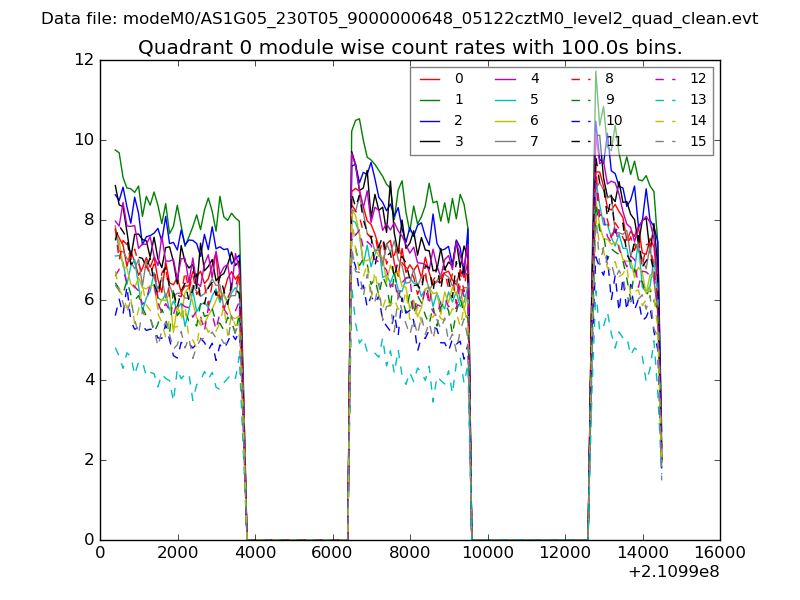 |
 |
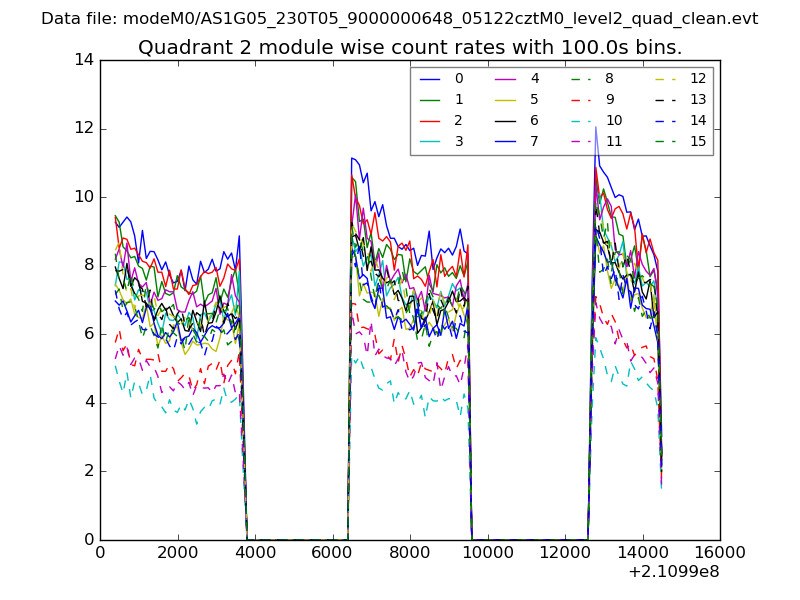
| Module-wise count rates for Quadrant B Data is divided into 100 sec bins |
 |
 |
| Module-wise count rates for Quadrant C Data is divided into 100 sec bins |
 |
 |
| Module-wise count rates for Quadrant D Data is divided into 100 sec bins |
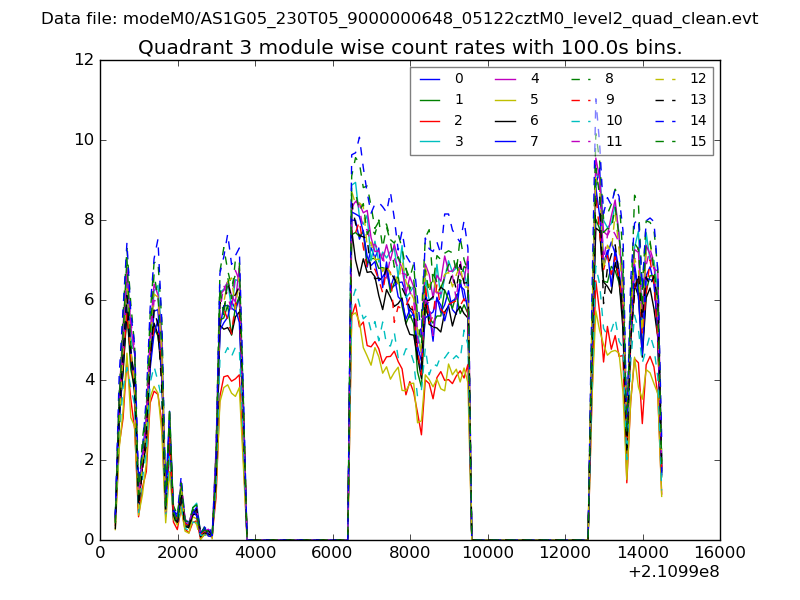 |
 |
| Parameter | Plot |
|---|---|
| CZT HV Monitor | 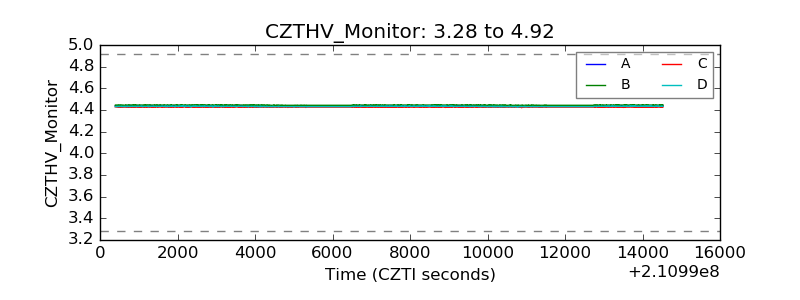 |
| D_VDD | 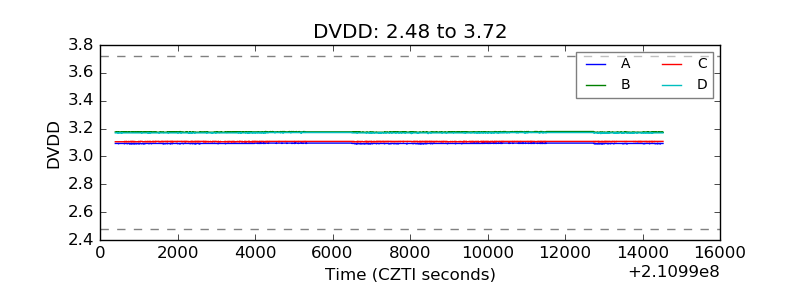 |
| Temperature 1 | 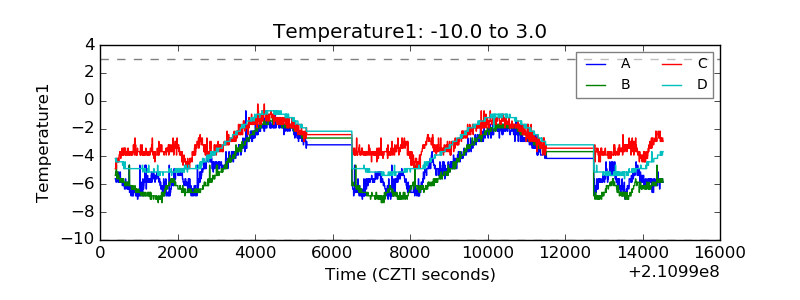 |
| Veto HV Monitor | 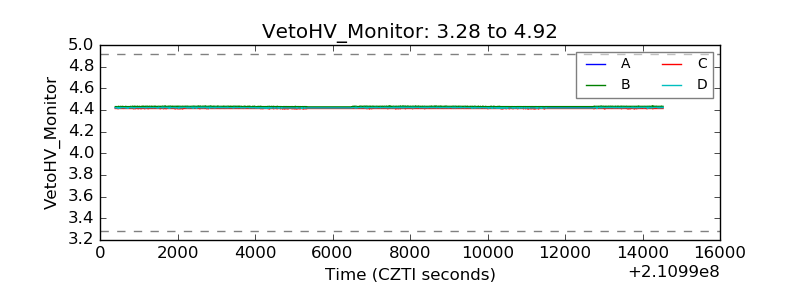 |
| Veto LLD | 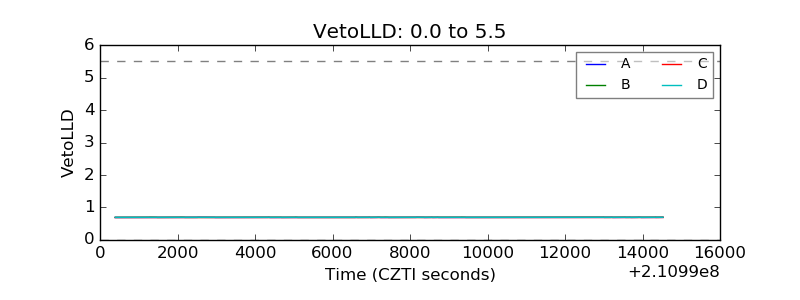 |
| Alpha Counter | 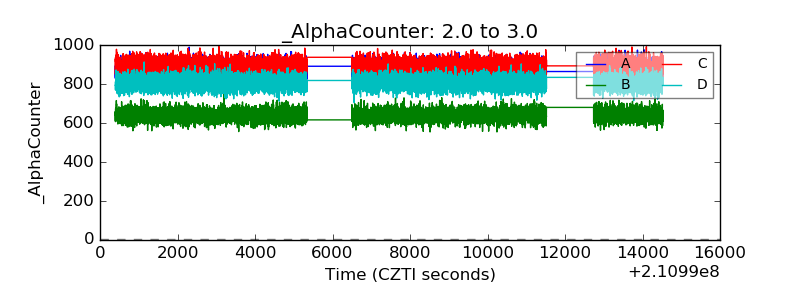 |
| _CPM_Rate | 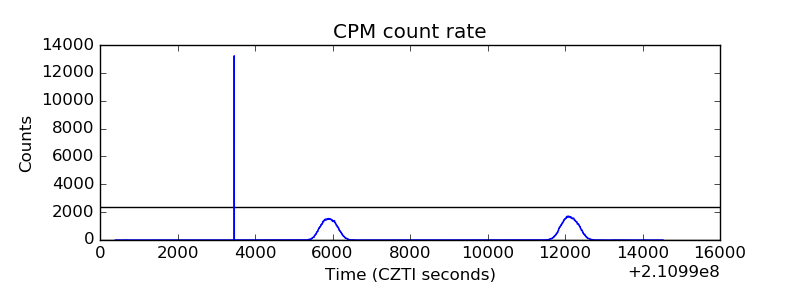 |
| CZT Counter | 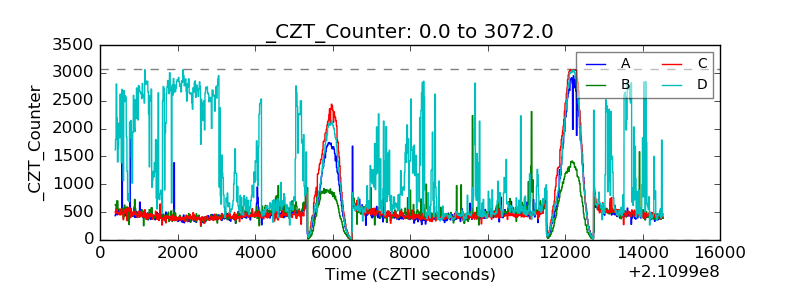 |
| +2.5 Volts monitor |  |
| +5 Volts monitor |  |
| _ROLL_ROT | 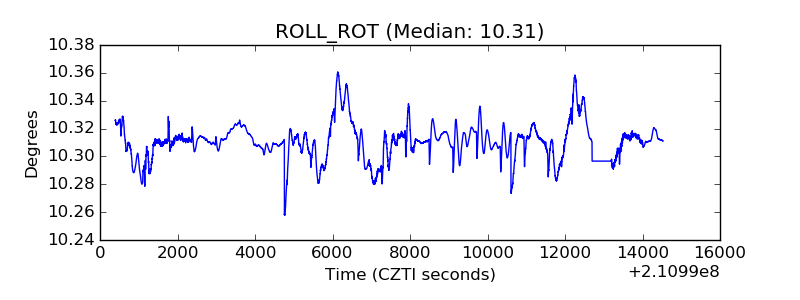 |
| _Roll_DEC | 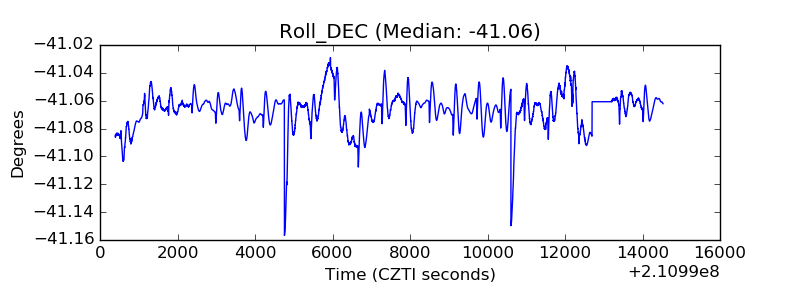 |
| _Roll_RA | 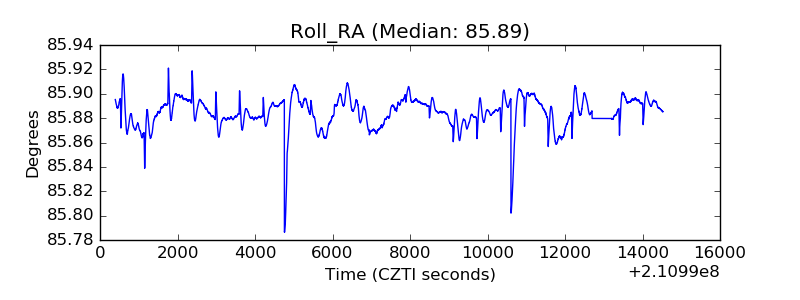 |
| Veto Counter | 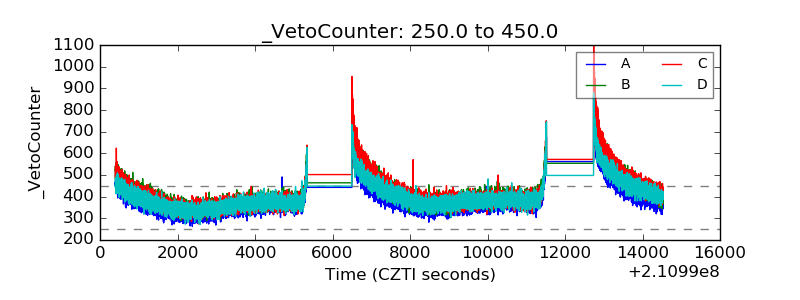 |