| Param | Original file | Final file |
|---|---|---|
| Filename | modeM0/AS1G05_230T05_9000000648_05123cztM0_level2.evt | modeM0/AS1G05_230T05_9000000648_05123cztM0_level2_quad_clean.evt |
| Size (bytes) | 528,431,040 | 72,936,000 |
| Size | 504.0 MB | 69.6 MB |
| Events in quadrant A | 2,826,183 | 466,315 |
| Events in quadrant B | 3,239,932 | 481,086 |
| Events in quadrant C | 2,868,696 | 482,401 |
| Events in quadrant D | 6,653,546 | 350,999 |
| Mode SS | |||
|---|---|---|---|
| Quadrant | BADHDUFLAG | Total packets | Discarded packets |
| A | 0 | 124 | 0 |
| B | 0 | 124 | 0 |
| C | 0 | 124 | 0 |
| D | 0 | 124 | 0 |
| Mode M0 | |||
|---|---|---|---|
| Quadrant | BADHDUFLAG | Total packets | Discarded packets |
| A | 0 | 12485 | 2 |
| B | 0 | 13498 | 1 |
| C | 0 | 12522 | 1 |
| D | 0 | 23807 | 1 |
| Mode M9 | |||
|---|---|---|---|
| Quadrant | BADHDUFLAG | Total packets | Discarded packets |
| A | 0 | 13 | 0 |
| B | 0 | 13 | 0 |
| C | 0 | 13 | 0 |
| D | 0 | 13 | 0 |
| Quadrant | Total seconds | Saturated seconds | Saturation percentage |
|---|---|---|---|
| A | 6117 | 18 | 0.294262% |
| B | 6117 | 81 | 1.324179% |
| C | 6117 | 22 | 0.359653% |
| D | 6117 | 1386 | 22.658166% |
Noise dominated data is calculated using 1-second bins in cleaned event files. If a bin has >2000 counts, and if more than 50% of those come from <1% of pixels, then it is considered to be noise-dominated and hence unusable.
| Quadrant | # 1 sec bins | Bins with >0 counts | Bins with >2000 counts | High rate bins dominated by noise | Noise dominated (total time) | Noise dominated (detector-on time) | Marked lightcurve |
|---|---|---|---|---|---|---|---|
| A | 7392 | 6118 | 1 | 1 | 0.01% | 0.02% | 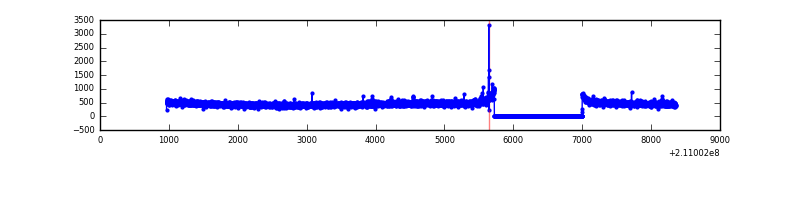 |
| B | 7392 | 6118 | 27 | 27 | 0.37% | 0.44% | 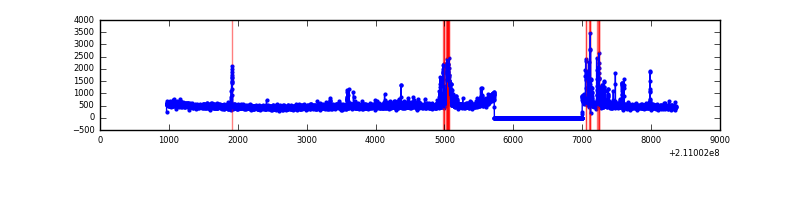 |
| C | 7392 | 6118 | 0 | 0 | 0.00% | 0.00% | 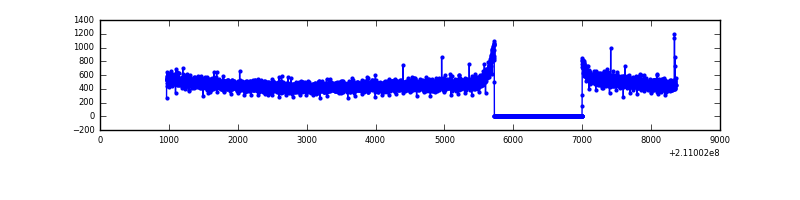 |
| D | 7391 | 6117 | 1166 | 1166 | 15.78% | 19.06% | 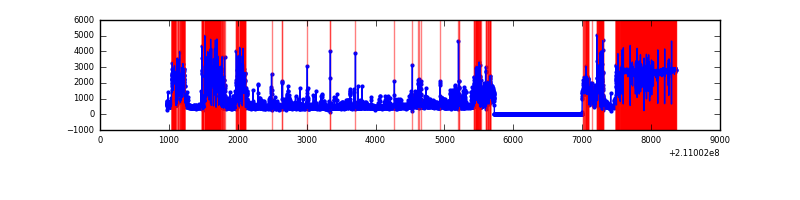 |
Top three noisy pixels from each quadrant. If the there are fewer than three noisy pixels in the level2.evt file, extra rows are filled as -1
| Pixel properties | Quadrant properties | ||||||
|---|---|---|---|---|---|---|---|
| Quadrant | DetID | PixID | Counts | Sigma | Mean | Median | Sigma |
| A | 0 | 50 | 13111 | 83.22 | 730 | 715 | 149.0 |
| A | 12 | 194 | 7447 | 45.2 | 730 | 715 | 149.0 |
| A | 0 | 226 | 7197 | 43.52 | 730 | 715 | 149.0 |
| B | 8 | 3 | 170668 | 1221.47 | 740 | 724 | 139.1 |
| B | 4 | 48 | 102331 | 730.3 | 740 | 724 | 139.1 |
| B | 15 | 204 | 55011 | 390.19 | 740 | 724 | 139.1 |
| C | 12 | 4 | 8684 | 47.07 | 731 | 736 | 168.8 |
| C | 13 | 61 | 6012 | 31.25 | 731 | 736 | 168.8 |
| C | 1 | 16 | 2859 | 12.57 | 731 | 736 | 168.8 |
| D | 12 | 22 | 2223157 | 14520.22 | 629 | 610 | 153.1 |
| D | 13 | 239 | 1023528 | 6682.87 | 629 | 610 | 153.1 |
| D | 13 | 235 | 409845 | 2673.59 | 629 | 610 | 153.1 |
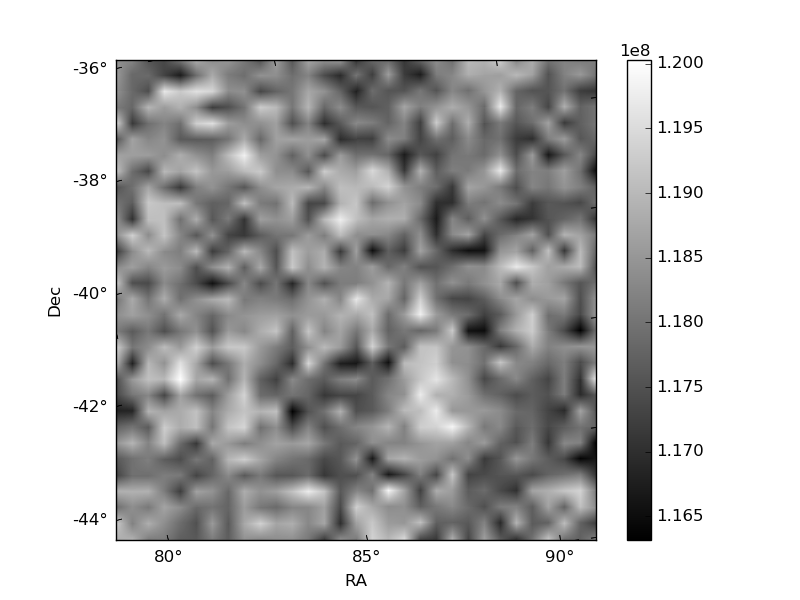
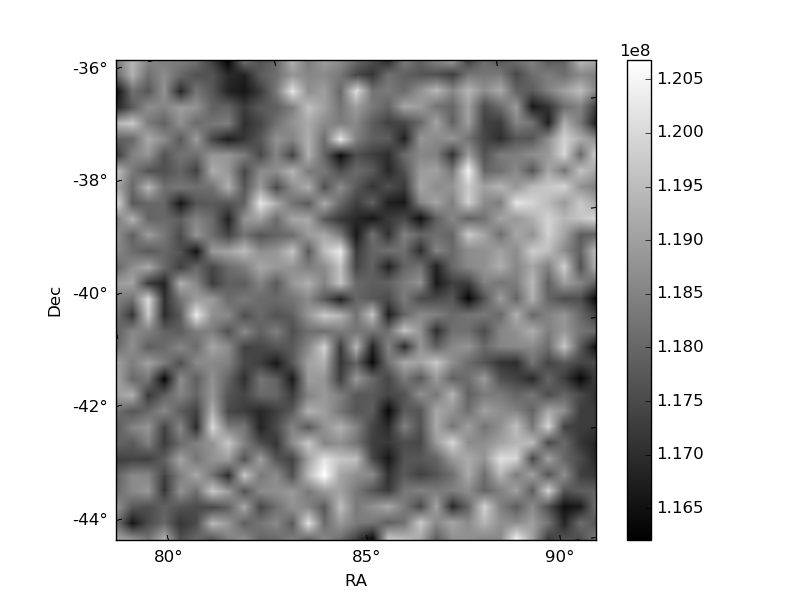
Histogram calculated using DETX and DETY for each event in the final _common_clean file
| Quadrant A | 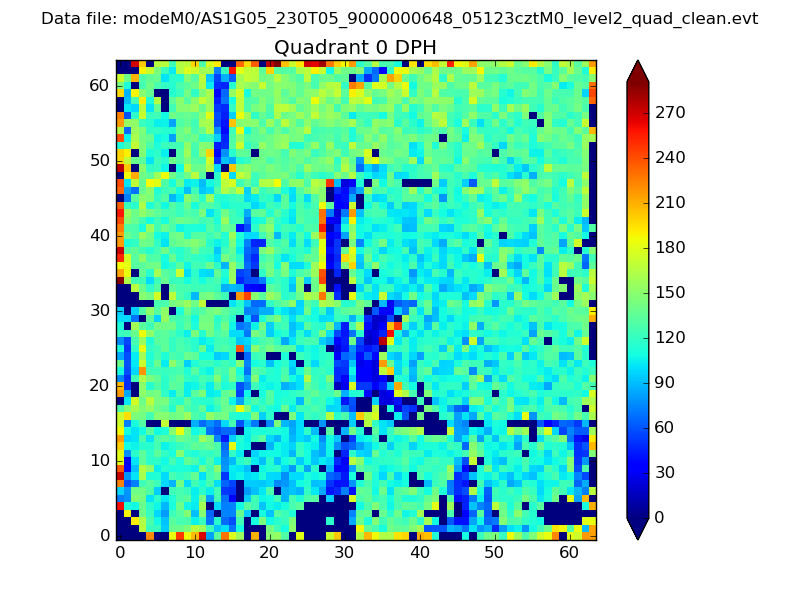 |
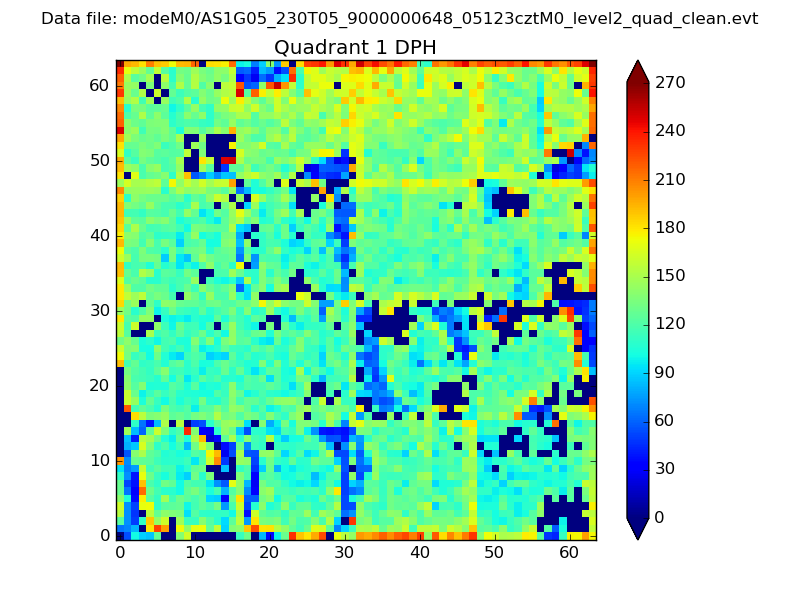 |
Quadrant B |
|---|---|---|---|
| Quadrant D | 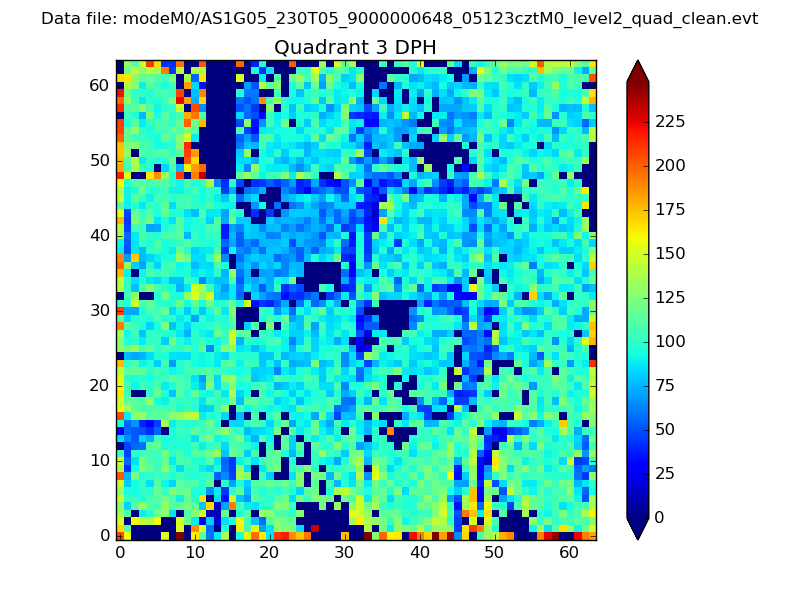 |
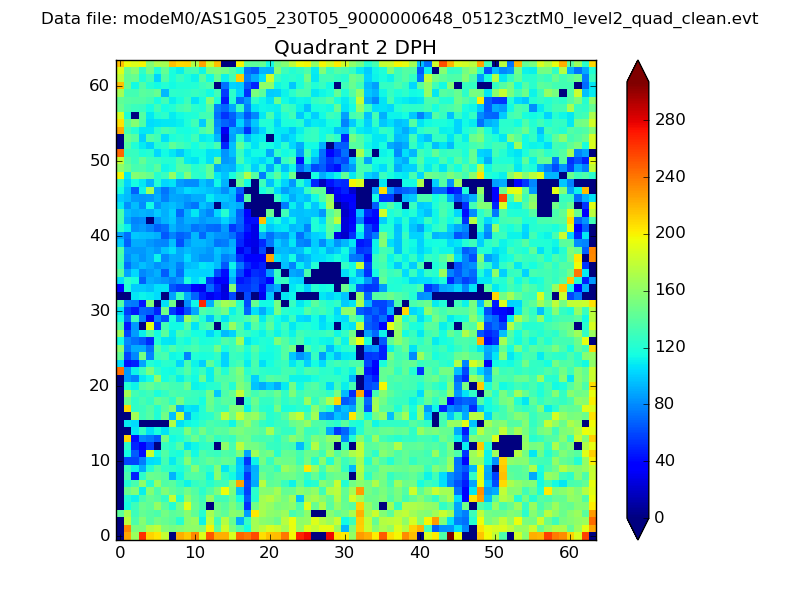 |
Quadrant C |
| Plot type | Count rate plots | Images |
|---|---|---|
| Comparison with Poisson distribution Blue bars denote a histogram of data divided into 1 sec bins. Red curve is a Poisson curve with rate = median count rate of data. |
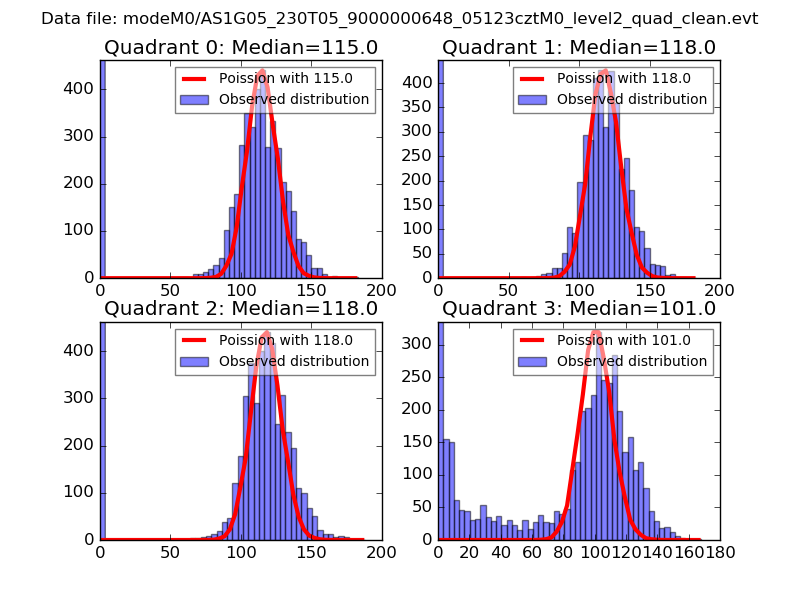 |
 |
| Quadrant-wise count rates Data is divided into 100 sec bins |
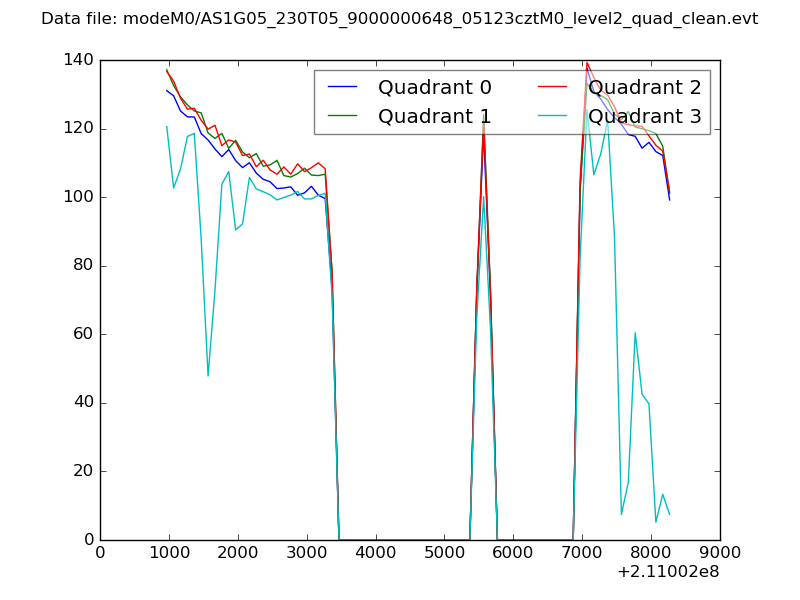 |
|
| Module-wise count rates for Quadrant A Data is divided into 100 sec bins |
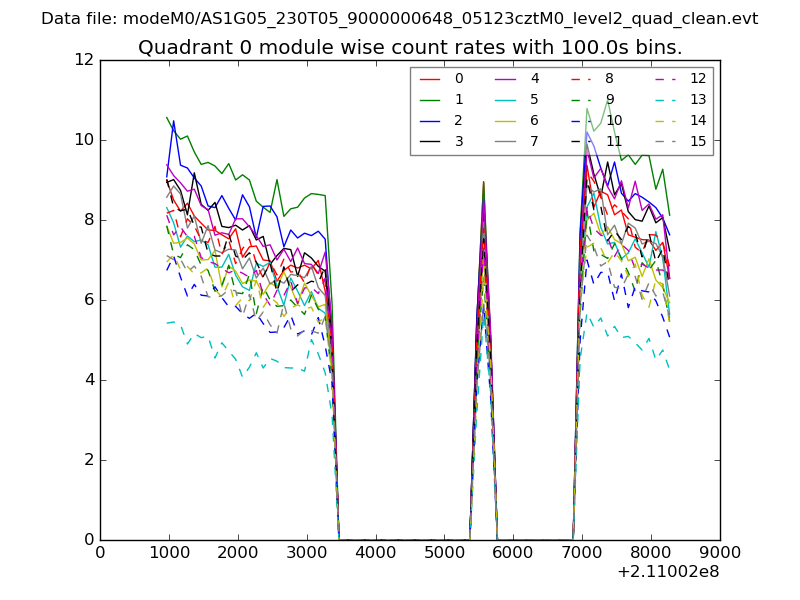 |
 |
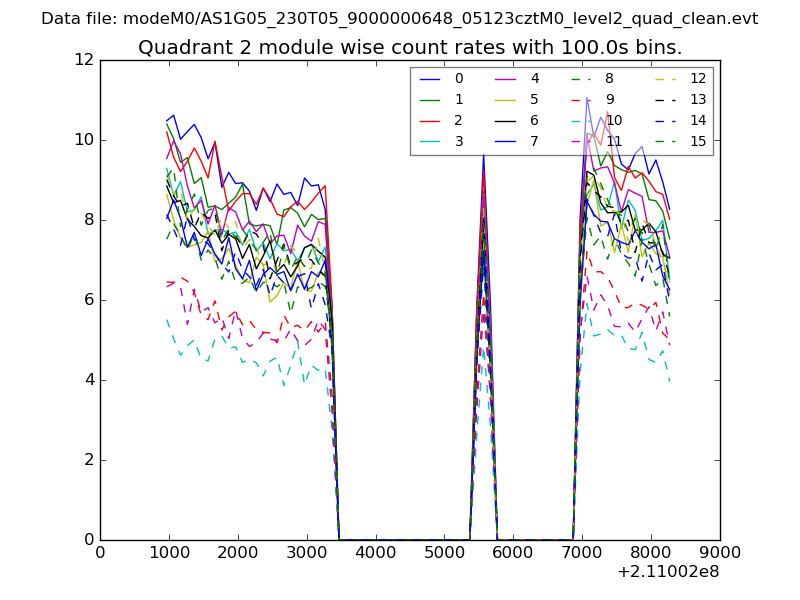
| Module-wise count rates for Quadrant B Data is divided into 100 sec bins |
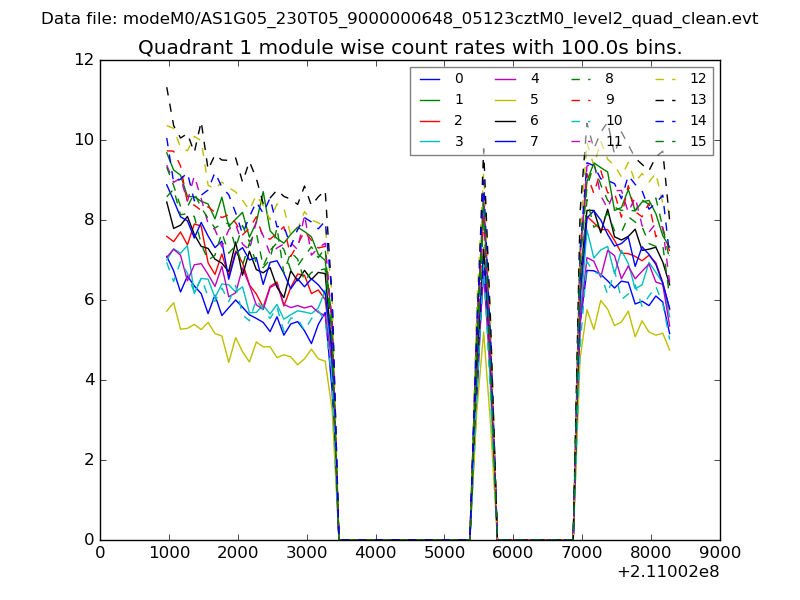 |
 |
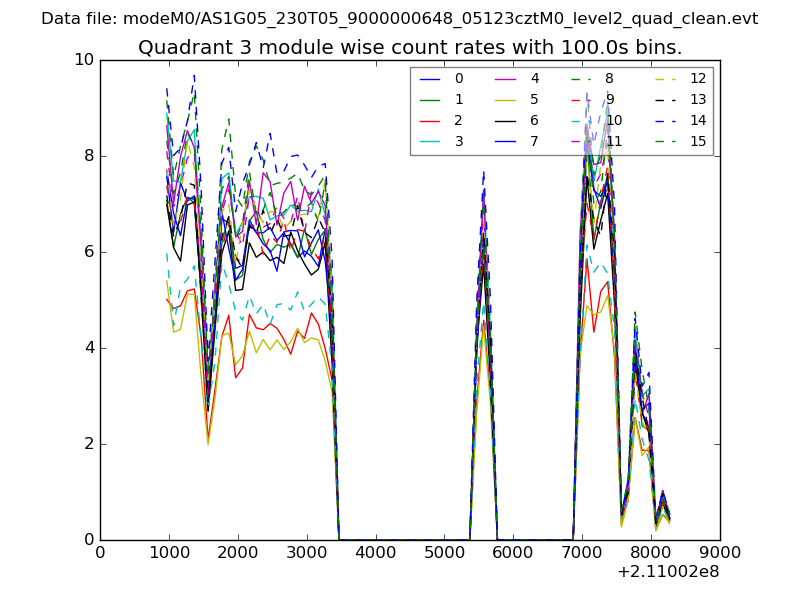
| Module-wise count rates for Quadrant C Data is divided into 100 sec bins |
 |
 |
| Module-wise count rates for Quadrant D Data is divided into 100 sec bins |
 |
 |
| Parameter | Plot |
|---|---|
| CZT HV Monitor | 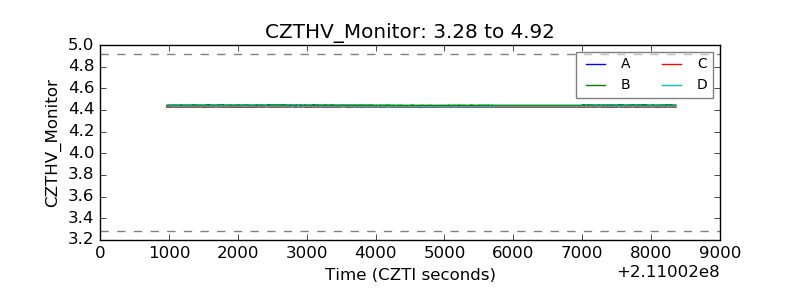 |
| D_VDD |  |
| Temperature 1 | 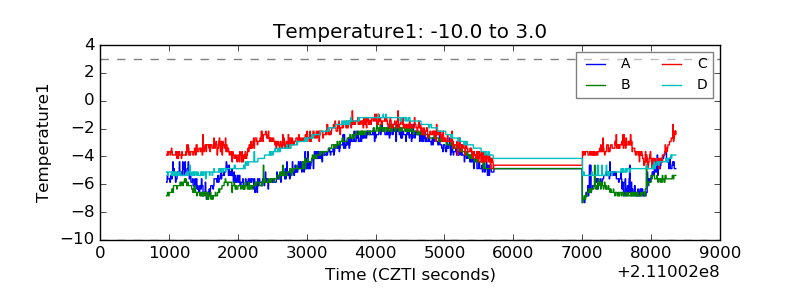 |
| Veto HV Monitor | 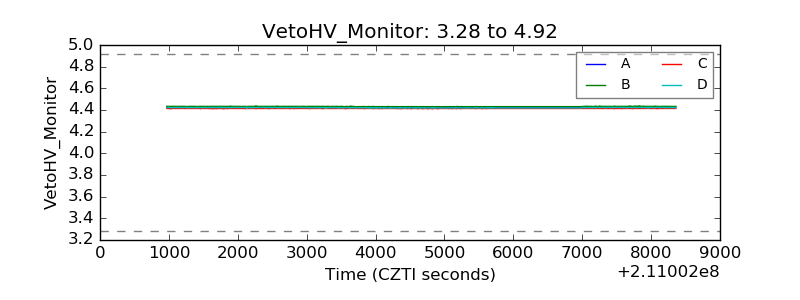 |
| Veto LLD | 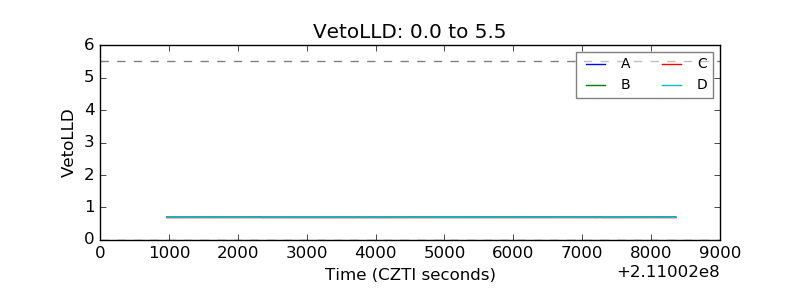 |
| Alpha Counter | 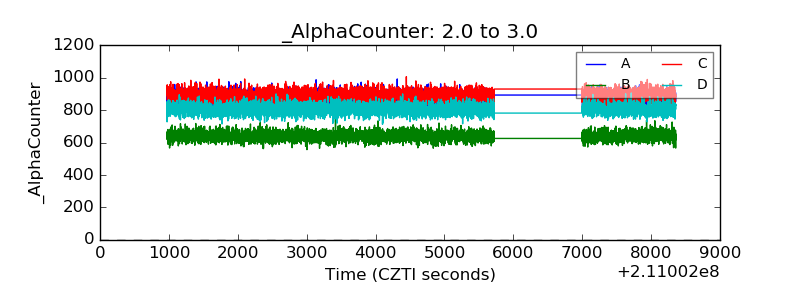 |
| _CPM_Rate | 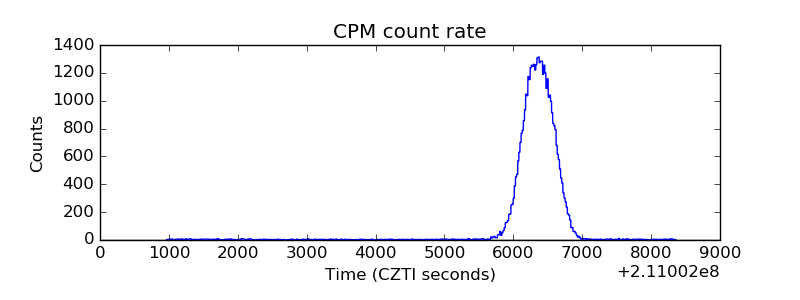 |
| CZT Counter | 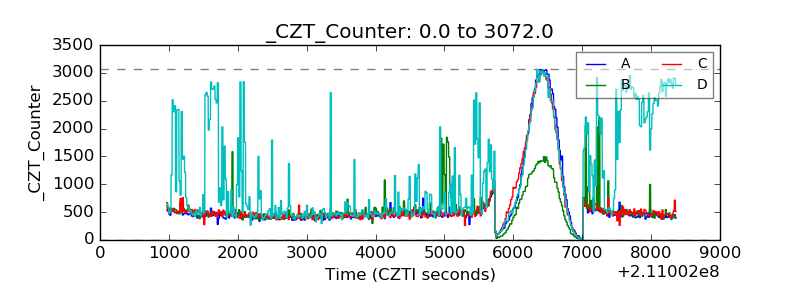 |
| +2.5 Volts monitor |  |
| +5 Volts monitor |  |
| _ROLL_ROT | 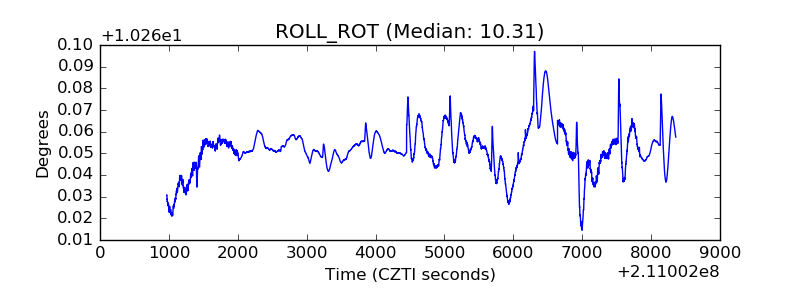 |
| _Roll_DEC | 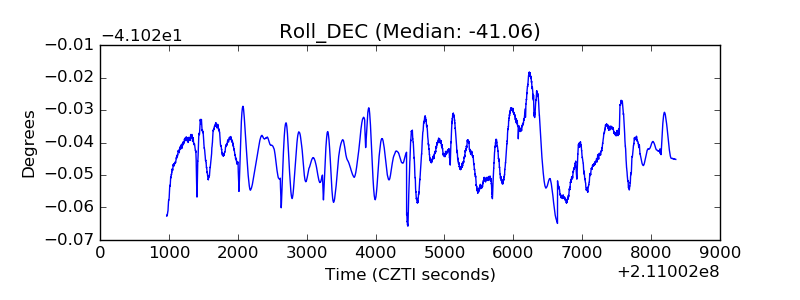 |
| _Roll_RA | 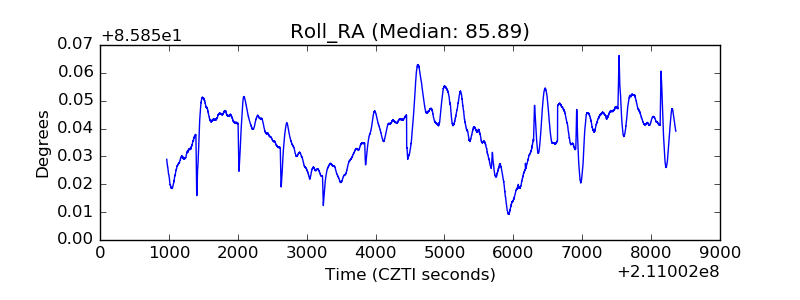 |
| Veto Counter | 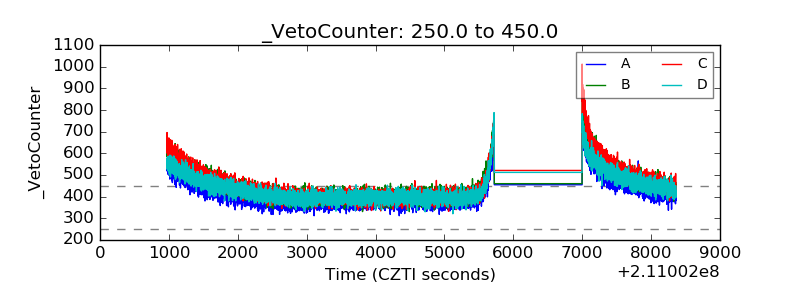 |