| Param | Original file | Final file |
|---|---|---|
| Filename | modeM0/AS1G05_230T05_9000000648_05125cztM0_level2.evt | modeM0/AS1G05_230T05_9000000648_05125cztM0_level2_quad_clean.evt |
| Size (bytes) | 433,471,680 | 74,897,280 |
| Size | 413.4 MB | 71.4 MB |
| Events in quadrant A | 2,927,410 | 459,175 |
| Events in quadrant B | 3,888,204 | 464,219 |
| Events in quadrant C | 2,880,946 | 468,477 |
| Events in quadrant D | 3,008,006 | 441,695 |
| Mode SS | |||
|---|---|---|---|
| Quadrant | BADHDUFLAG | Total packets | Discarded packets |
| A | 0 | 126 | 0 |
| B | 0 | 126 | 0 |
| C | 0 | 126 | 0 |
| D | 0 | 126 | 0 |
| Mode M0 | |||
|---|---|---|---|
| Quadrant | BADHDUFLAG | Total packets | Discarded packets |
| A | 0 | 12880 | 10 |
| B | 0 | 15638 | 5 |
| C | 0 | 12824 | 1 |
| D | 0 | 13323 | 3 |
| Mode M9 | |||
|---|---|---|---|
| Quadrant | BADHDUFLAG | Total packets | Discarded packets |
| A | 0 | 11 | 0 |
| B | 0 | 11 | 0 |
| C | 0 | 11 | 0 |
| D | 0 | 11 | 0 |
| Quadrant | Total seconds | Saturated seconds | Saturation percentage |
|---|---|---|---|
| A | 6220 | 115 | 1.848875% |
| B | 6222 | 277 | 4.451945% |
| C | 6224 | 99 | 1.590617% |
| D | 6223 | 125 | 2.008677% |
Noise dominated data is calculated using 1-second bins in cleaned event files. If a bin has >2000 counts, and if more than 50% of those come from <1% of pixels, then it is considered to be noise-dominated and hence unusable.
| Quadrant | # 1 sec bins | Bins with >0 counts | Bins with >2000 counts | High rate bins dominated by noise | Noise dominated (total time) | Noise dominated (detector-on time) | Marked lightcurve |
|---|---|---|---|---|---|---|---|
| A | 7299 | 6225 | 0 | 0 | 0.00% | 0.00% | 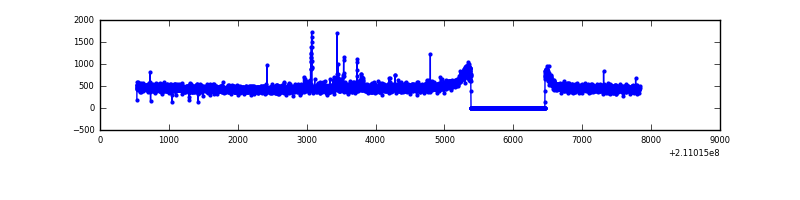 |
| B | 7299 | 6225 | 136 | 136 | 1.86% | 2.18% | 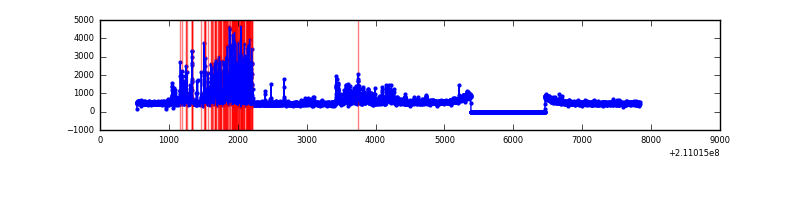 |
| C | 7299 | 6225 | 0 | 0 | 0.00% | 0.00% | 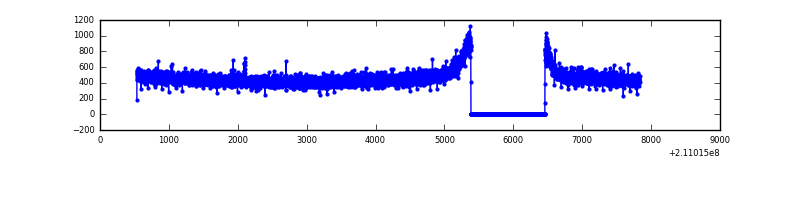 |
| D | 7299 | 6225 | 29 | 29 | 0.40% | 0.47% | 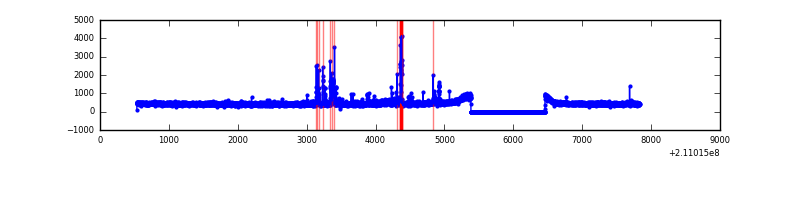 |
Top three noisy pixels from each quadrant. If the there are fewer than three noisy pixels in the level2.evt file, extra rows are filled as -1
| Pixel properties | Quadrant properties | ||||||
|---|---|---|---|---|---|---|---|
| Quadrant | DetID | PixID | Counts | Sigma | Mean | Median | Sigma |
| A | 0 | 50 | 37889 | 244.38 | 745 | 728 | 152.1 |
| A | 5 | 112 | 17392 | 109.59 | 745 | 728 | 152.1 |
| A | 12 | 194 | 7553 | 44.88 | 745 | 728 | 152.1 |
| B | 4 | 48 | 648237 | 4559.86 | 742 | 723 | 142.0 |
| B | 15 | 204 | 255125 | 1791.52 | 742 | 723 | 142.0 |
| B | 8 | 3 | 87627 | 611.99 | 742 | 723 | 142.0 |
| C | 1 | 16 | 15024 | 83.75 | 733 | 736 | 170.6 |
| C | 13 | 61 | 5945 | 30.53 | 733 | 736 | 170.6 |
| C | 14 | 225 | 3556 | 16.53 | 733 | 736 | 170.6 |
| D | 2 | 33 | 182421 | 1002.79 | 736 | 712 | 181.2 |
| D | 2 | 14 | 24802 | 132.94 | 736 | 712 | 181.2 |
| D | 12 | 110 | 12635 | 65.8 | 736 | 712 | 181.2 |
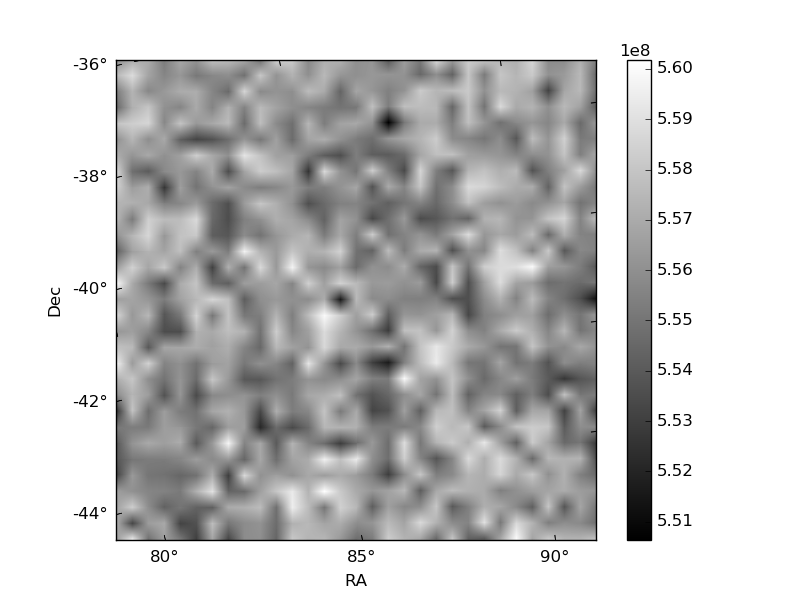
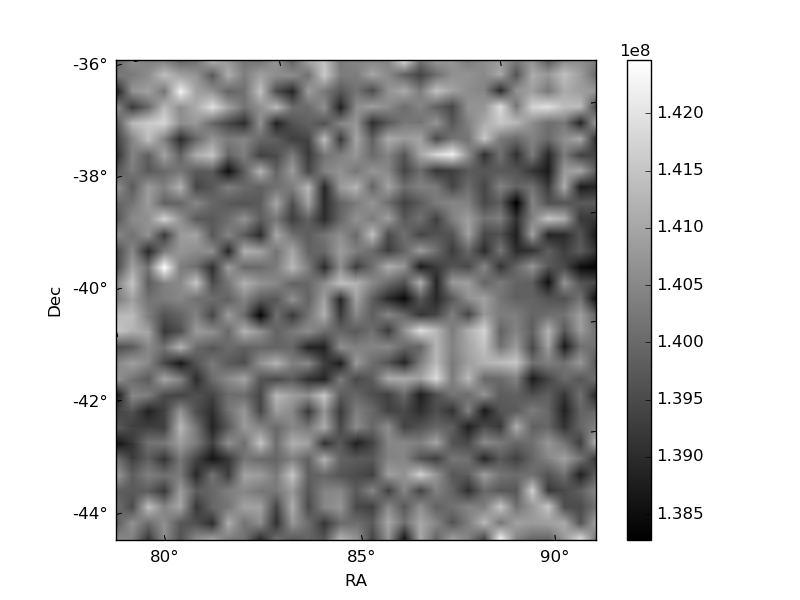
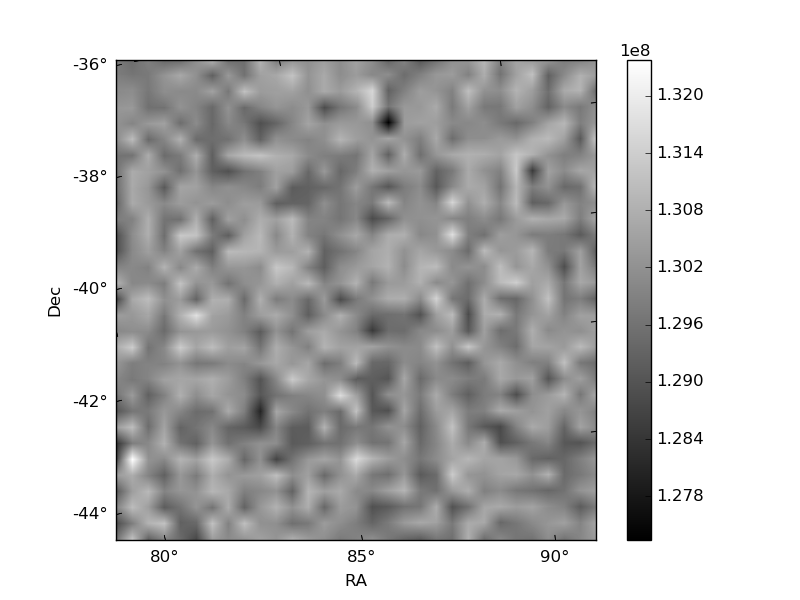
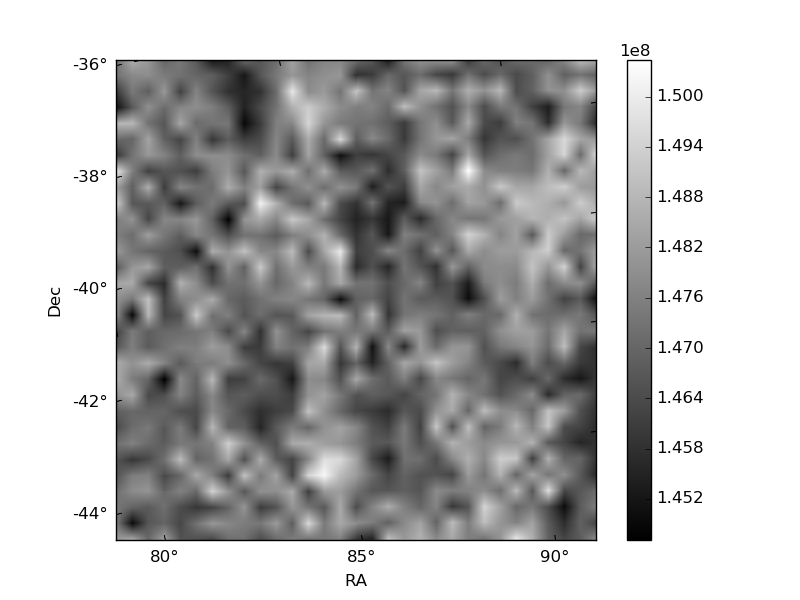
Histogram calculated using DETX and DETY for each event in the final _common_clean file
| Quadrant A | 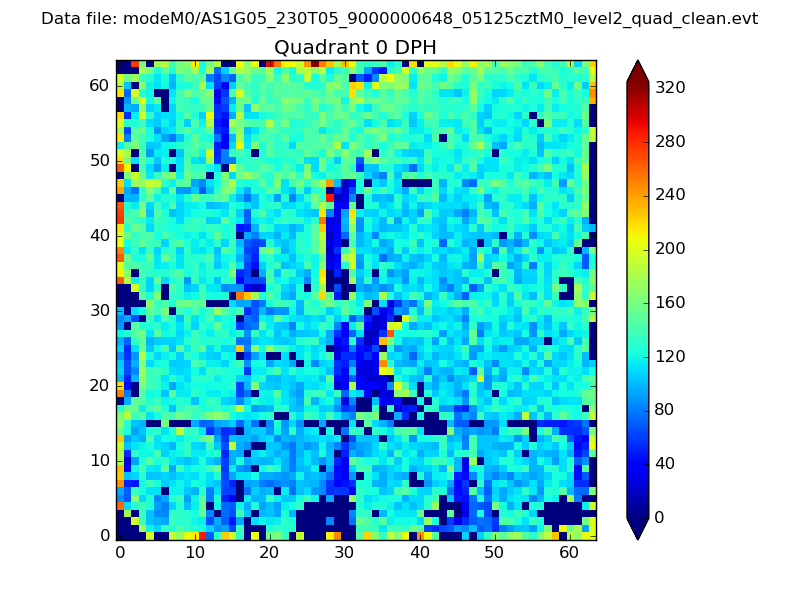 |
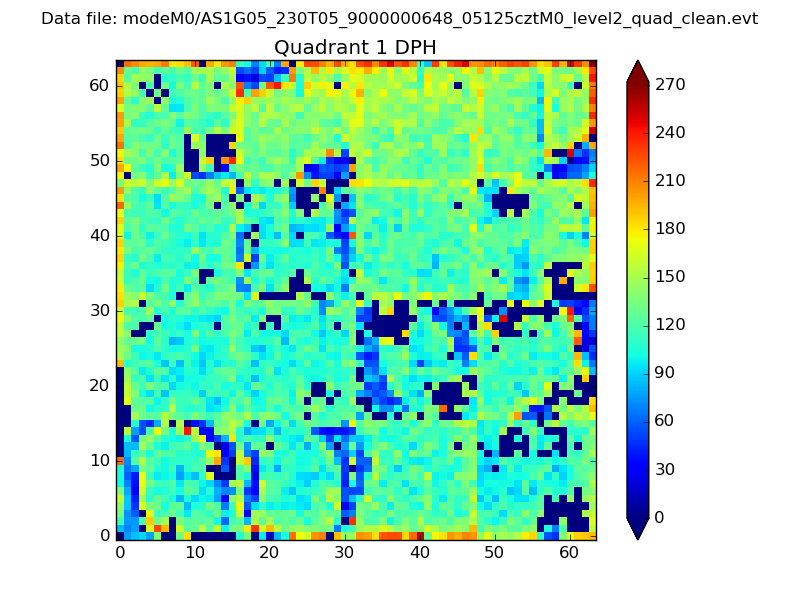 |
Quadrant B |
|---|---|---|---|
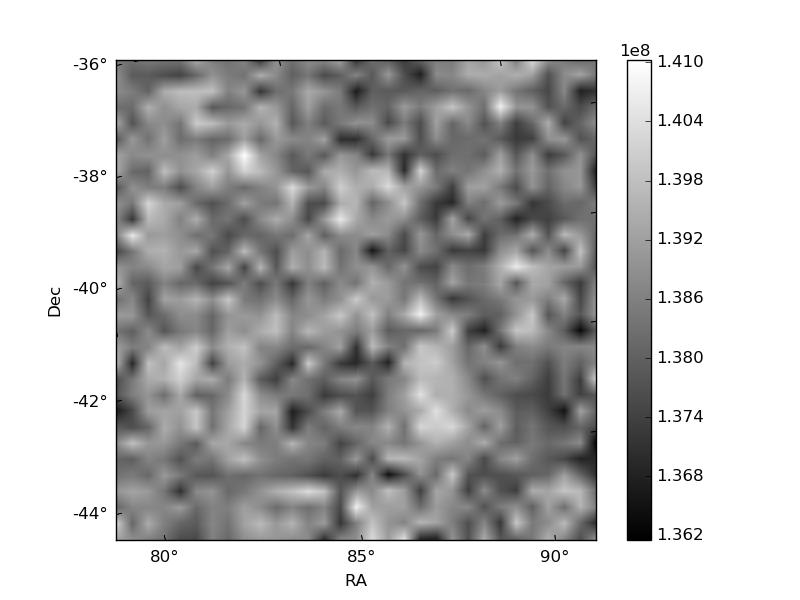
| Quadrant D | 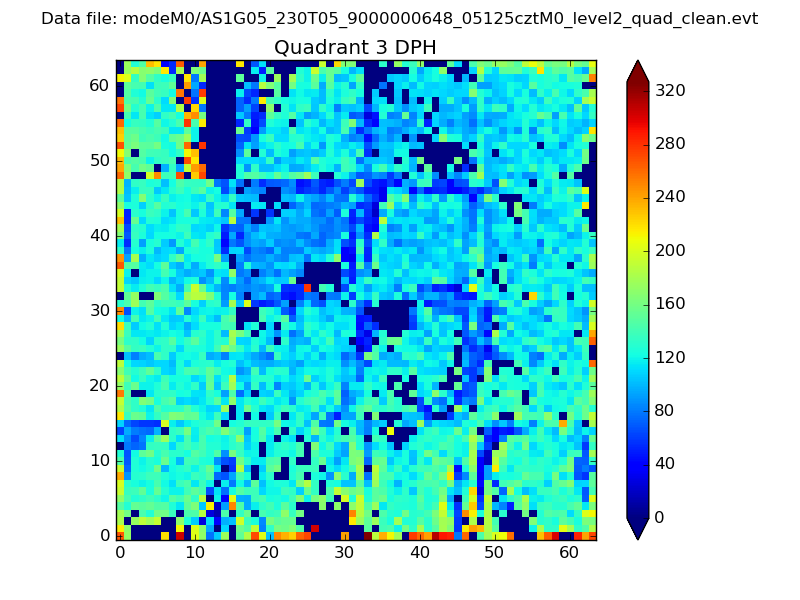 |
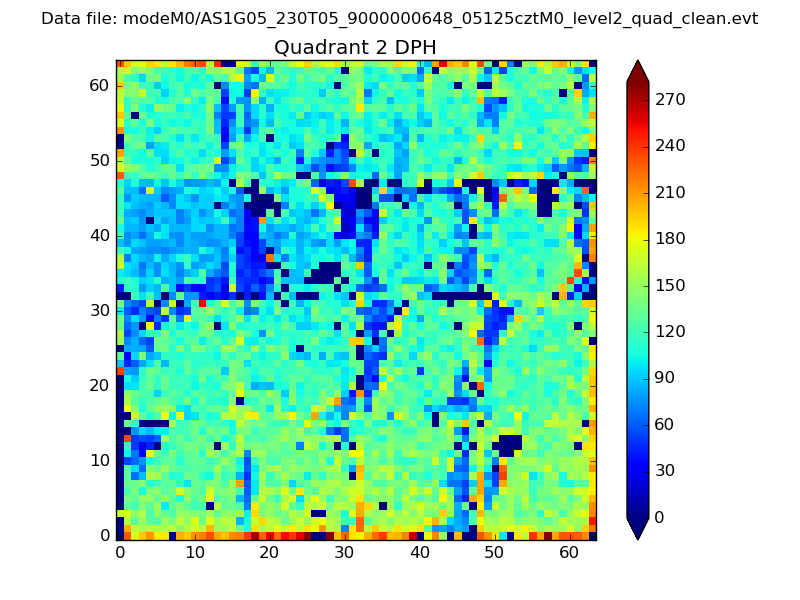 |
Quadrant C |
| Plot type | Count rate plots | Images |
|---|---|---|
| Comparison with Poisson distribution Blue bars denote a histogram of data divided into 1 sec bins. Red curve is a Poisson curve with rate = median count rate of data. |
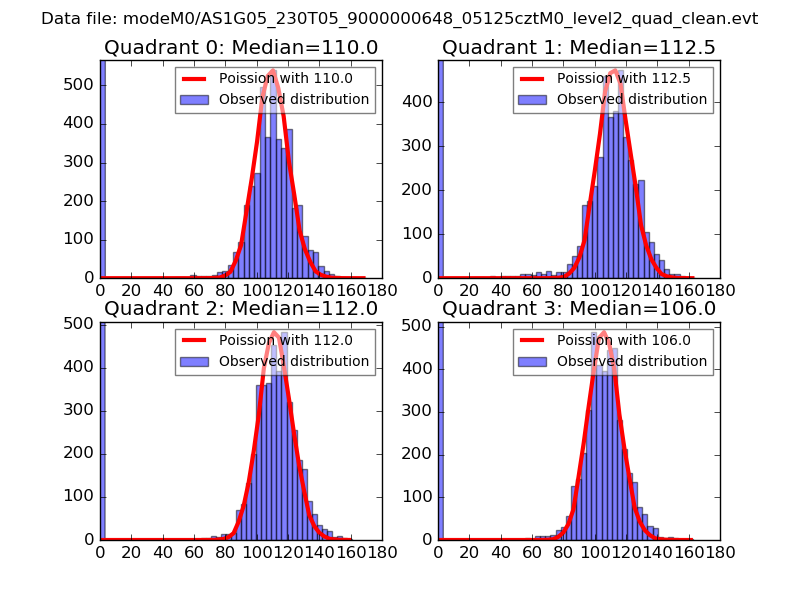 |
 |
| Quadrant-wise count rates Data is divided into 100 sec bins |
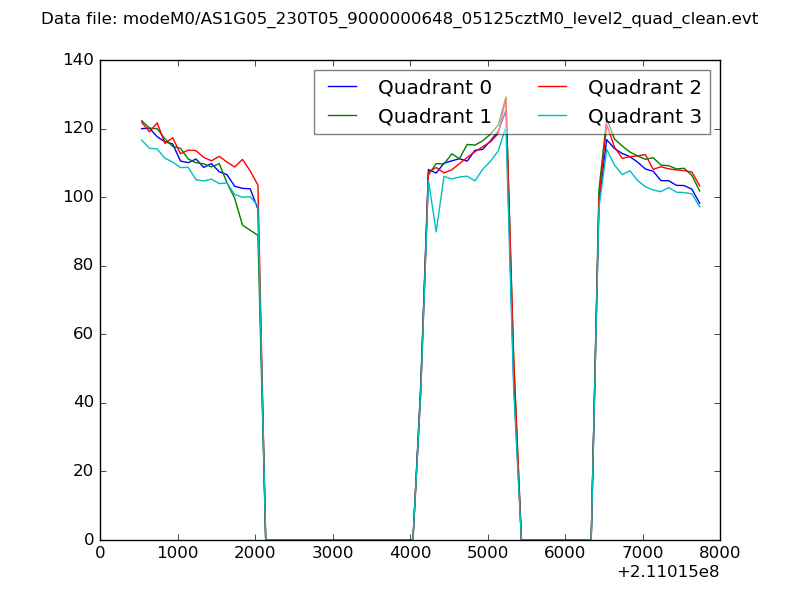 |
|
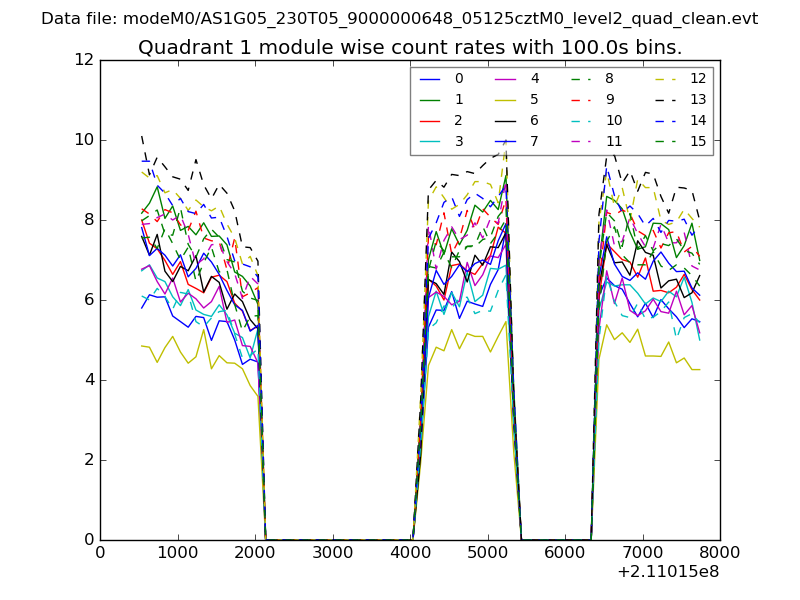
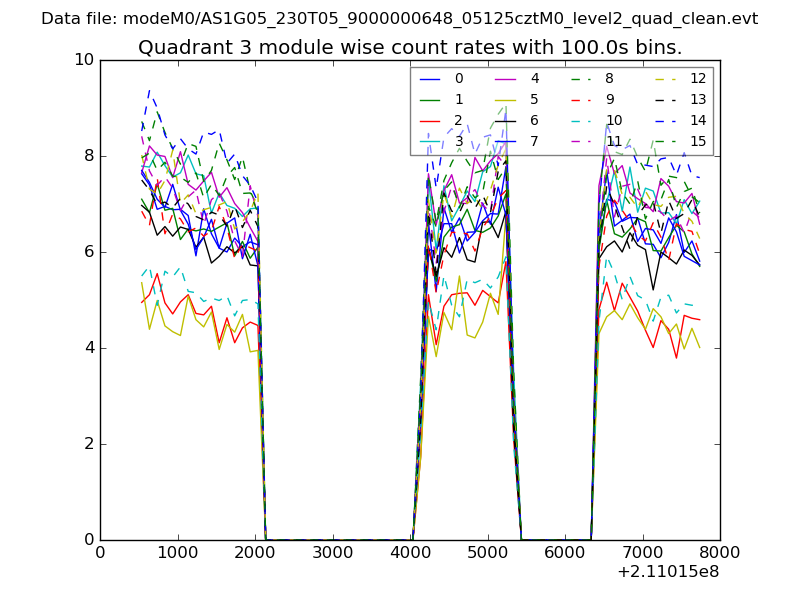
| Module-wise count rates for Quadrant A Data is divided into 100 sec bins |
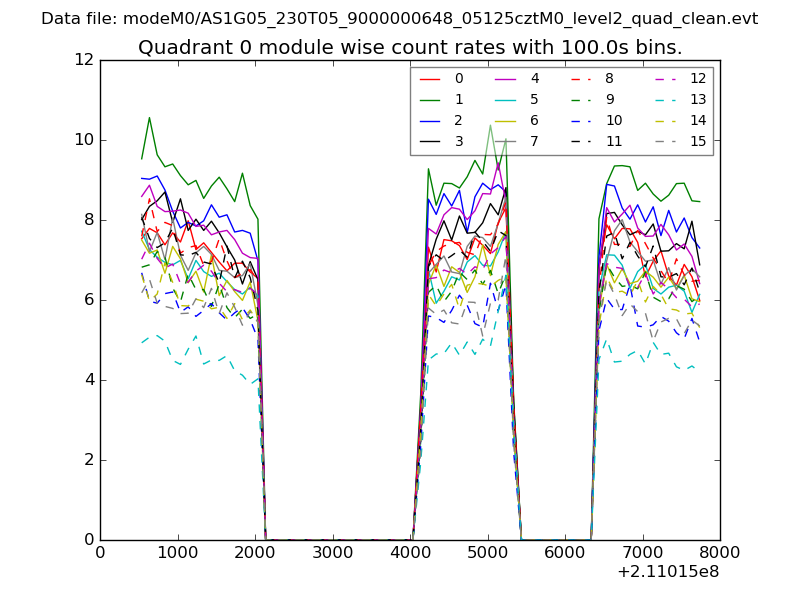 |
 |
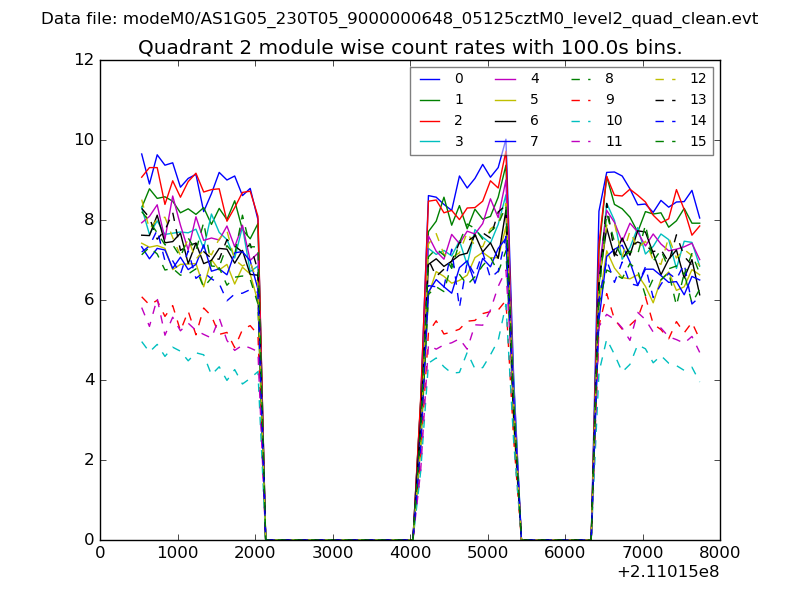
| Module-wise count rates for Quadrant B Data is divided into 100 sec bins |
 |
 |
| Module-wise count rates for Quadrant C Data is divided into 100 sec bins |
 |
 |
| Module-wise count rates for Quadrant D Data is divided into 100 sec bins |
 |
 |
| Parameter | Plot |
|---|---|
| CZT HV Monitor | 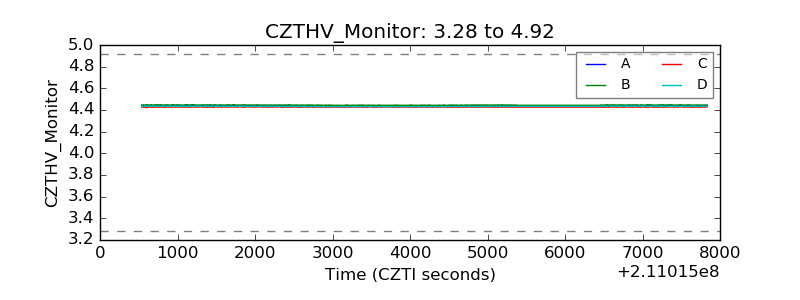 |
| D_VDD | 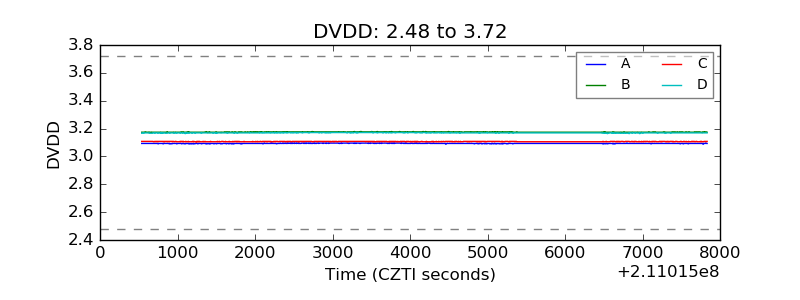 |
| Temperature 1 | 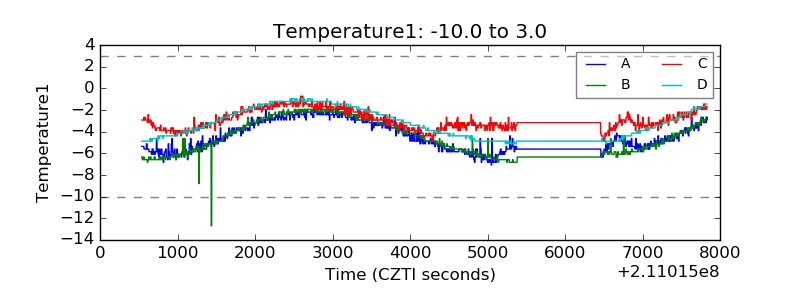 |
| Veto HV Monitor | 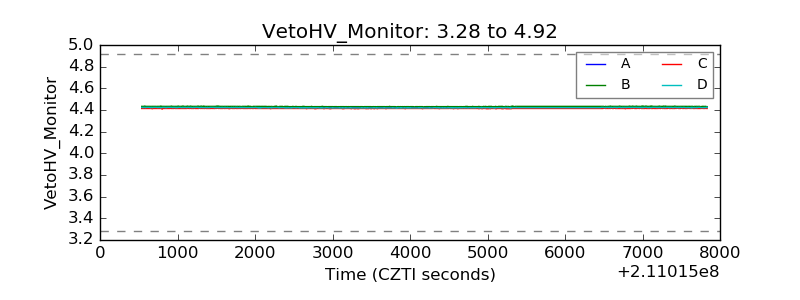 |
| Veto LLD | 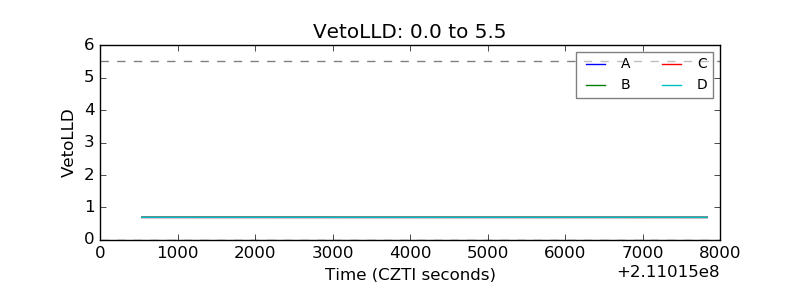 |
| Alpha Counter | 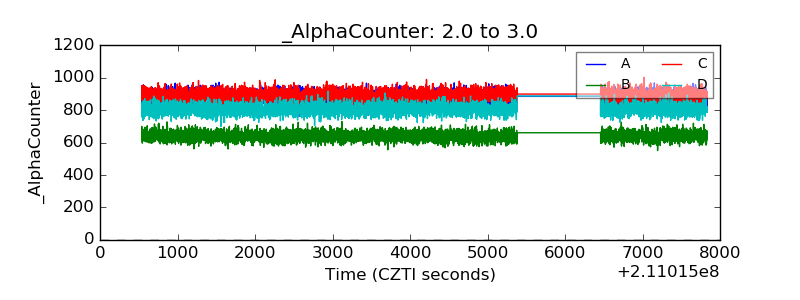 |
| _CPM_Rate |  |
| CZT Counter | 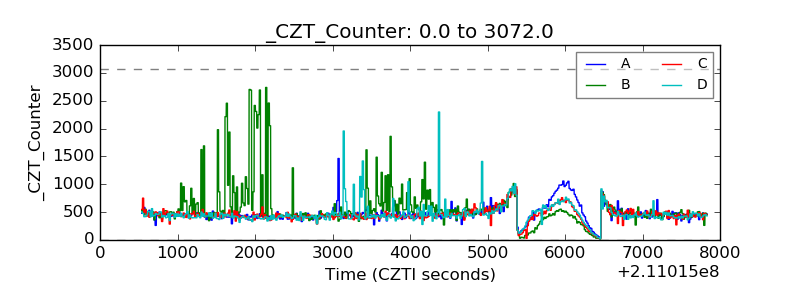 |
| +2.5 Volts monitor |  |
| +5 Volts monitor |  |
| _ROLL_ROT | 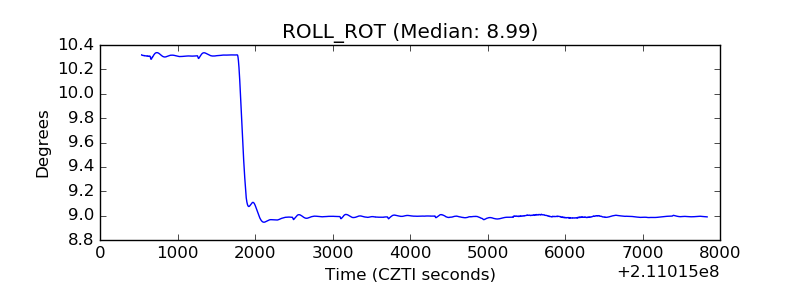 |
| _Roll_DEC |  |
| _Roll_RA | 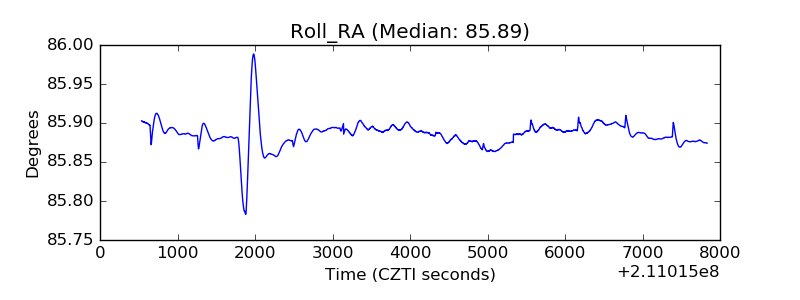 |
| Veto Counter | 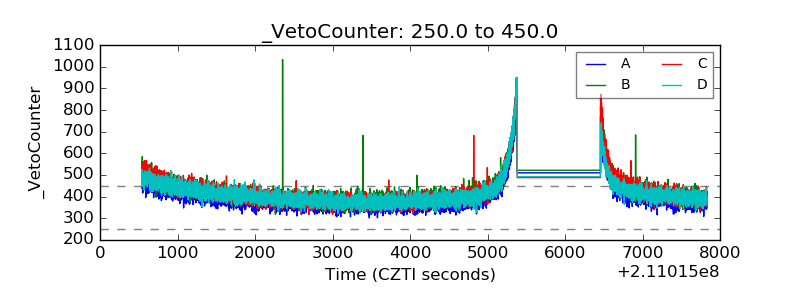 |