| Param | Original file | Final file |
|---|---|---|
| Filename | modeM0/AS1G05_230T05_9000000648_05127cztM0_level2.evt | modeM0/AS1G05_230T05_9000000648_05127cztM0_level2_quad_clean.evt |
| Size (bytes) | 524,226,240 | 76,849,920 |
| Size | 499.9 MB | 73.3 MB |
| Events in quadrant A | 3,461,626 | 451,713 |
| Events in quadrant B | 4,410,781 | 460,142 |
| Events in quadrant C | 3,338,400 | 460,608 |
| Events in quadrant D | 4,158,459 | 435,008 |
| Mode SS | |||
|---|---|---|---|
| Quadrant | BADHDUFLAG | Total packets | Discarded packets |
| A | 0 | 154 | 0 |
| B | 0 | 154 | 0 |
| C | 0 | 154 | 0 |
| D | 0 | 154 | 0 |
| Mode M0 | |||
|---|---|---|---|
| Quadrant | BADHDUFLAG | Total packets | Discarded packets |
| A | 0 | 15674 | 2 |
| B | 0 | 17924 | 1 |
| C | 0 | 15372 | 1 |
| D | 0 | 17736 | 1 |
| Mode M9 | |||
|---|---|---|---|
| Quadrant | BADHDUFLAG | Total packets | Discarded packets |
| A | 0 | 3 | 0 |
| B | 0 | 3 | 0 |
| C | 0 | 3 | 0 |
| D | 0 | 3 | 0 |
| Quadrant | Total seconds | Saturated seconds | Saturation percentage |
|---|---|---|---|
| A | 7451 | 235 | 3.153939% |
| B | 7451 | 262 | 3.516307% |
| C | 7451 | 154 | 2.066837% |
| D | 7451 | 332 | 4.455778% |
Noise dominated data is calculated using 1-second bins in cleaned event files. If a bin has >2000 counts, and if more than 50% of those come from <1% of pixels, then it is considered to be noise-dominated and hence unusable.
| Quadrant | # 1 sec bins | Bins with >0 counts | Bins with >2000 counts | High rate bins dominated by noise | Noise dominated (total time) | Noise dominated (detector-on time) | Marked lightcurve |
|---|---|---|---|---|---|---|---|
| A | 7811 | 7452 | 23 | 23 | 0.29% | 0.31% | 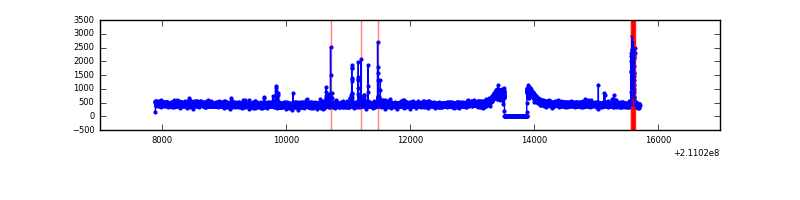 |
| B | 7811 | 7452 | 23 | 23 | 0.29% | 0.31% | 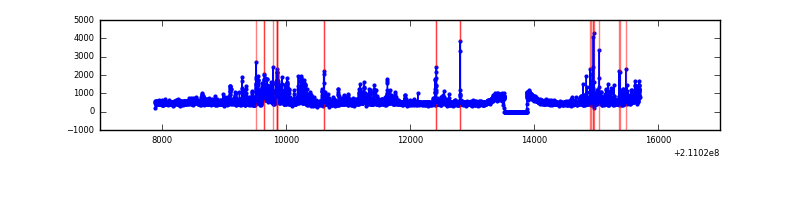 |
| C | 7811 | 7452 | 1 | 1 | 0.01% | 0.01% | 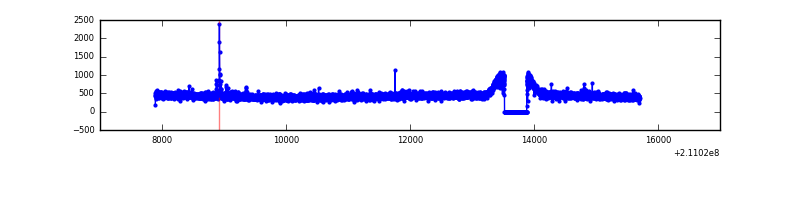 |
| D | 7811 | 7452 | 128 | 128 | 1.64% | 1.72% | 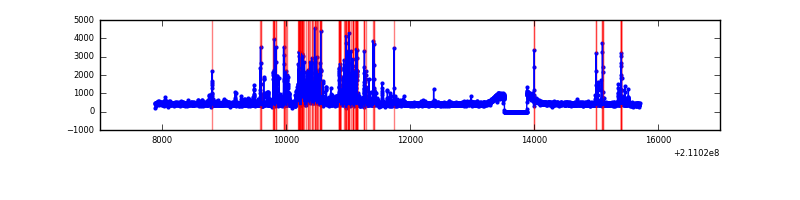 |
Top three noisy pixels from each quadrant. If the there are fewer than three noisy pixels in the level2.evt file, extra rows are filled as -1
| Pixel properties | Quadrant properties | ||||||
|---|---|---|---|---|---|---|---|
| Quadrant | DetID | PixID | Counts | Sigma | Mean | Median | Sigma |
| A | 15 | 174 | 75410 | 416.74 | 864 | 841 | 178.9 |
| A | 0 | 50 | 39419 | 215.6 | 864 | 841 | 178.9 |
| A | 8 | 4 | 12573 | 65.57 | 864 | 841 | 178.9 |
| B | 8 | 3 | 523011 | 3108.4 | 869 | 848 | 168.0 |
| B | 15 | 204 | 335011 | 1989.25 | 869 | 848 | 168.0 |
| B | 0 | 219 | 69647 | 409.56 | 869 | 848 | 168.0 |
| C | 12 | 4 | 18650 | 89.66 | 850 | 851 | 198.5 |
| C | 13 | 61 | 6886 | 30.4 | 850 | 851 | 198.5 |
| C | 1 | 16 | 4412 | 17.94 | 850 | 851 | 198.5 |
| D | 2 | 33 | 880241 | 4190.42 | 847 | 817 | 209.9 |
| D | 2 | 14 | 30865 | 143.18 | 847 | 817 | 209.9 |
| D | 2 | 234 | 17841 | 81.12 | 847 | 817 | 209.9 |
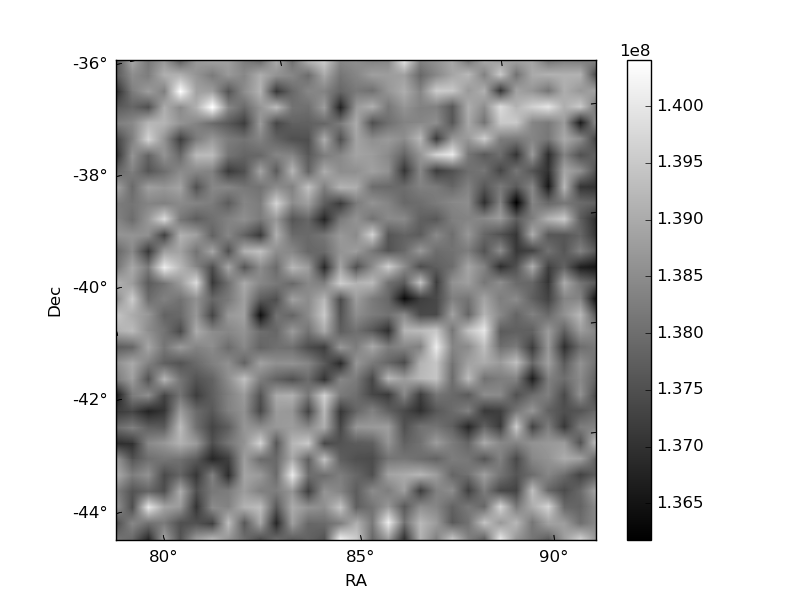
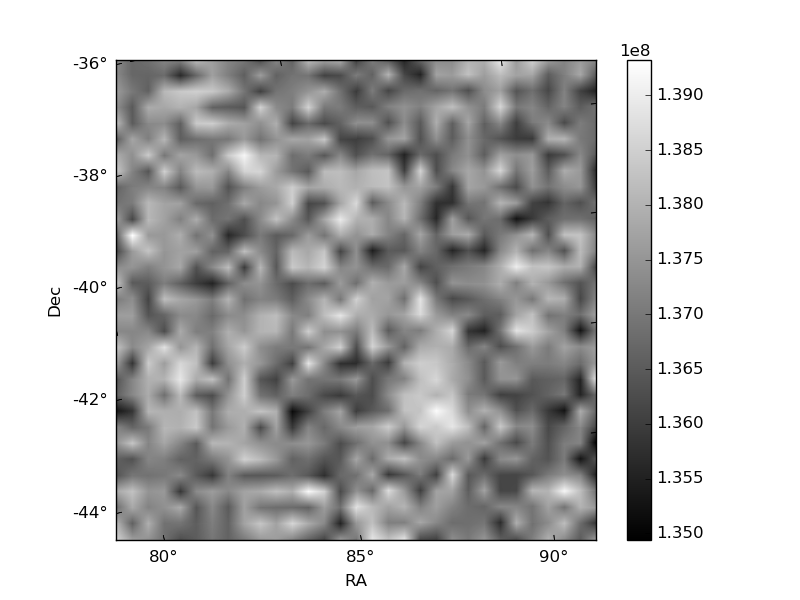
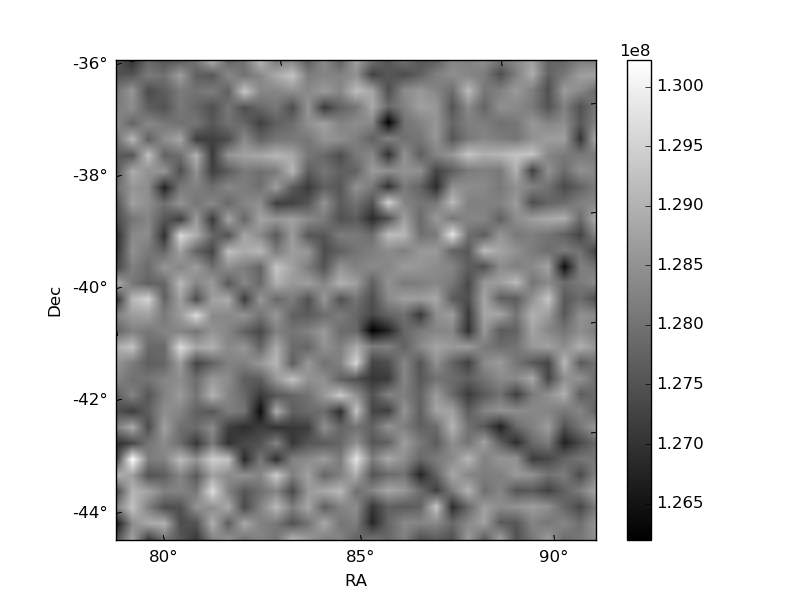
Histogram calculated using DETX and DETY for each event in the final _common_clean file
| Quadrant A | 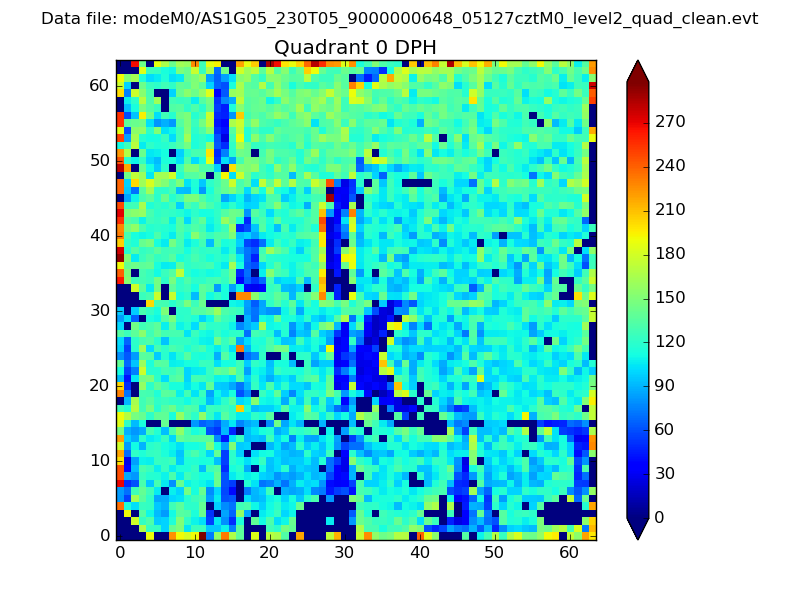 |
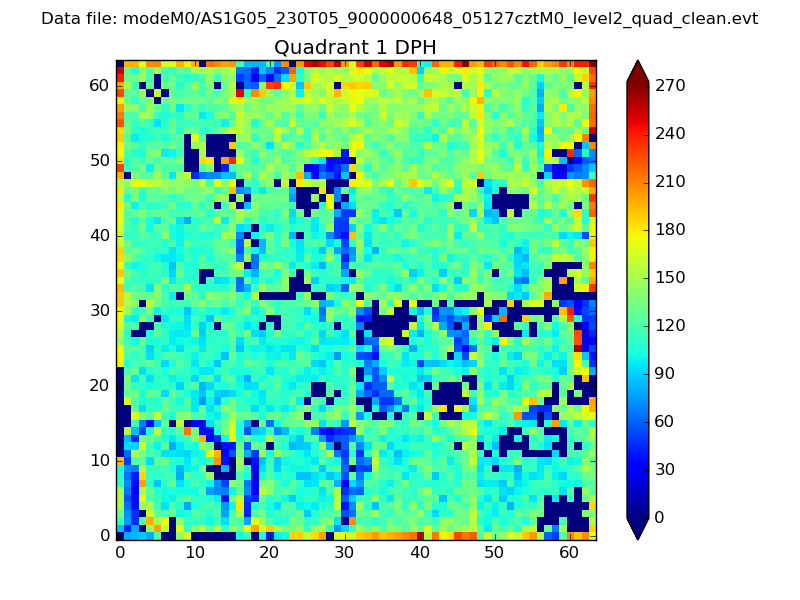 |
Quadrant B |
|---|---|---|---|
| Quadrant D | 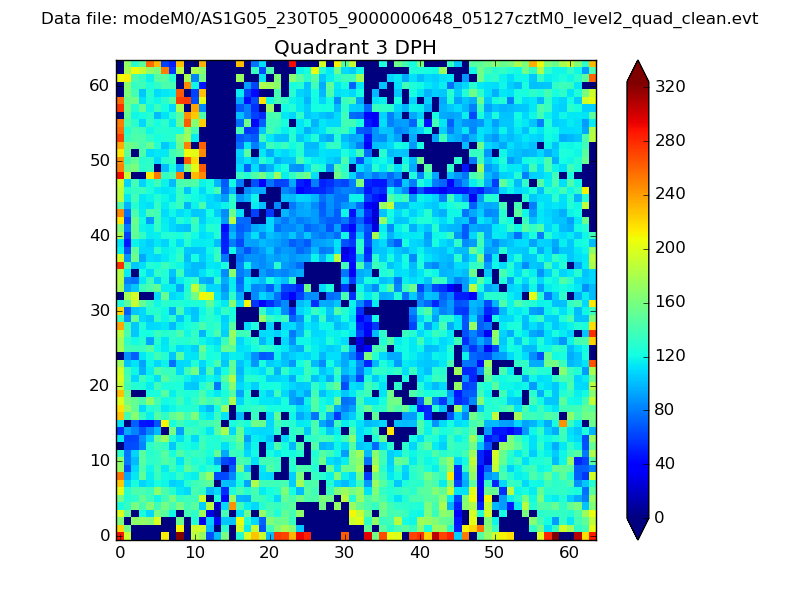 |
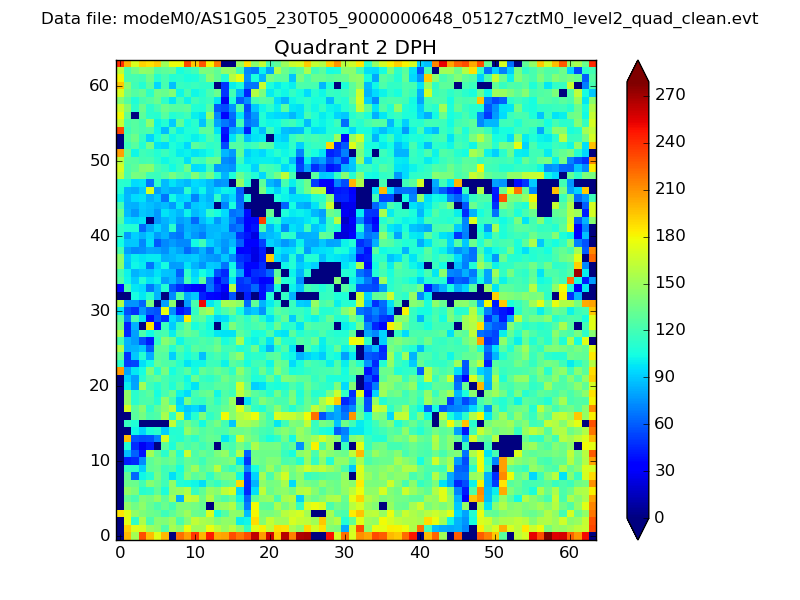 |
Quadrant C |
| Plot type | Count rate plots | Images |
|---|---|---|
| Comparison with Poisson distribution Blue bars denote a histogram of data divided into 1 sec bins. Red curve is a Poisson curve with rate = median count rate of data. |
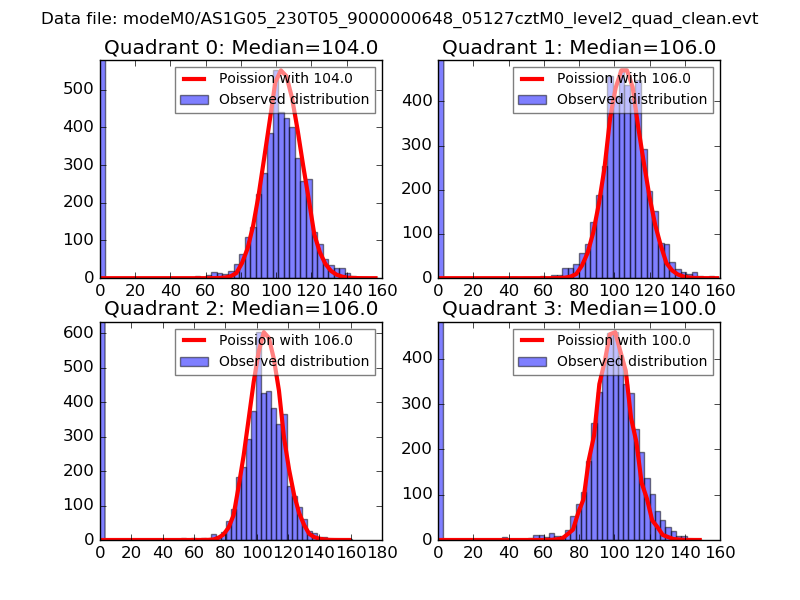 |
 |
| Quadrant-wise count rates Data is divided into 100 sec bins |
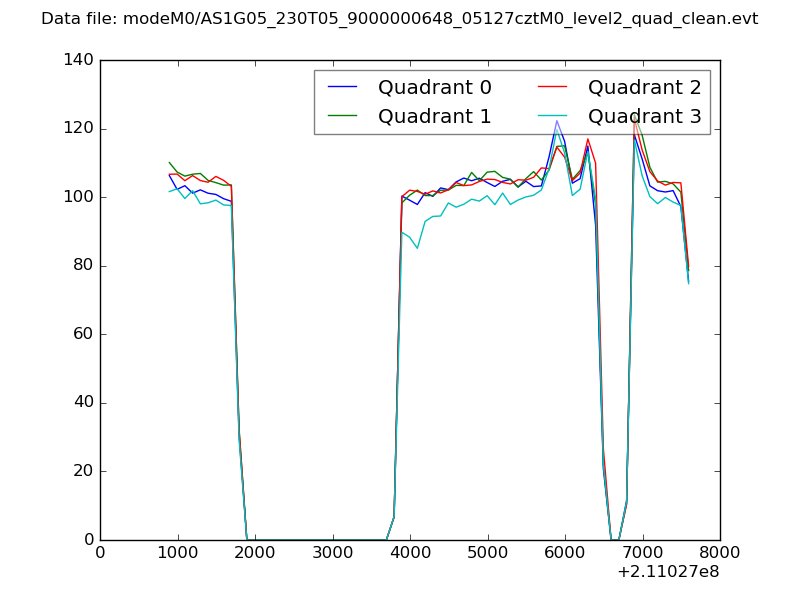 |
|
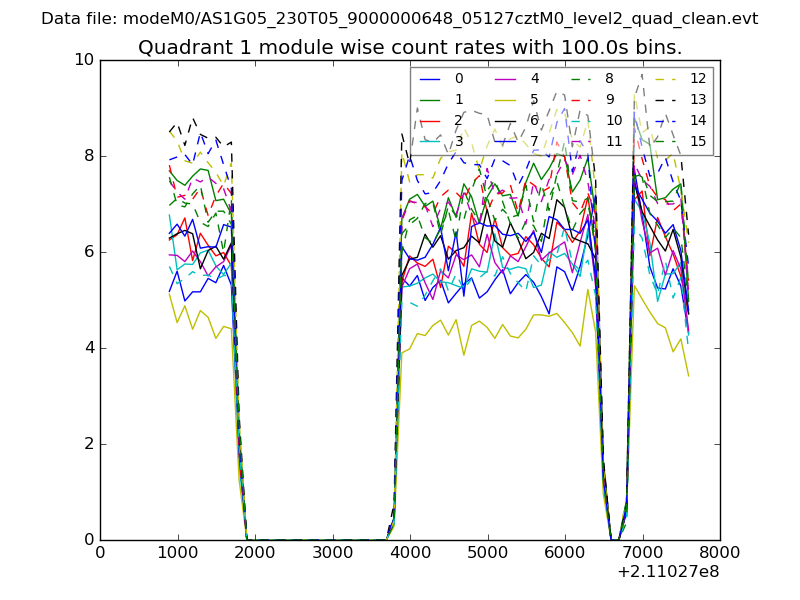
| Module-wise count rates for Quadrant A Data is divided into 100 sec bins |
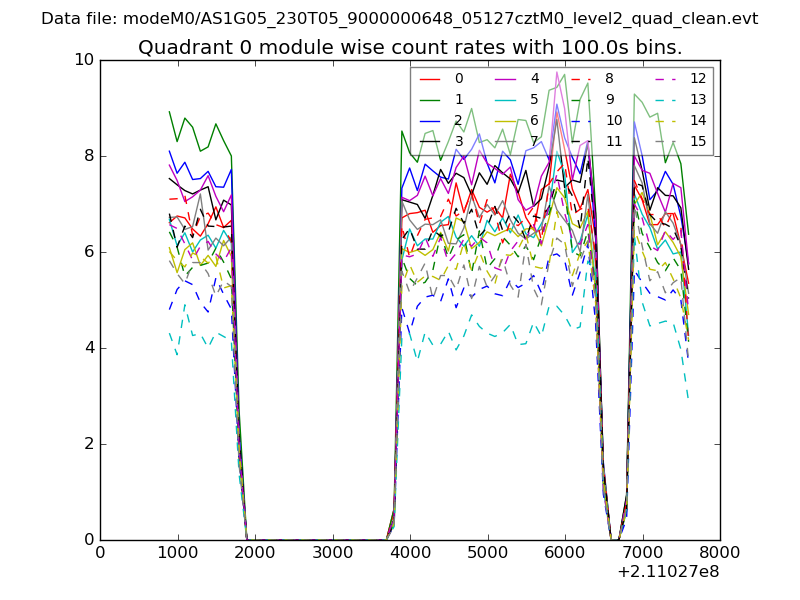 |
 |
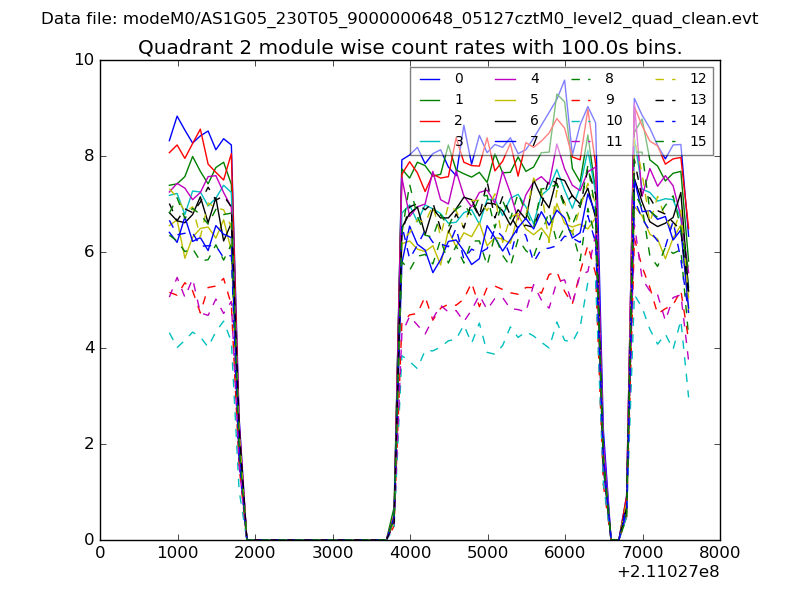
| Module-wise count rates for Quadrant B Data is divided into 100 sec bins |
 |
 |
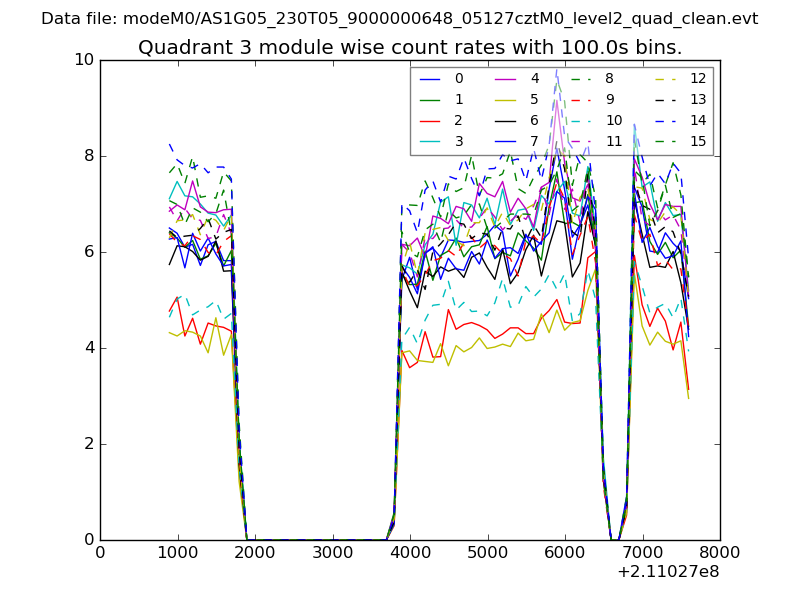
| Module-wise count rates for Quadrant C Data is divided into 100 sec bins |
 |
 |
| Module-wise count rates for Quadrant D Data is divided into 100 sec bins |
 |
 |
| Parameter | Plot |
|---|---|
| CZT HV Monitor | 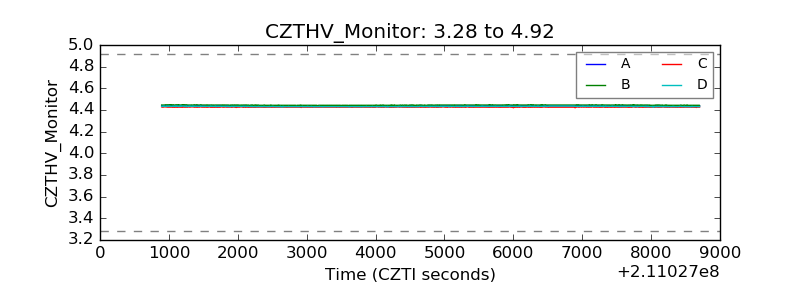 |
| D_VDD | 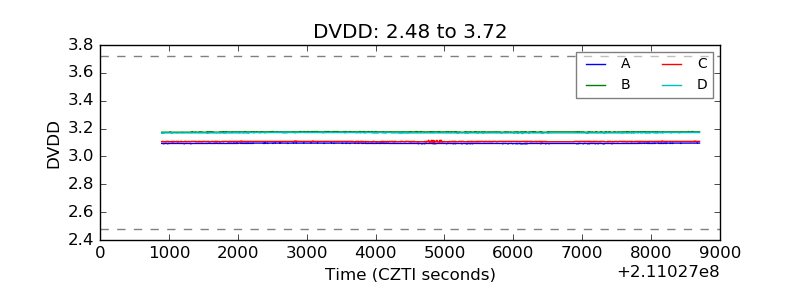 |
| Temperature 1 | 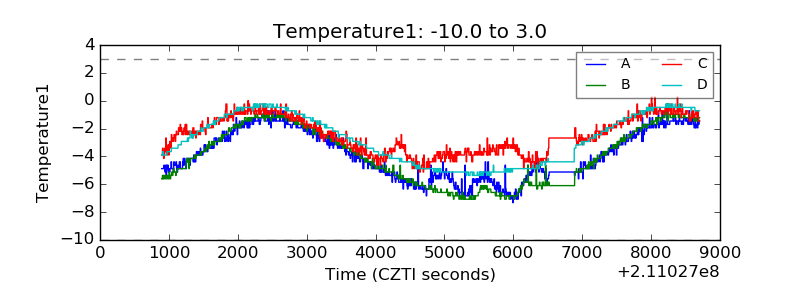 |
| Veto HV Monitor | 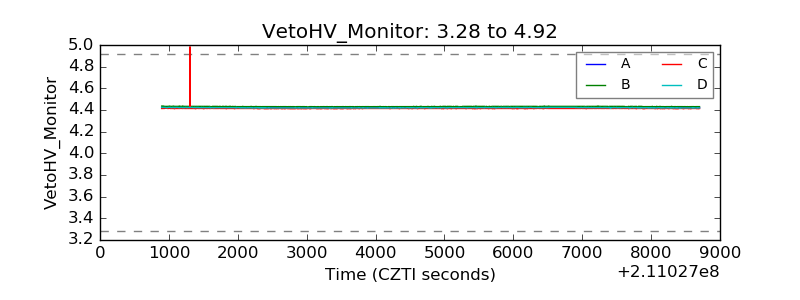 |
| Veto LLD | 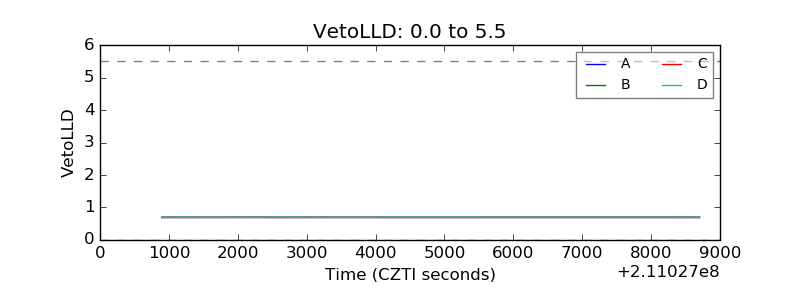 |
| Alpha Counter | 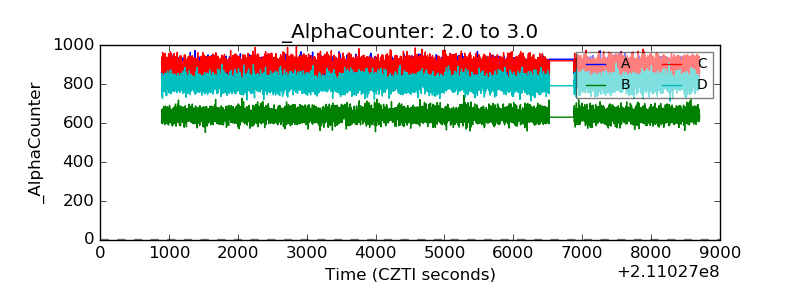 |
| _CPM_Rate | 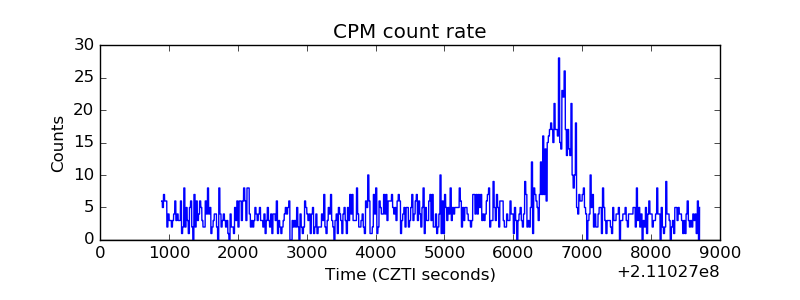 |
| CZT Counter | 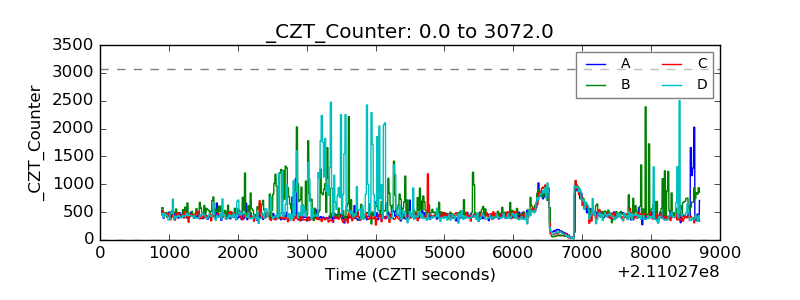 |
| +2.5 Volts monitor |  |
| +5 Volts monitor |  |
| _ROLL_ROT | 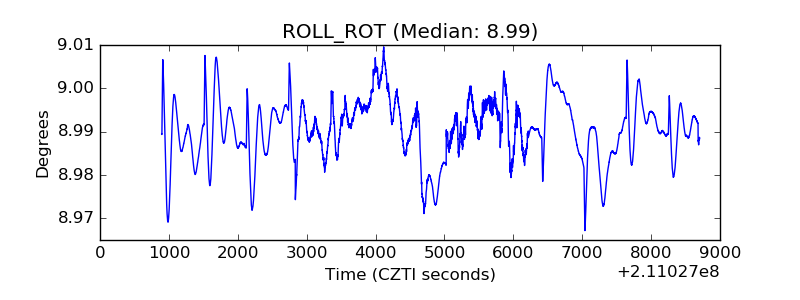 |
| _Roll_DEC | 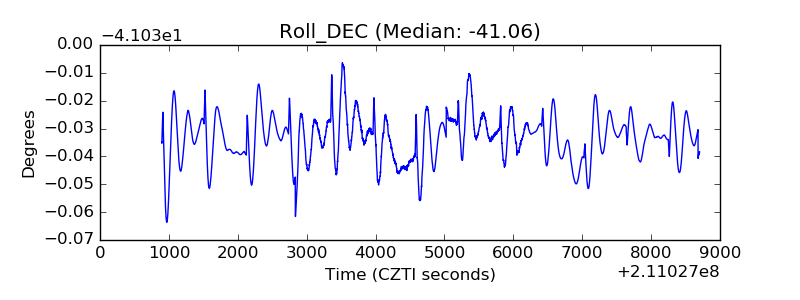 |
| _Roll_RA |  |
| Veto Counter | 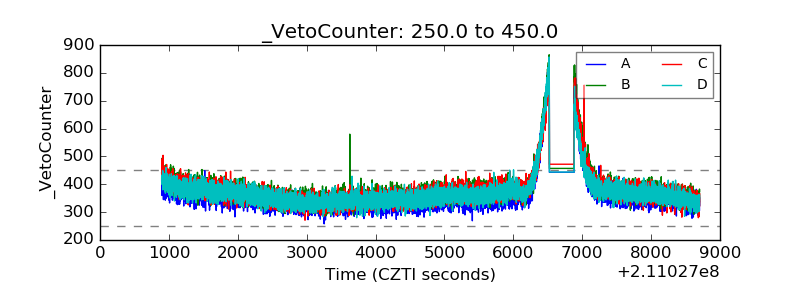 |