| Param | Original file | Final file |
|---|---|---|
| Filename | modeM0/AS1G05_230T05_9000000648_05128cztM0_level2.evt | modeM0/AS1G05_230T05_9000000648_05128cztM0_level2_quad_clean.evt |
| Size (bytes) | 513,688,320 | 71,925,120 |
| Size | 489.9 MB | 68.6 MB |
| Events in quadrant A | 3,509,270 | 413,621 |
| Events in quadrant B | 4,384,013 | 417,332 |
| Events in quadrant C | 3,383,040 | 423,087 |
| Events in quadrant D | 3,773,795 | 404,268 |
| Mode SS | |||
|---|---|---|---|
| Quadrant | BADHDUFLAG | Total packets | Discarded packets |
| A | 0 | 150 | 0 |
| B | 0 | 150 | 0 |
| C | 0 | 150 | 0 |
| D | 0 | 150 | 0 |
| Mode M0 | |||
|---|---|---|---|
| Quadrant | BADHDUFLAG | Total packets | Discarded packets |
| A | 0 | 15918 | 6 |
| B | 0 | 18104 | 1 |
| C | 0 | 15600 | 3 |
| D | 0 | 16826 | 1 |
| Mode M9 | |||
|---|---|---|---|
| Quadrant | BADHDUFLAG | Total packets | Discarded packets |
| A | 0 | 1 | 0 |
| B | 0 | 1 | 0 |
| C | 0 | 1 | 0 |
| D | 0 | 1 | 0 |
| Quadrant | Total seconds | Saturated seconds | Saturation percentage |
|---|---|---|---|
| A | 7462 | 281 | 3.765746% |
| B | 7463 | 374 | 5.011390% |
| C | 7462 | 153 | 2.050389% |
| D | 7463 | 291 | 3.899236% |
Noise dominated data is calculated using 1-second bins in cleaned event files. If a bin has >2000 counts, and if more than 50% of those come from <1% of pixels, then it is considered to be noise-dominated and hence unusable.
| Quadrant | # 1 sec bins | Bins with >0 counts | Bins with >2000 counts | High rate bins dominated by noise | Noise dominated (total time) | Noise dominated (detector-on time) | Marked lightcurve |
|---|---|---|---|---|---|---|---|
| A | 7528 | 7464 | 25 | 25 | 0.33% | 0.33% | 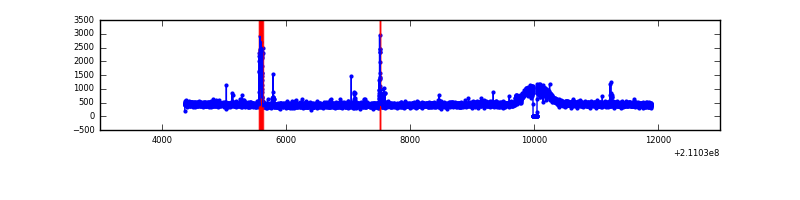 |
| B | 7528 | 7464 | 82 | 82 | 1.09% | 1.10% | 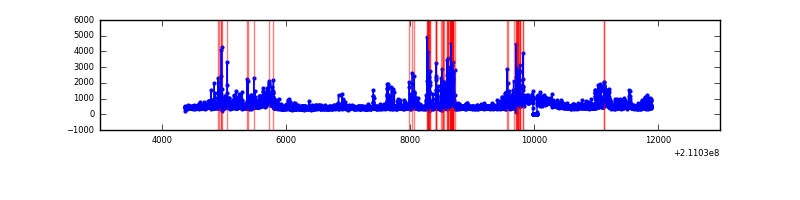 |
| C | 7528 | 7464 | 0 | 0 | 0.00% | 0.00% | 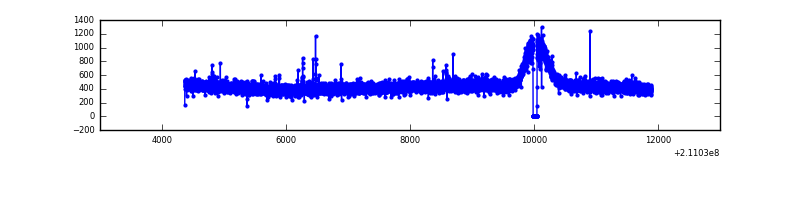 |
| D | 7528 | 7464 | 114 | 114 | 1.51% | 1.53% | 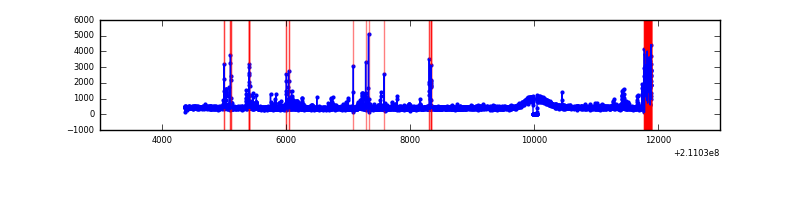 |
Top three noisy pixels from each quadrant. If the there are fewer than three noisy pixels in the level2.evt file, extra rows are filled as -1
| Pixel properties | Quadrant properties | ||||||
|---|---|---|---|---|---|---|---|
| Quadrant | DetID | PixID | Counts | Sigma | Mean | Median | Sigma |
| A | 15 | 174 | 72741 | 394.45 | 876 | 852 | 182.3 |
| A | 0 | 50 | 46016 | 247.81 | 876 | 852 | 182.3 |
| A | 0 | 226 | 9338 | 46.56 | 876 | 852 | 182.3 |
| B | 8 | 3 | 366691 | 2118.08 | 879 | 854 | 172.7 |
| B | 4 | 48 | 333709 | 1927.13 | 879 | 854 | 172.7 |
| B | 15 | 204 | 104007 | 597.22 | 879 | 854 | 172.7 |
| C | 12 | 4 | 17570 | 82.87 | 860 | 862 | 201.6 |
| C | 13 | 61 | 6878 | 29.84 | 860 | 862 | 201.6 |
| C | 9 | 16 | 6034 | 25.65 | 860 | 862 | 201.6 |
| D | 2 | 33 | 520902 | 2421.38 | 857 | 827 | 214.8 |
| D | 2 | 14 | 18739 | 83.4 | 857 | 827 | 214.8 |
| D | 2 | 234 | 11232 | 48.44 | 857 | 827 | 214.8 |
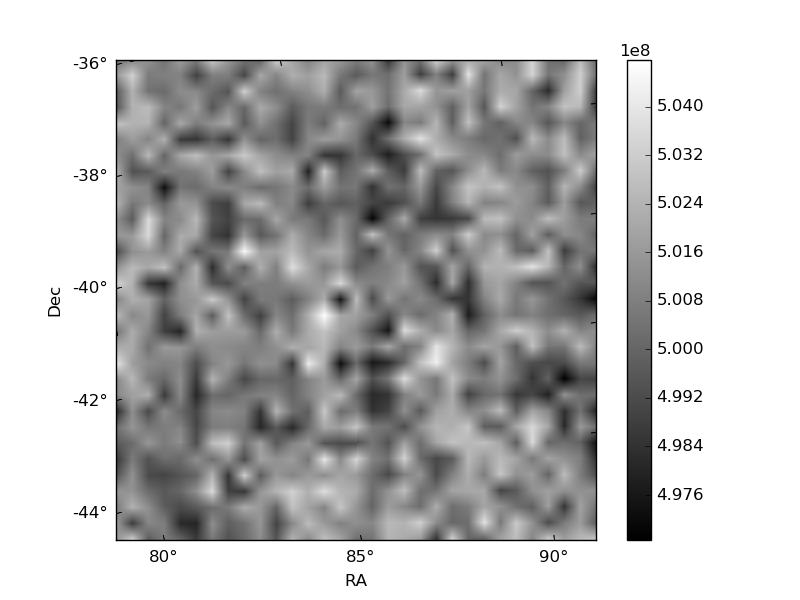
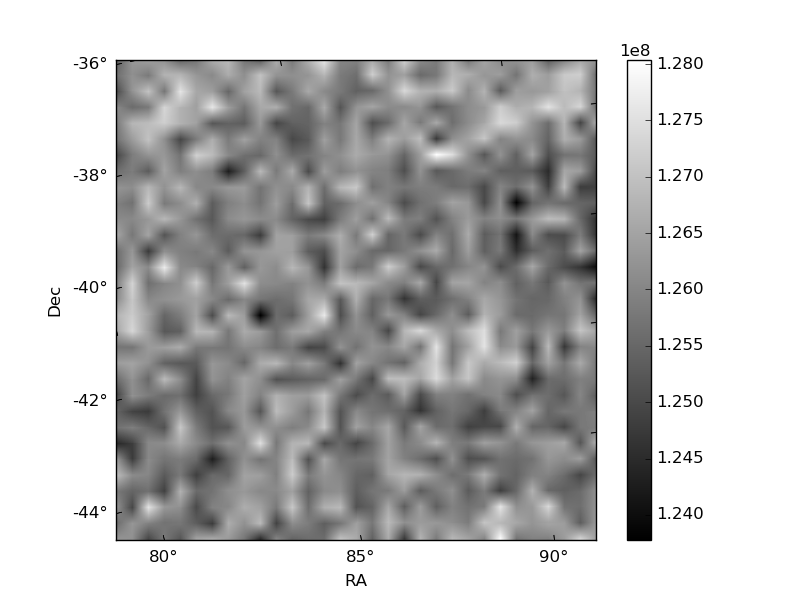
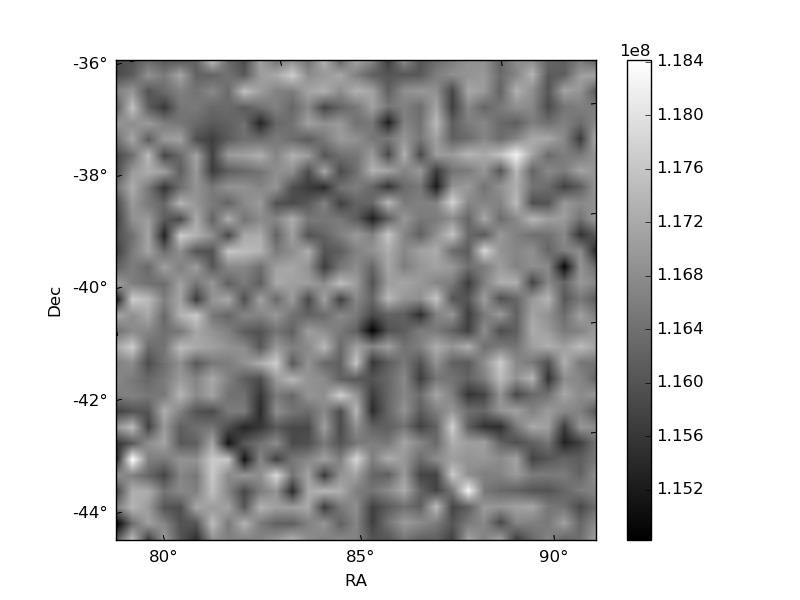
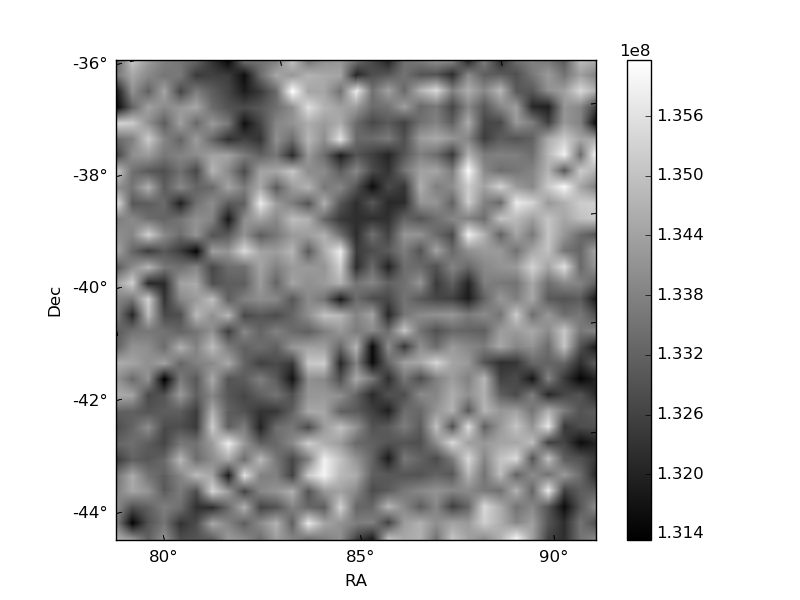
Histogram calculated using DETX and DETY for each event in the final _common_clean file
| Quadrant A | 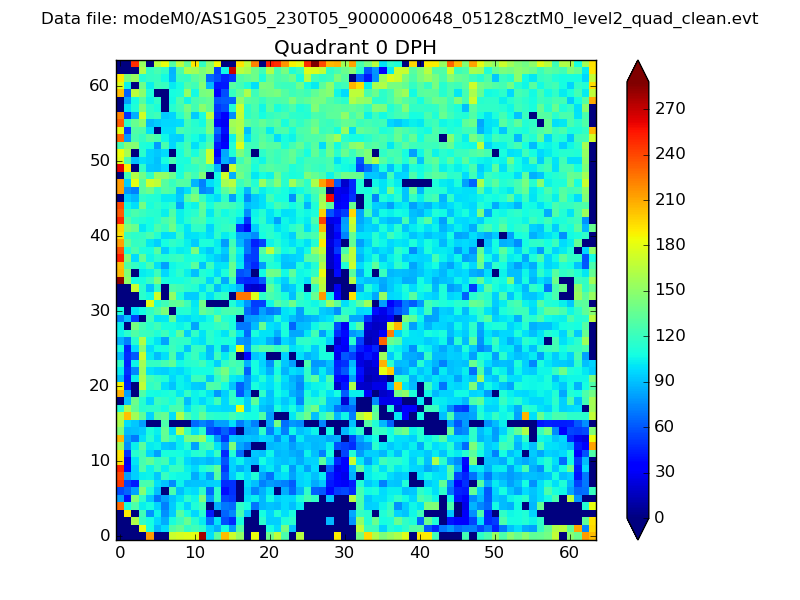 |
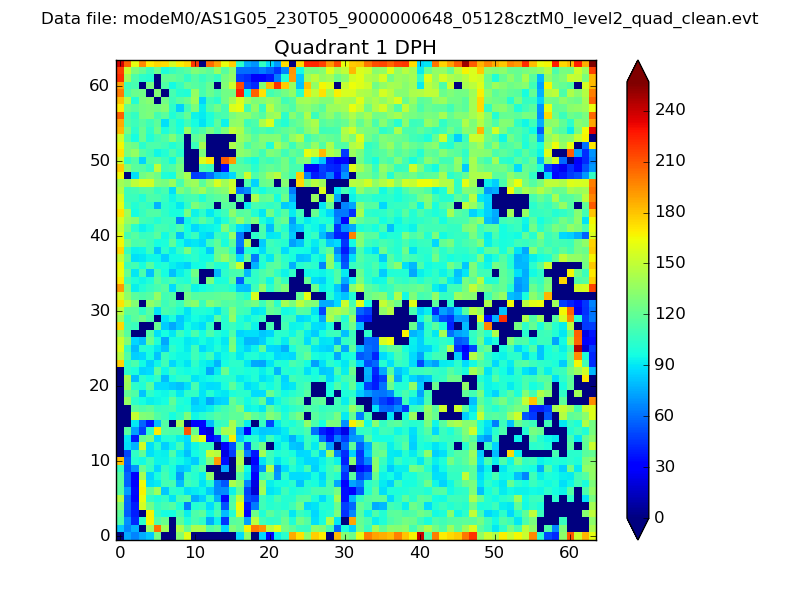 |
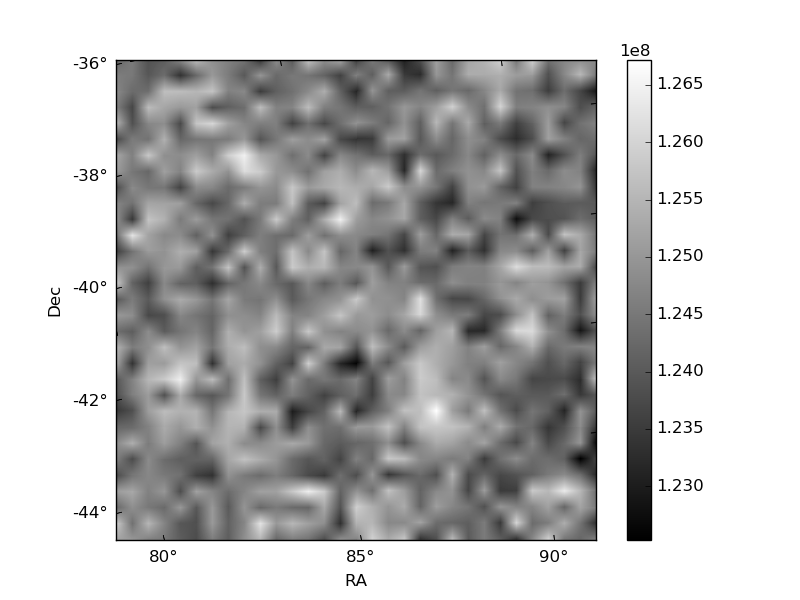
Quadrant B |
|---|---|---|---|
| Quadrant D | 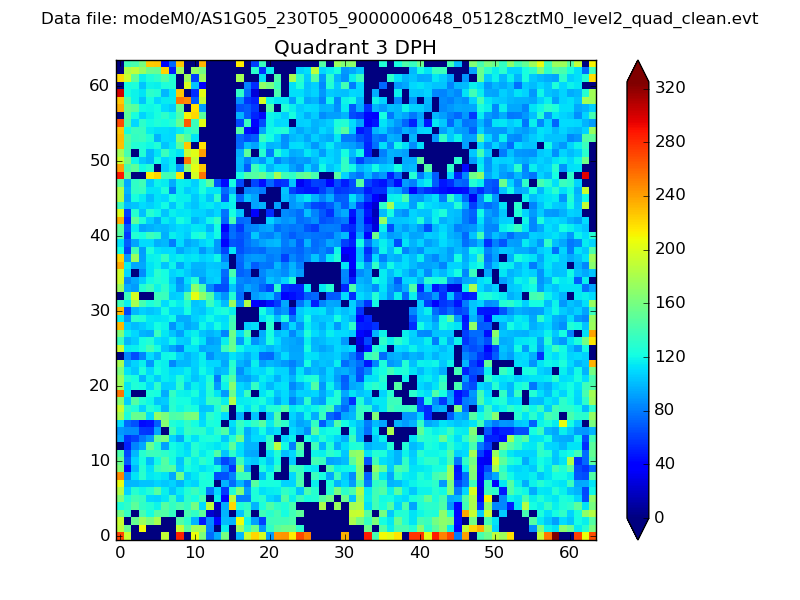 |
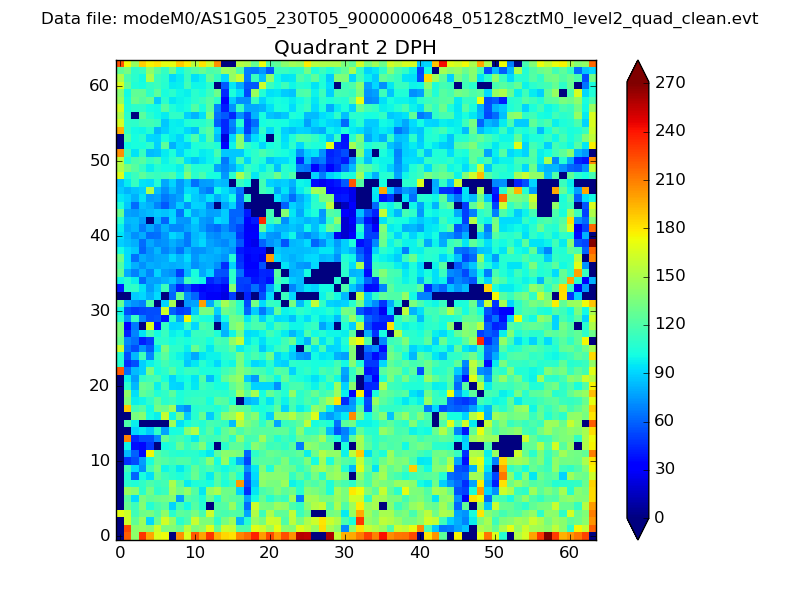 |
Quadrant C |
| Plot type | Count rate plots | Images |
|---|---|---|
| Comparison with Poisson distribution Blue bars denote a histogram of data divided into 1 sec bins. Red curve is a Poisson curve with rate = median count rate of data. |
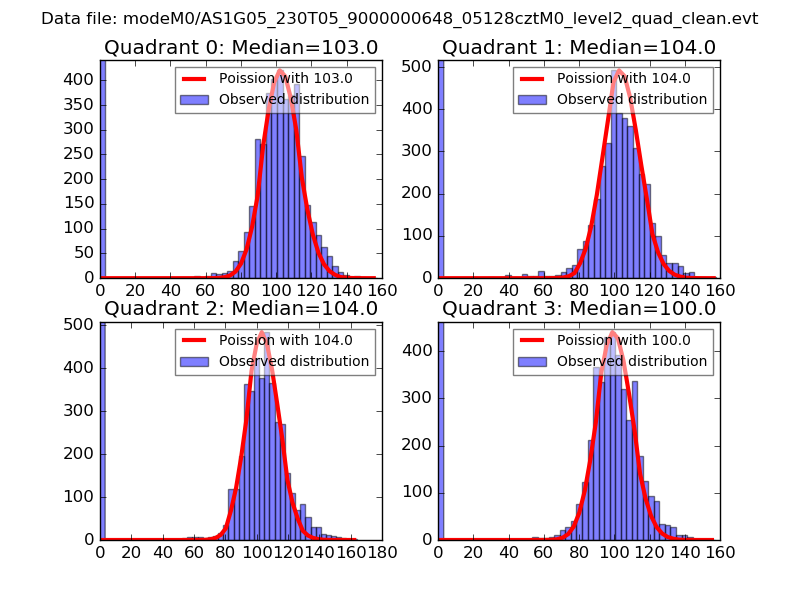 |
 |
| Quadrant-wise count rates Data is divided into 100 sec bins |
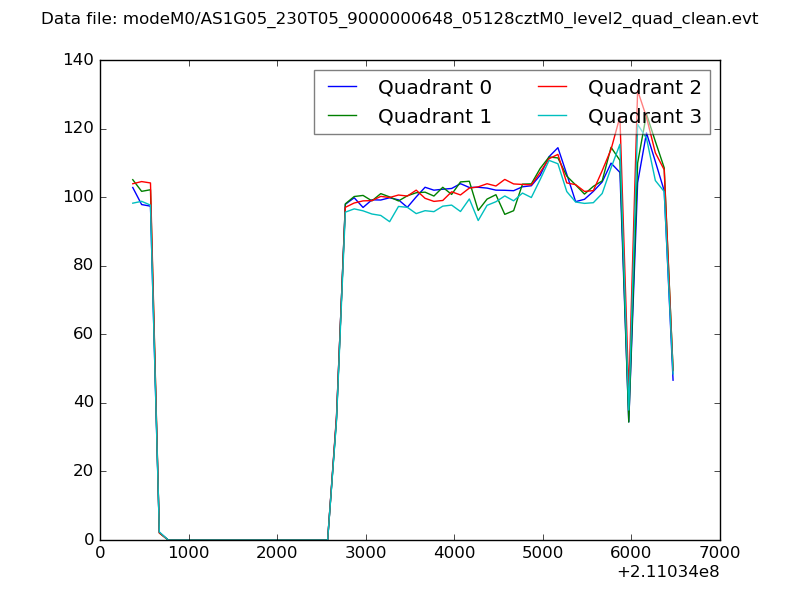 |
|
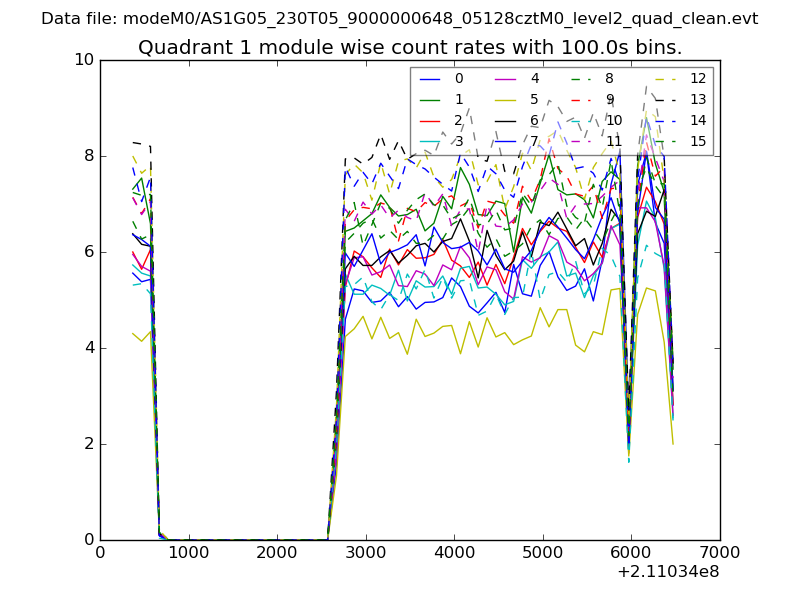
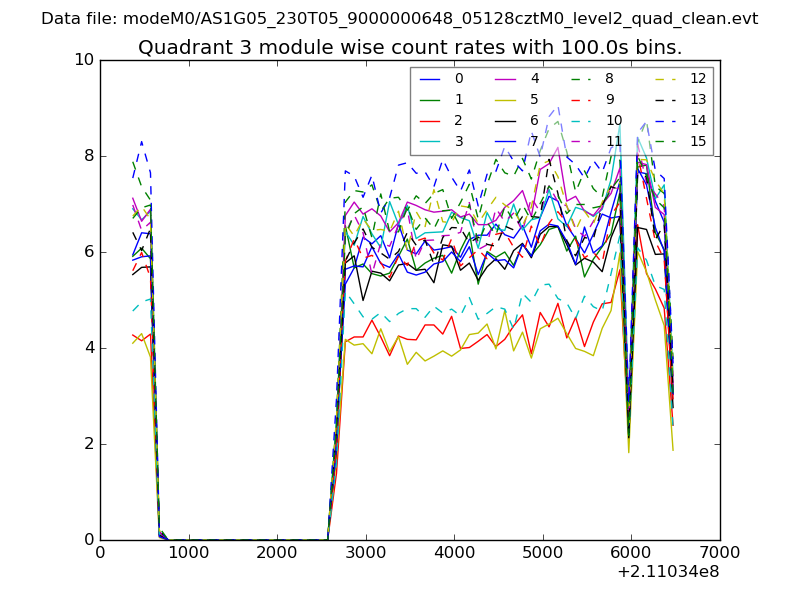
| Module-wise count rates for Quadrant A Data is divided into 100 sec bins |
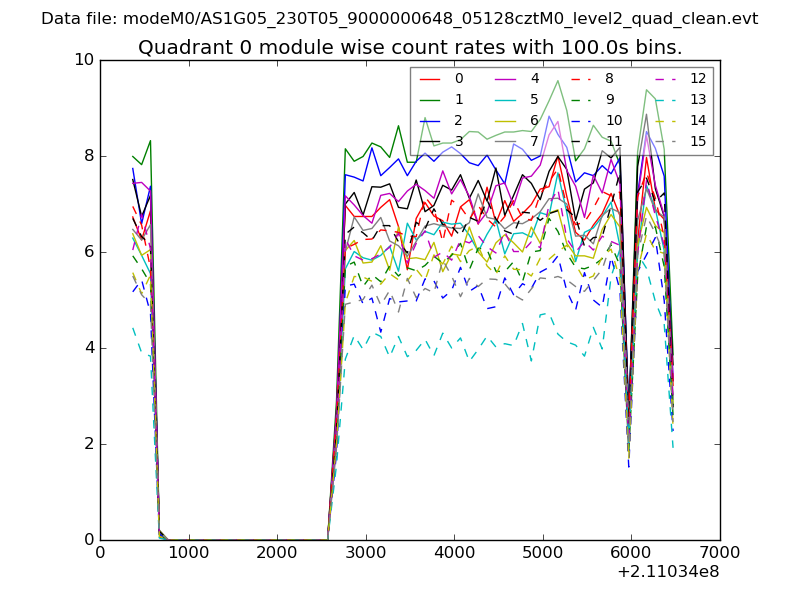 |
 |
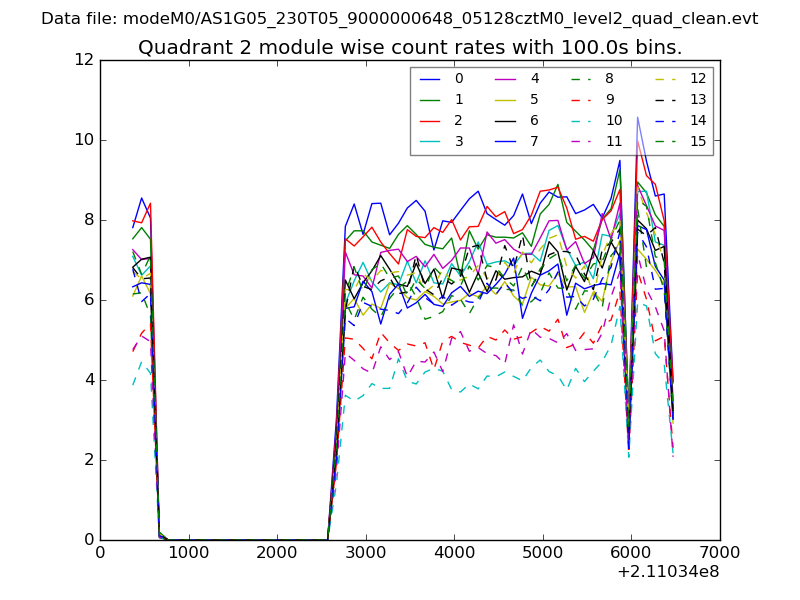
| Module-wise count rates for Quadrant B Data is divided into 100 sec bins |
 |
 |
| Module-wise count rates for Quadrant C Data is divided into 100 sec bins |
 |
 |
| Module-wise count rates for Quadrant D Data is divided into 100 sec bins |
 |
 |
| Parameter | Plot |
|---|---|
| CZT HV Monitor | 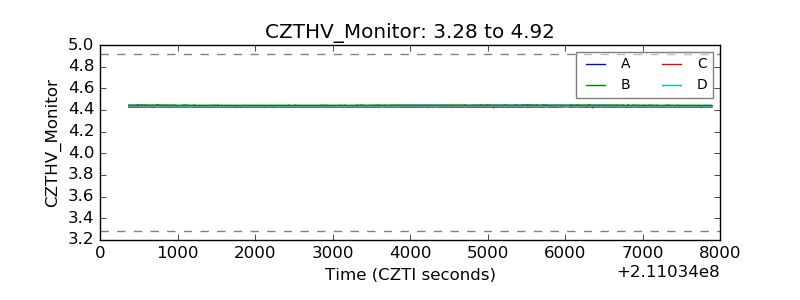 |
| D_VDD | 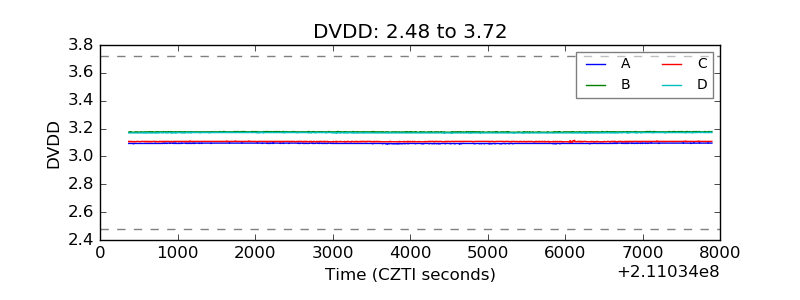 |
| Temperature 1 | 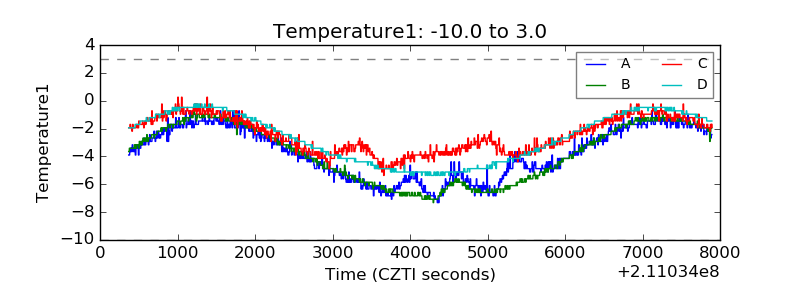 |
| Veto HV Monitor | 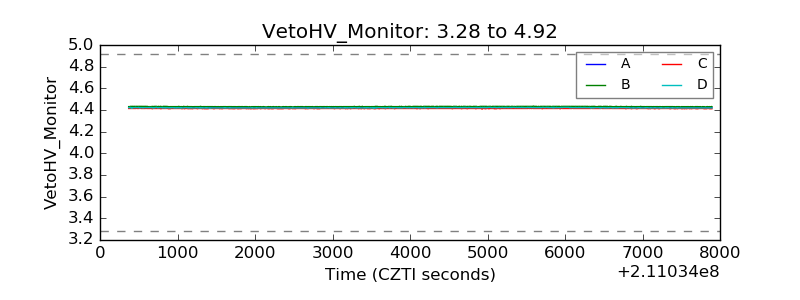 |
| Veto LLD | 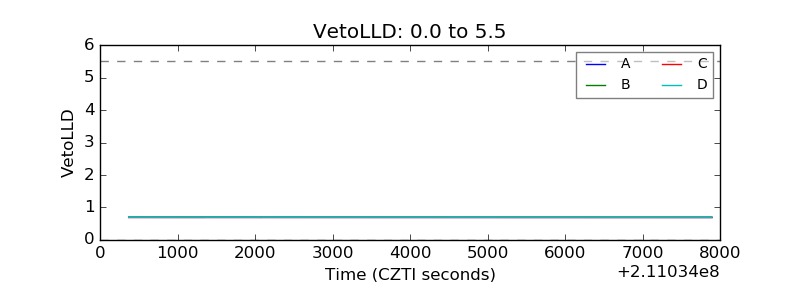 |
| Alpha Counter | 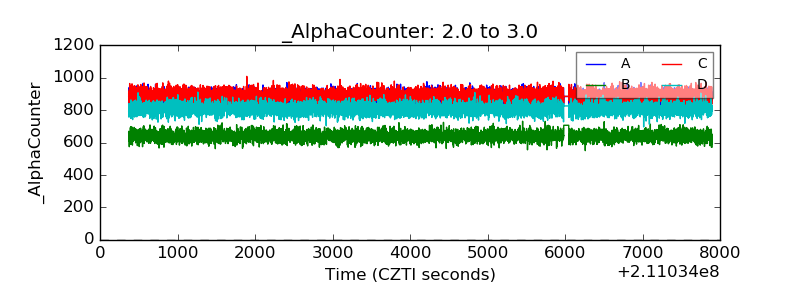 |
| _CPM_Rate | 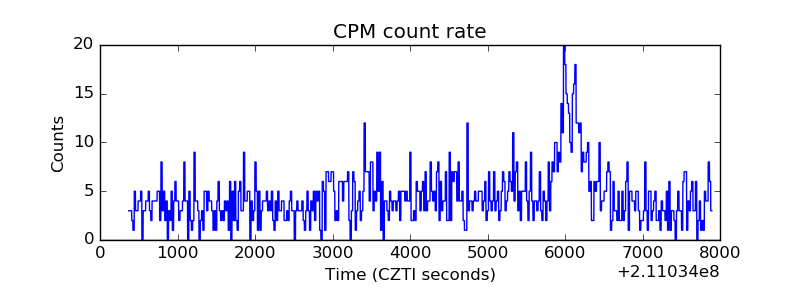 |
| CZT Counter | 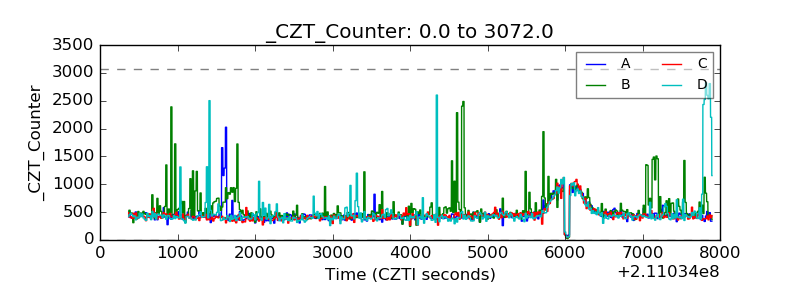 |
| +2.5 Volts monitor |  |
| +5 Volts monitor |  |
| _ROLL_ROT | 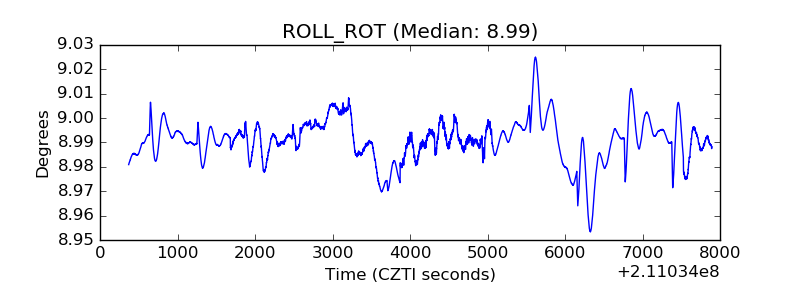 |
| _Roll_DEC | 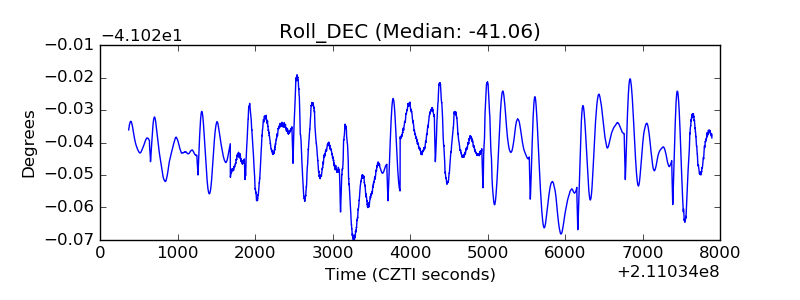 |
| _Roll_RA | 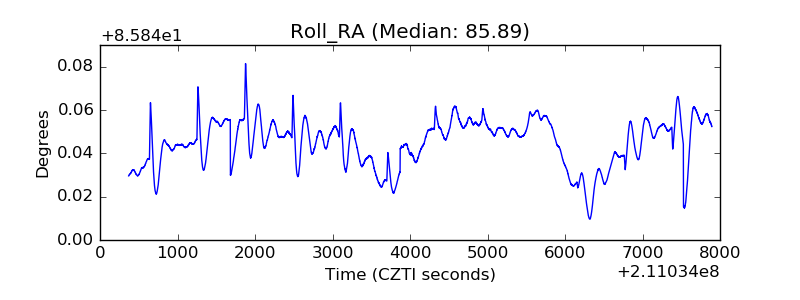 |
| Veto Counter | 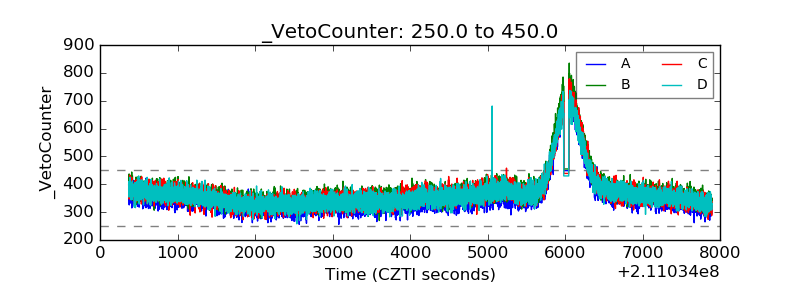 |