| Param | Original file | Final file |
|---|---|---|
| Filename | modeM0/AS1G05_230T05_9000000648_05129cztM0_level2.evt | modeM0/AS1G05_230T05_9000000648_05129cztM0_level2_quad_clean.evt |
| Size (bytes) | 501,828,480 | 67,075,200 |
| Size | 478.6 MB | 64.0 MB |
| Events in quadrant A | 3,367,122 | 379,146 |
| Events in quadrant B | 3,913,770 | 387,149 |
| Events in quadrant C | 3,379,611 | 389,025 |
| Events in quadrant D | 4,045,109 | 371,279 |
| Mode SS | |||
|---|---|---|---|
| Quadrant | BADHDUFLAG | Total packets | Discarded packets |
| A | 0 | 162 | 10 |
| B | 0 | 162 | 14 |
| C | 0 | 162 | 6 |
| D | 0 | 162 | 10 |
| Mode M0 | |||
|---|---|---|---|
| Quadrant | BADHDUFLAG | Total packets | Discarded packets |
| A | 0 | 16717 | 1468 |
| B | 0 | 18168 | 1823 |
| C | 0 | 16762 | 1448 |
| D | 0 | 19360 | 2024 |
| Mode M9 | |||
|---|---|---|---|
| Quadrant | BADHDUFLAG | Total packets | Discarded packets |
| A | 0 | 3 | 0 |
| B | 0 | 3 | 0 |
| C | 0 | 3 | 0 |
| D | 0 | 3 | 0 |
| Quadrant | Total seconds | Saturated seconds | Saturation percentage |
|---|---|---|---|
| A | 7225 | 310 | 4.290657% |
| B | 7210 | 346 | 4.798890% |
| C | 7231 | 195 | 2.696722% |
| D | 7220 | 367 | 5.083102% |
Noise dominated data is calculated using 1-second bins in cleaned event files. If a bin has >2000 counts, and if more than 50% of those come from <1% of pixels, then it is considered to be noise-dominated and hence unusable.
| Quadrant | # 1 sec bins | Bins with >0 counts | Bins with >2000 counts | High rate bins dominated by noise | Noise dominated (total time) | Noise dominated (detector-on time) | Marked lightcurve |
|---|---|---|---|---|---|---|---|
| A | 8184 | 7487 | 5 | 5 | 0.06% | 0.07% | 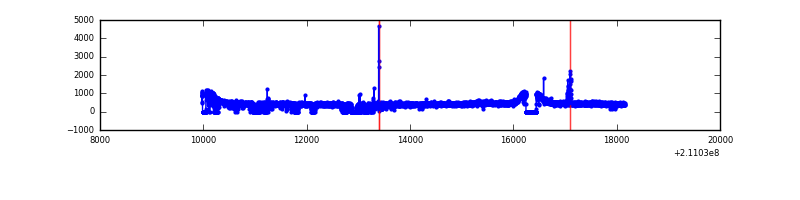 |
| B | 8184 | 7492 | 7 | 7 | 0.09% | 0.09% | 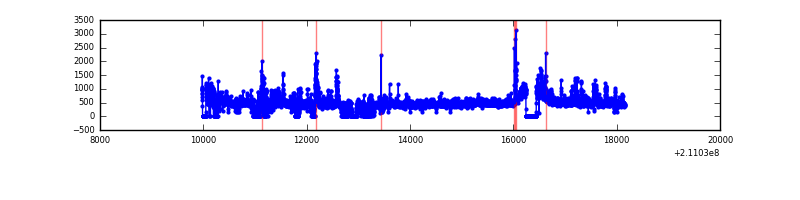 |
| C | 8184 | 7501 | 1 | 1 | 0.01% | 0.01% | 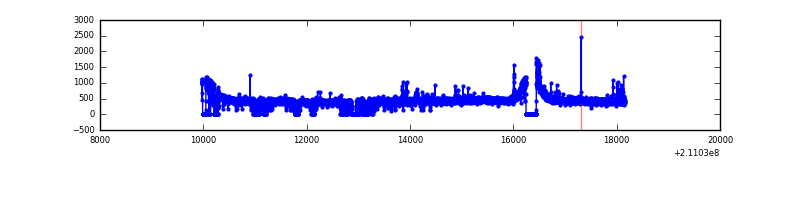 |
| D | 8184 | 7471 | 165 | 165 | 2.02% | 2.21% | 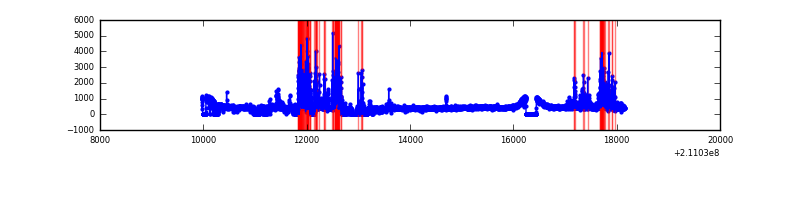 |
Top three noisy pixels from each quadrant. If the there are fewer than three noisy pixels in the level2.evt file, extra rows are filled as -1
| Pixel properties | Quadrant properties | ||||||
|---|---|---|---|---|---|---|---|
| Quadrant | DetID | PixID | Counts | Sigma | Mean | Median | Sigma |
| A | 0 | 50 | 38020 | 206.86 | 862 | 836 | 179.8 |
| A | 0 | 226 | 9156 | 46.29 | 862 | 836 | 179.8 |
| A | 12 | 194 | 8856 | 44.62 | 862 | 836 | 179.8 |
| B | 15 | 204 | 260406 | 1533.08 | 866 | 844 | 169.3 |
| B | 8 | 3 | 196567 | 1156.02 | 866 | 844 | 169.3 |
| B | 4 | 48 | 42087 | 243.6 | 866 | 844 | 169.3 |
| C | 12 | 4 | 40821 | 202.03 | 844 | 848 | 197.9 |
| C | 9 | 16 | 36366 | 179.51 | 844 | 848 | 197.9 |
| C | 13 | 61 | 7029 | 31.24 | 844 | 848 | 197.9 |
| D | 2 | 33 | 854259 | 4056.2 | 841 | 813 | 210.4 |
| D | 2 | 234 | 11679 | 51.64 | 841 | 813 | 210.4 |
| D | 2 | 14 | 11410 | 50.36 | 841 | 813 | 210.4 |
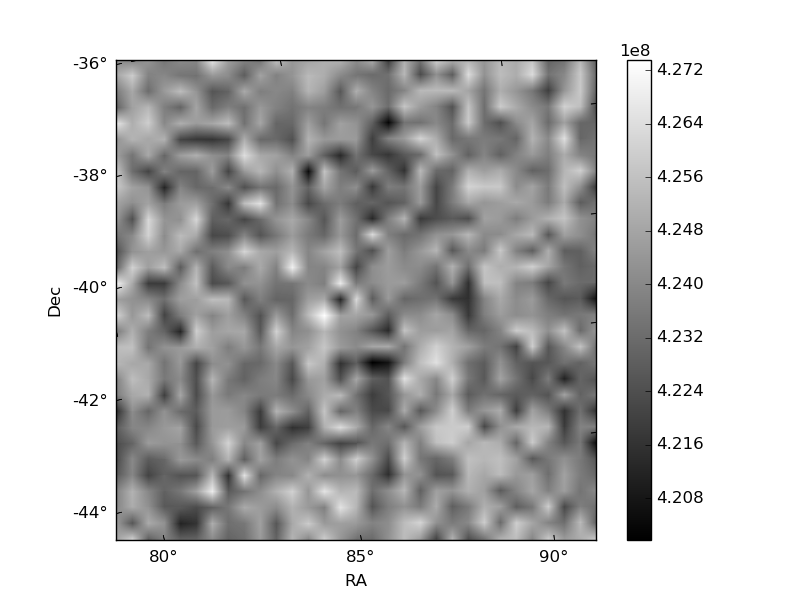
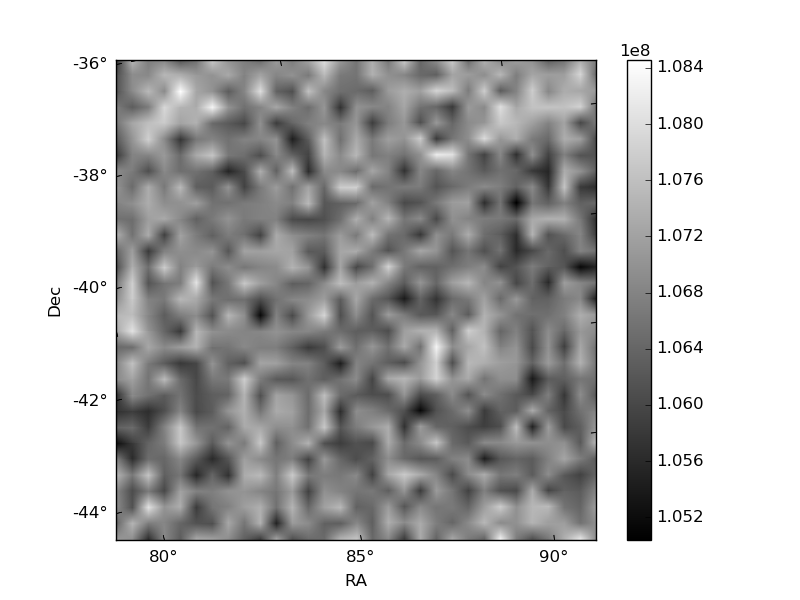
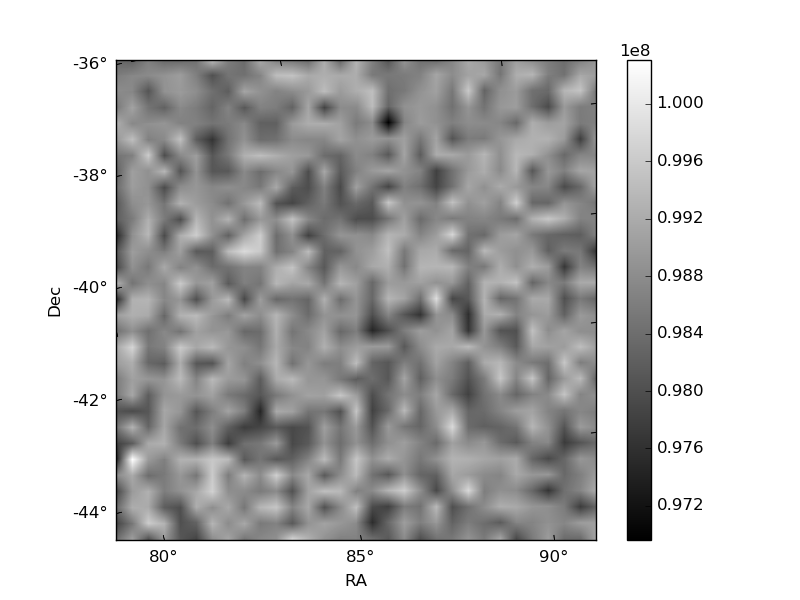
Histogram calculated using DETX and DETY for each event in the final _common_clean file
| Quadrant A | 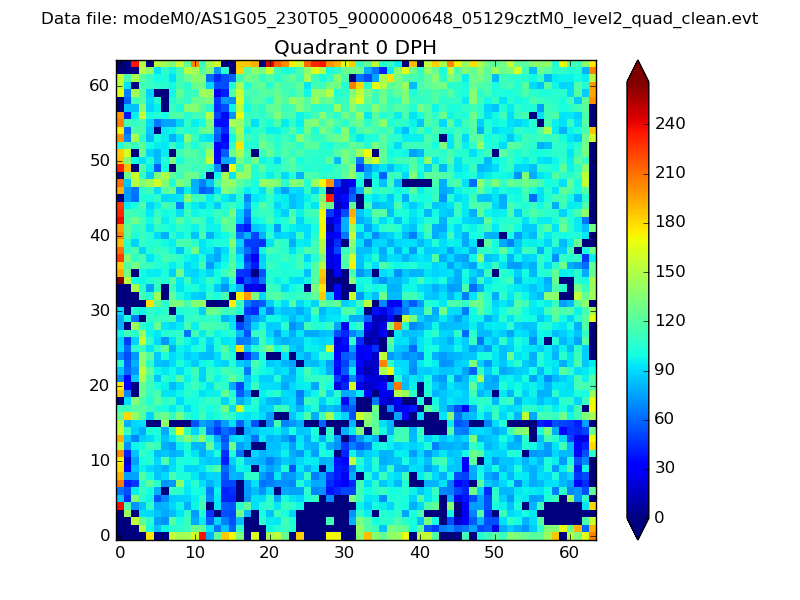 |
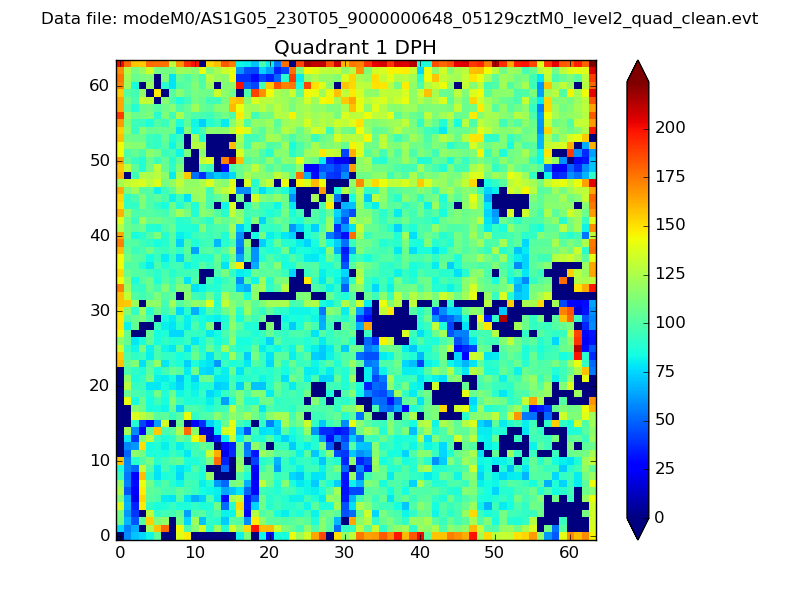 |
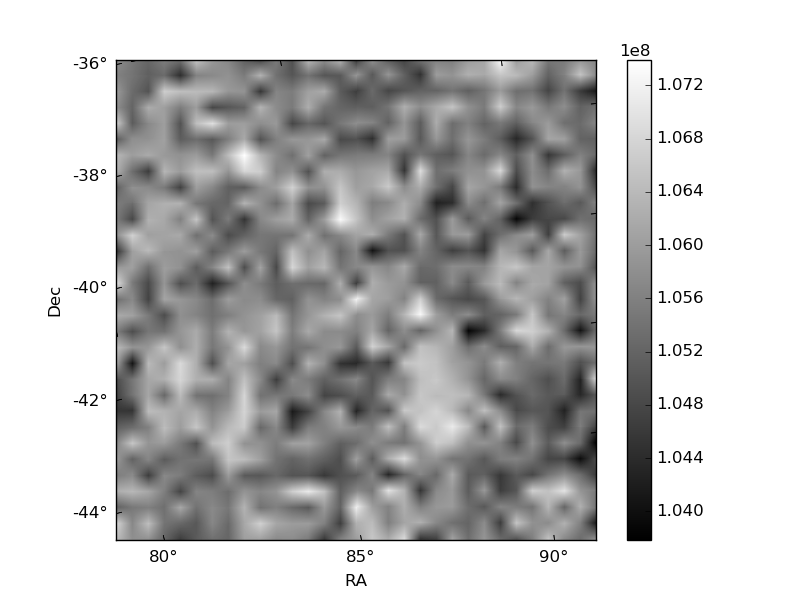
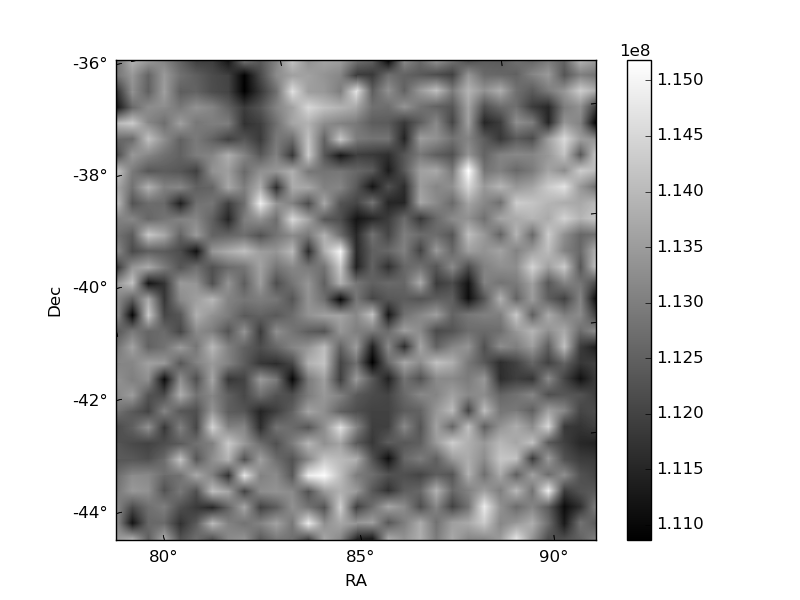
Quadrant B |
|---|---|---|---|
| Quadrant D | 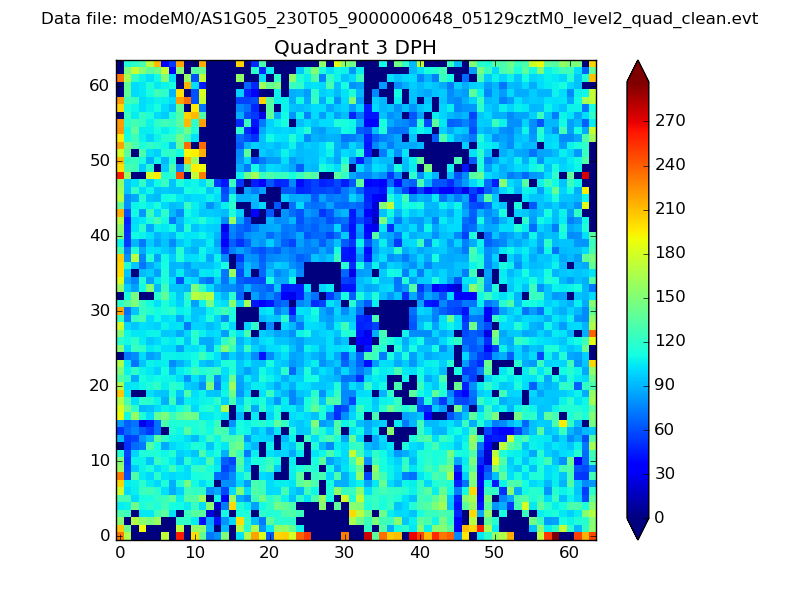 |
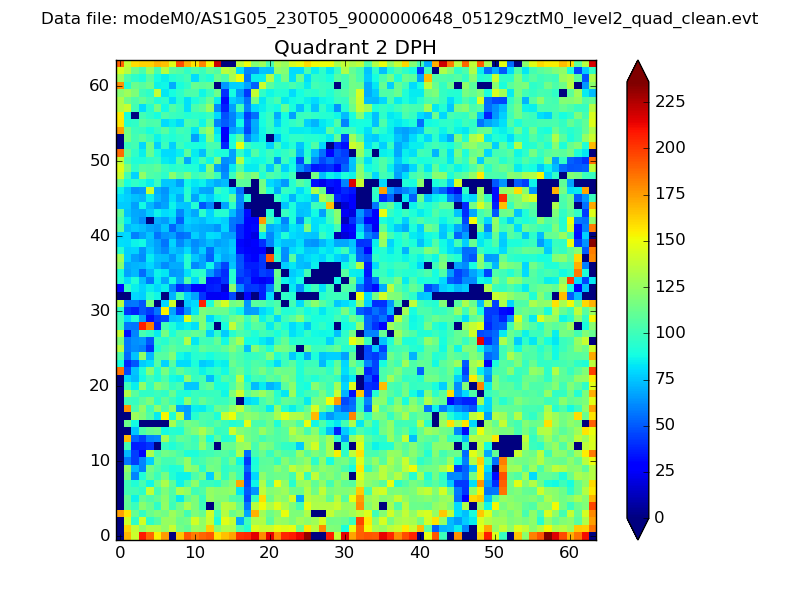 |
Quadrant C |
| Plot type | Count rate plots | Images |
|---|---|---|
| Comparison with Poisson distribution Blue bars denote a histogram of data divided into 1 sec bins. Red curve is a Poisson curve with rate = median count rate of data. |
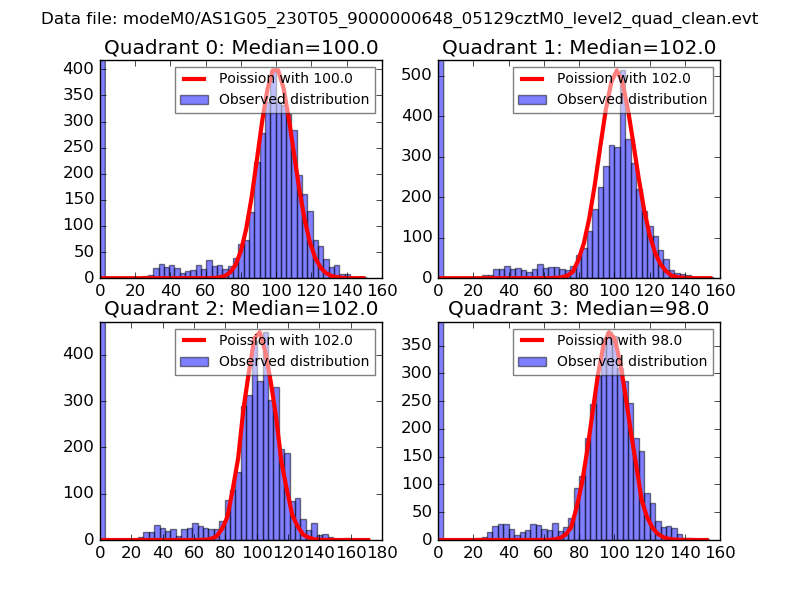 |
 |
| Quadrant-wise count rates Data is divided into 100 sec bins |
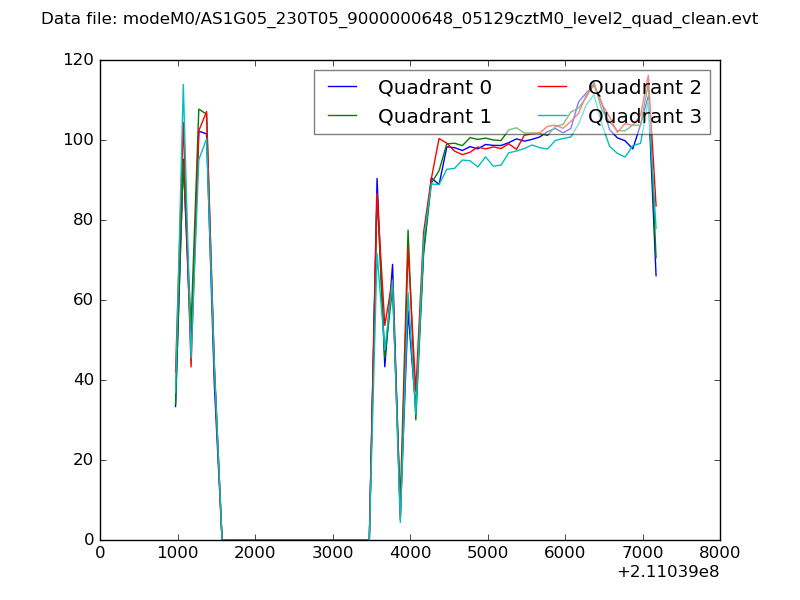 |
|
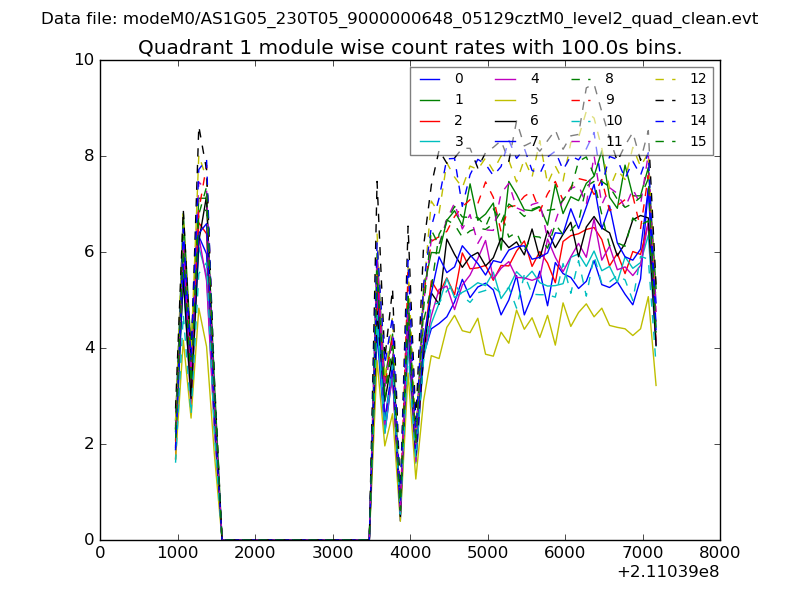
| Module-wise count rates for Quadrant A Data is divided into 100 sec bins |
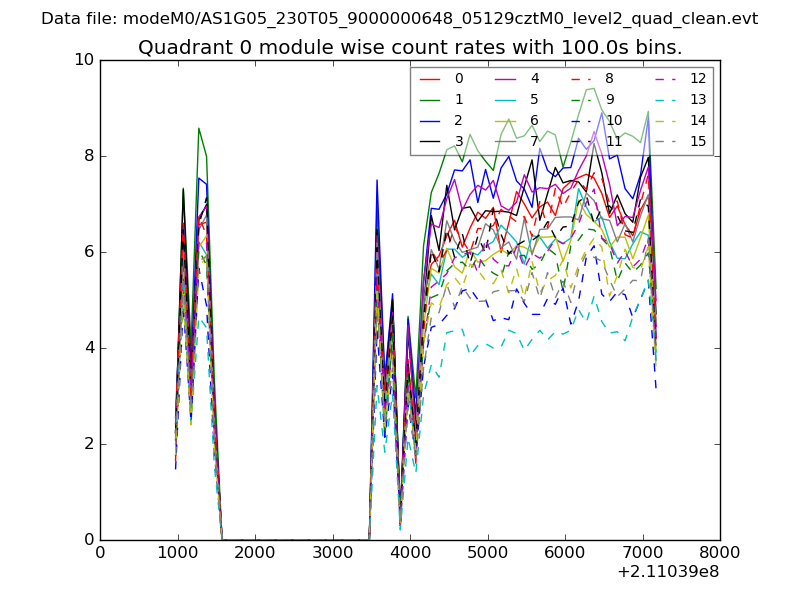 |
 |
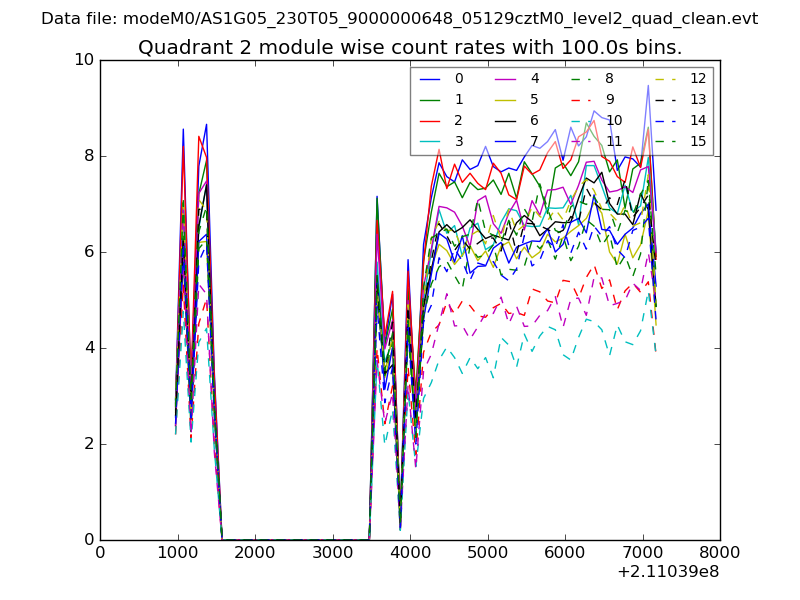
| Module-wise count rates for Quadrant B Data is divided into 100 sec bins |
 |
 |
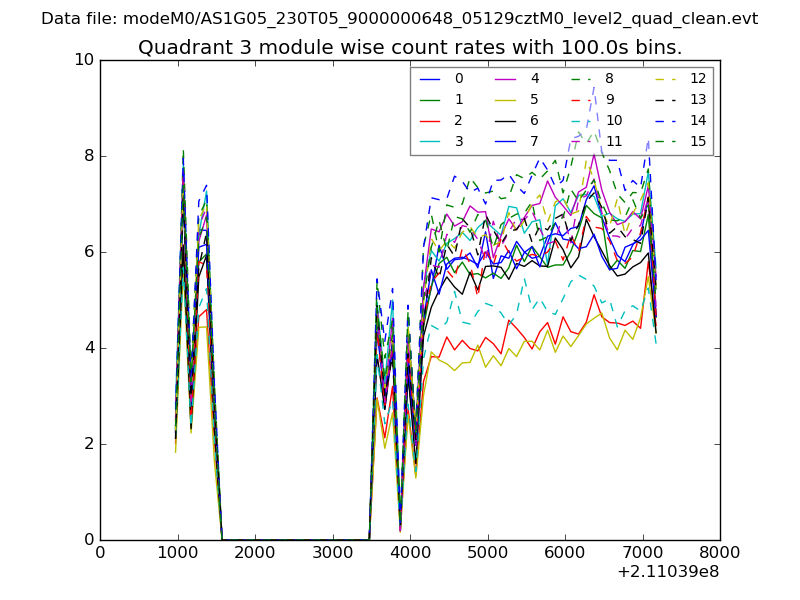
| Module-wise count rates for Quadrant C Data is divided into 100 sec bins |
 |
 |
| Module-wise count rates for Quadrant D Data is divided into 100 sec bins |
 |
 |
| Parameter | Plot |
|---|---|
| CZT HV Monitor | 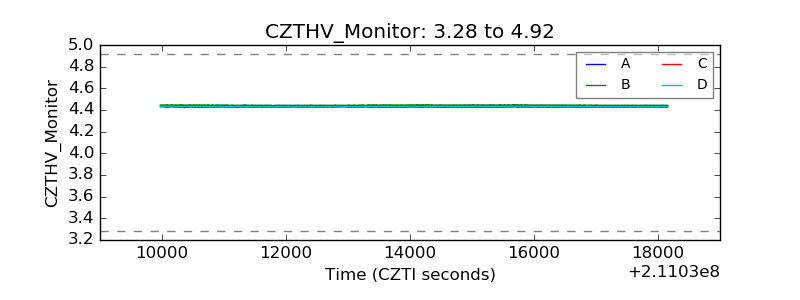 |
| D_VDD | 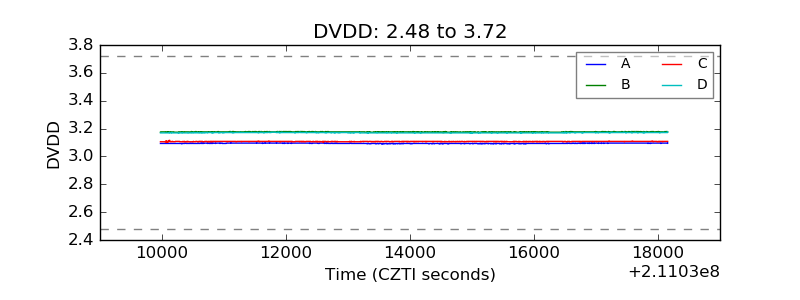 |
| Temperature 1 | 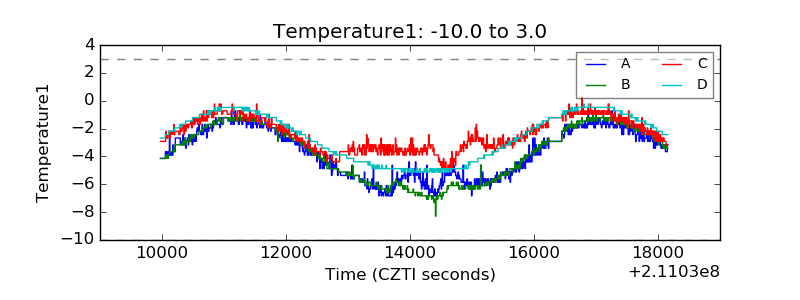 |
| Veto HV Monitor | 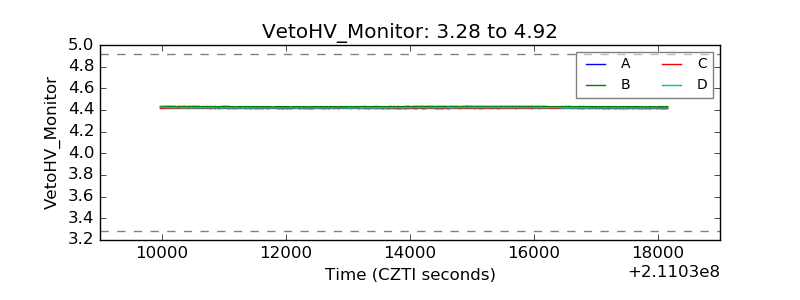 |
| Veto LLD | 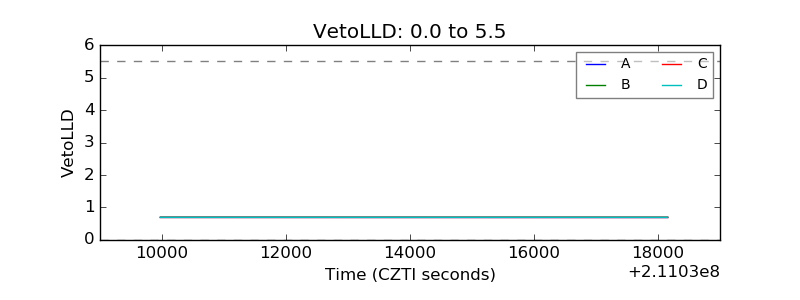 |
| Alpha Counter | 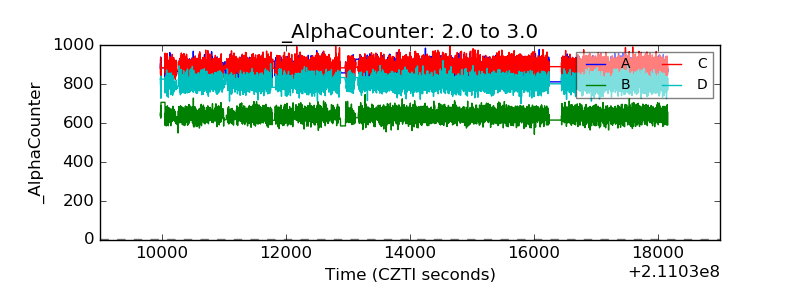 |
| _CPM_Rate |  |
| CZT Counter | 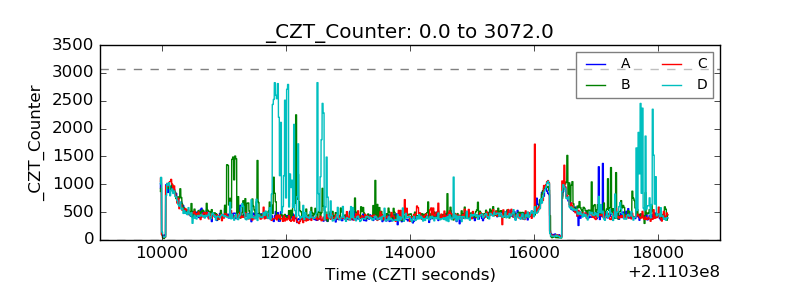 |
| +2.5 Volts monitor |  |
| +5 Volts monitor | 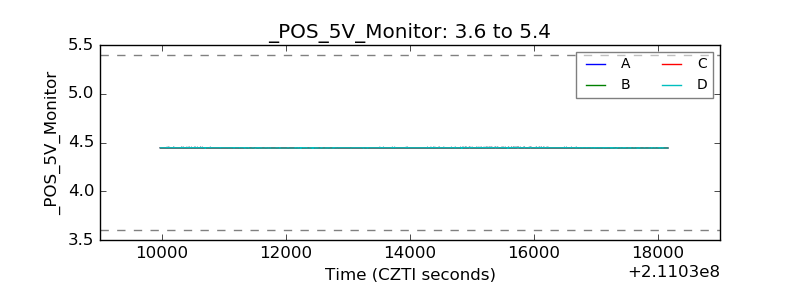 |
| _ROLL_ROT | 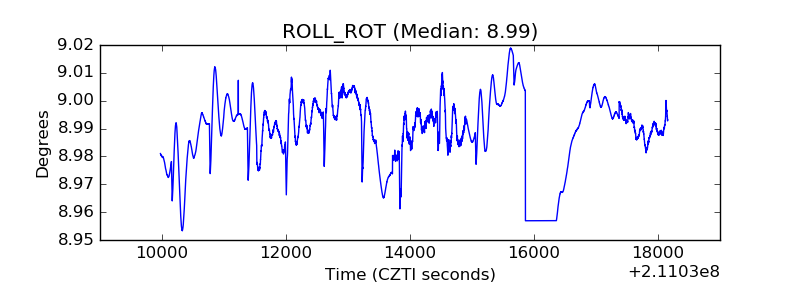 |
| _Roll_DEC | 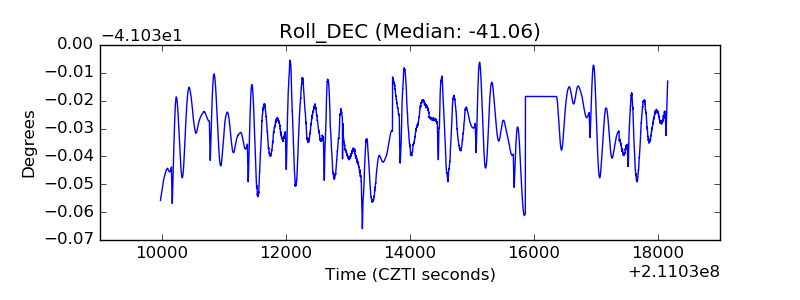 |
| _Roll_RA | 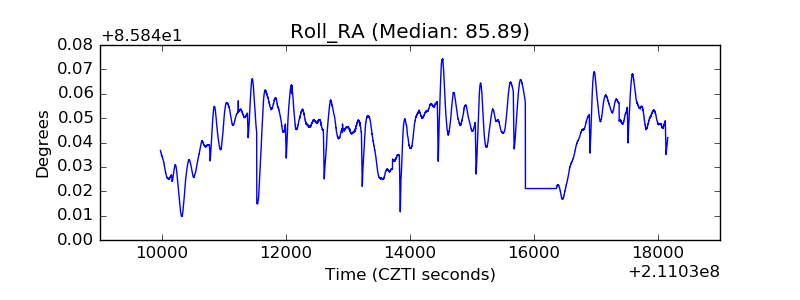 |
| Veto Counter | 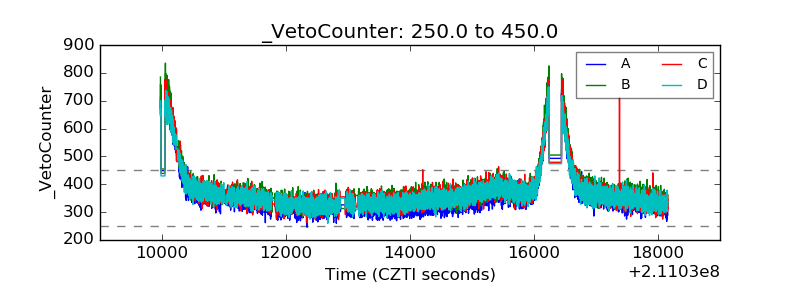 |