| Param | Original file | Final file |
|---|---|---|
| Filename | modeM0/AS1G05_230T05_9000000648_05133cztM0_level2.evt | modeM0/AS1G05_230T05_9000000648_05133cztM0_level2_quad_clean.evt |
| Size (bytes) | 435,591,360 | 84,525,120 |
| Size | 415.4 MB | 80.6 MB |
| Events in quadrant A | 3,045,818 | 520,490 |
| Events in quadrant B | 3,442,034 | 531,295 |
| Events in quadrant C | 3,091,175 | 528,295 |
| Events in quadrant D | 3,148,061 | 503,256 |
| Mode SS | |||
|---|---|---|---|
| Quadrant | BADHDUFLAG | Total packets | Discarded packets |
| A | 0 | 140 | 0 |
| B | 0 | 140 | 0 |
| C | 0 | 140 | 0 |
| D | 0 | 140 | 0 |
| Mode M0 | |||
|---|---|---|---|
| Quadrant | BADHDUFLAG | Total packets | Discarded packets |
| A | 0 | 13951 | 3 |
| B | 0 | 14903 | 4 |
| C | 0 | 13961 | 4 |
| D | 0 | 14432 | 2 |
| Mode M9 | |||
|---|---|---|---|
| Quadrant | BADHDUFLAG | Total packets | Discarded packets |
| A | 0 | 18 | 0 |
| B | 0 | 18 | 0 |
| C | 0 | 18 | 0 |
| D | 0 | 18 | 0 |
| Quadrant | Total seconds | Saturated seconds | Saturation percentage |
|---|---|---|---|
| A | 6838 | 55 | 0.804329% |
| B | 6837 | 82 | 1.199356% |
| C | 6837 | 42 | 0.614305% |
| D | 6838 | 66 | 0.965195% |
Noise dominated data is calculated using 1-second bins in cleaned event files. If a bin has >2000 counts, and if more than 50% of those come from <1% of pixels, then it is considered to be noise-dominated and hence unusable.
| Quadrant | # 1 sec bins | Bins with >0 counts | Bins with >2000 counts | High rate bins dominated by noise | Noise dominated (total time) | Noise dominated (detector-on time) | Marked lightcurve |
|---|---|---|---|---|---|---|---|
| A | 8603 | 6840 | 2 | 2 | 0.02% | 0.03% |  |
| B | 8603 | 6840 | 4 | 4 | 0.05% | 0.06% |  |
| C | 8603 | 6840 | 4 | 4 | 0.05% | 0.06% | 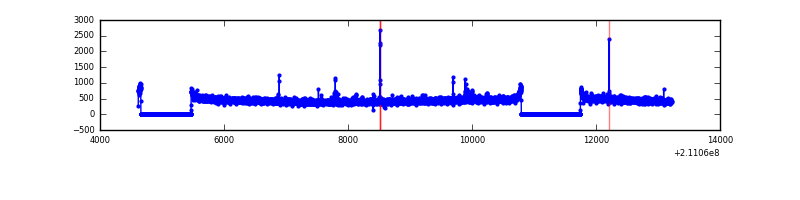 |
| D | 8603 | 6840 | 15 | 15 | 0.17% | 0.22% | 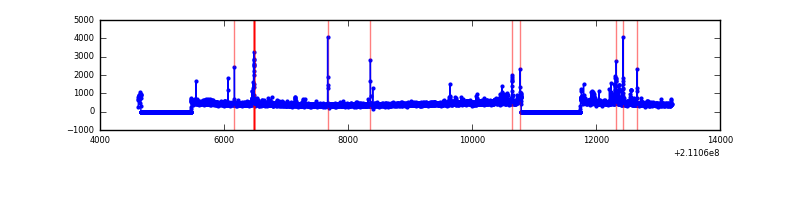 |
Top three noisy pixels from each quadrant. If the there are fewer than three noisy pixels in the level2.evt file, extra rows are filled as -1
| Pixel properties | Quadrant properties | ||||||
|---|---|---|---|---|---|---|---|
| Quadrant | DetID | PixID | Counts | Sigma | Mean | Median | Sigma |
| A | 0 | 50 | 38163 | 233.3 | 779 | 761 | 160.3 |
| A | 0 | 226 | 8109 | 45.83 | 779 | 761 | 160.3 |
| A | 12 | 194 | 7638 | 42.9 | 779 | 761 | 160.3 |
| B | 15 | 204 | 216846 | 1406.87 | 794 | 775 | 153.6 |
| B | 4 | 80 | 44687 | 285.92 | 794 | 775 | 153.6 |
| B | 10 | 16 | 26436 | 167.08 | 794 | 775 | 153.6 |
| C | 1 | 16 | 27371 | 148.5 | 767 | 772 | 179.1 |
| C | 12 | 4 | 19648 | 105.38 | 767 | 772 | 179.1 |
| C | 9 | 16 | 19535 | 104.75 | 767 | 772 | 179.1 |
| D | 2 | 33 | 149924 | 796.19 | 760 | 736 | 187.4 |
| D | 8 | 195 | 50329 | 264.67 | 760 | 736 | 187.4 |
| D | 2 | 14 | 33089 | 172.66 | 760 | 736 | 187.4 |
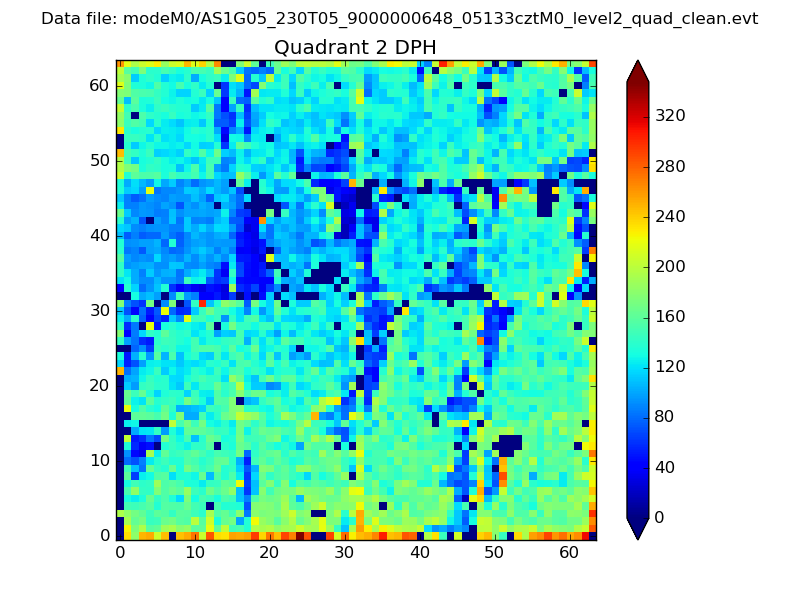
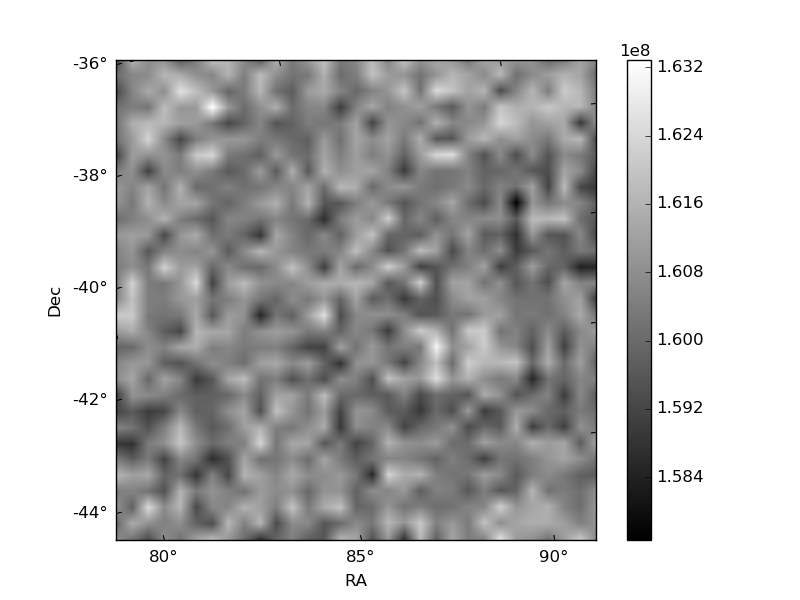
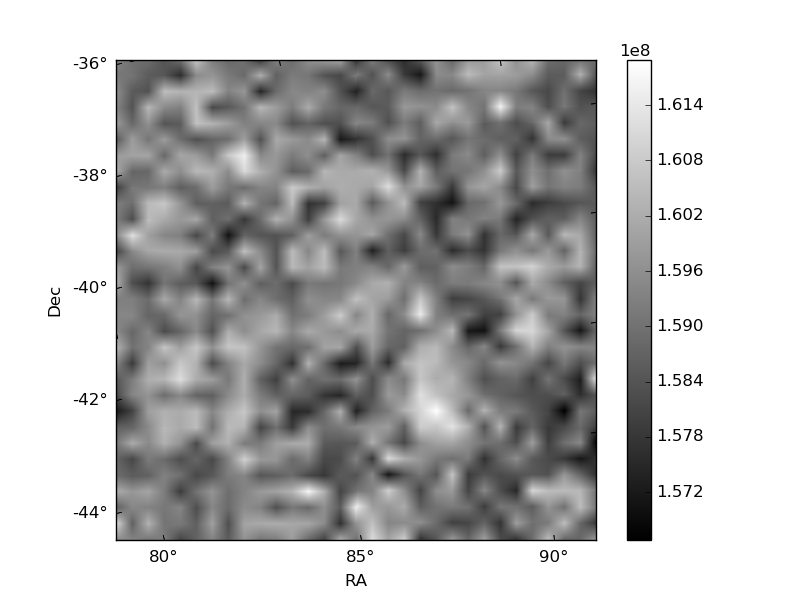
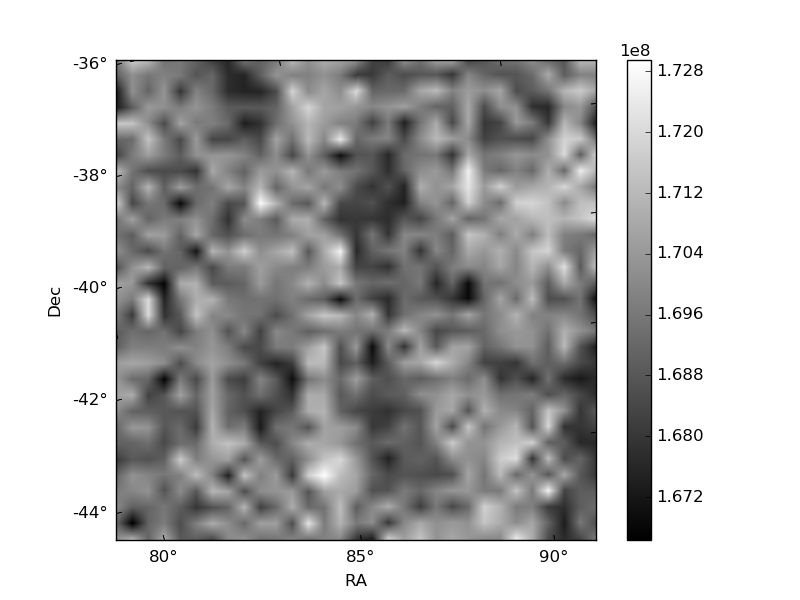
Histogram calculated using DETX and DETY for each event in the final _common_clean file
| Quadrant A | 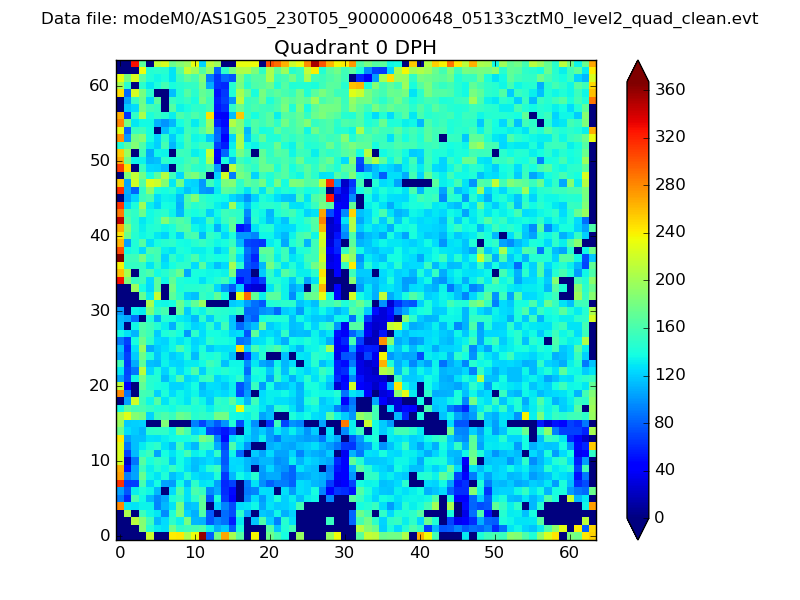 |
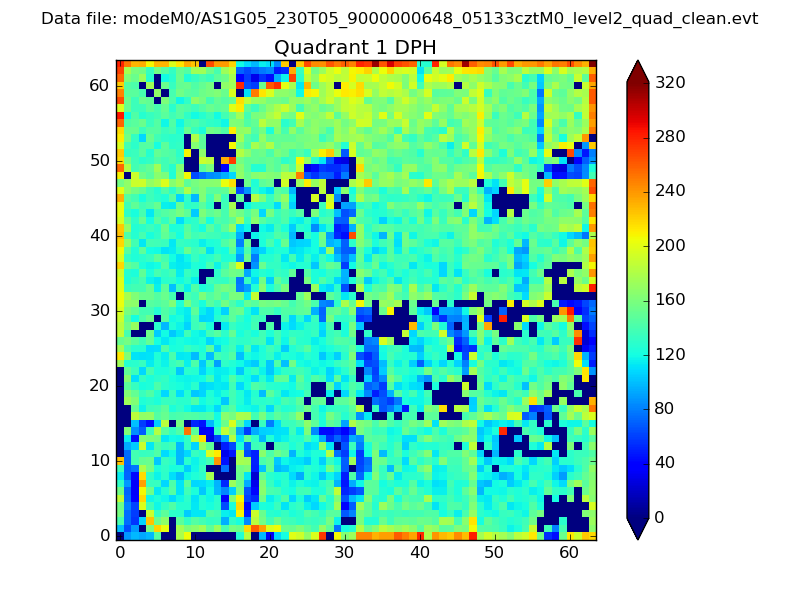 |
Quadrant B |
|---|---|---|---|
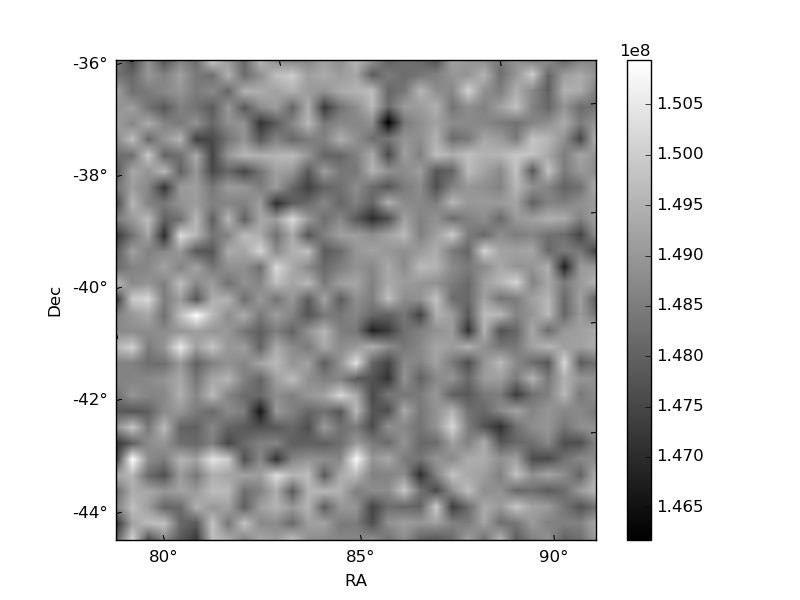
| Quadrant D | 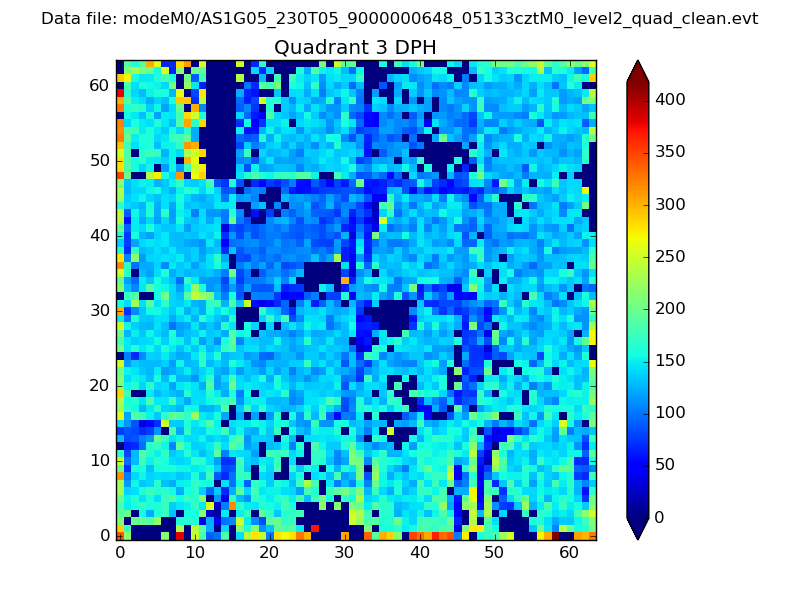 |
 |
Quadrant C |
| Plot type | Count rate plots | Images |
|---|---|---|
| Comparison with Poisson distribution Blue bars denote a histogram of data divided into 1 sec bins. Red curve is a Poisson curve with rate = median count rate of data. |
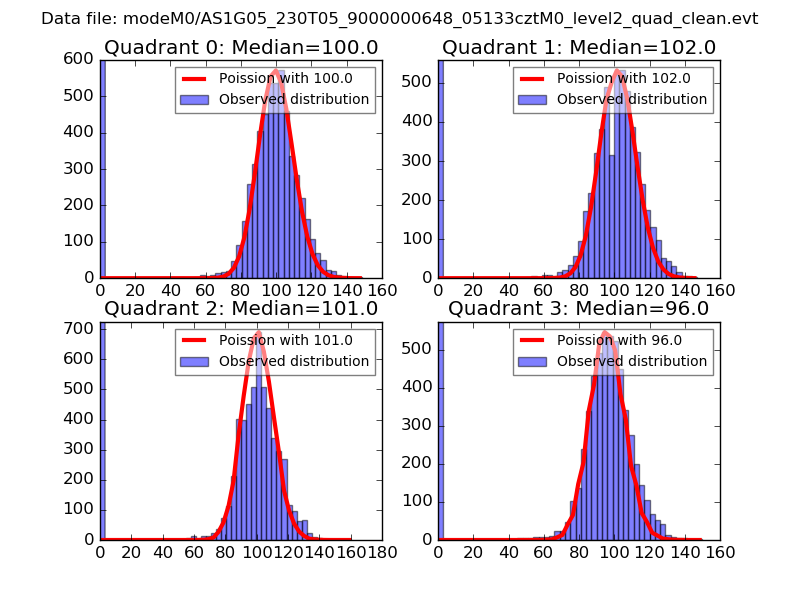 |
 |
| Quadrant-wise count rates Data is divided into 100 sec bins |
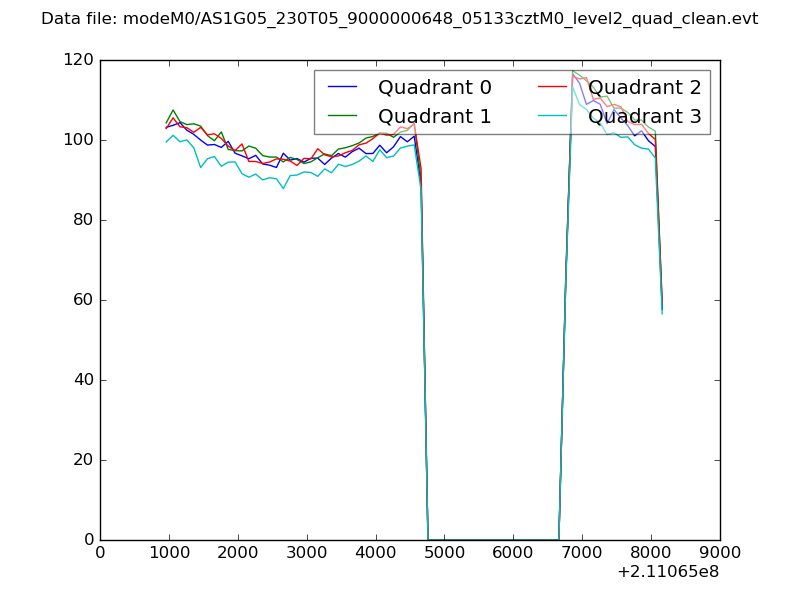 |
|
| Module-wise count rates for Quadrant A Data is divided into 100 sec bins |
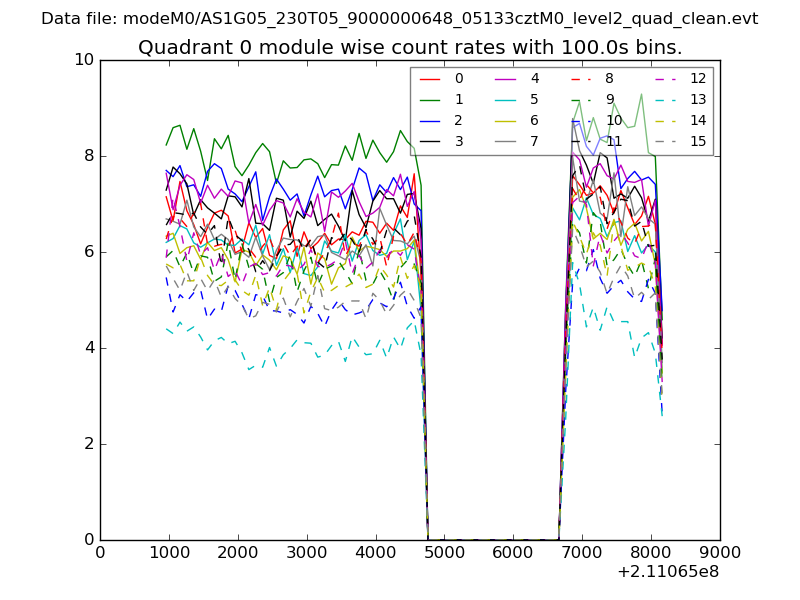 |
 |
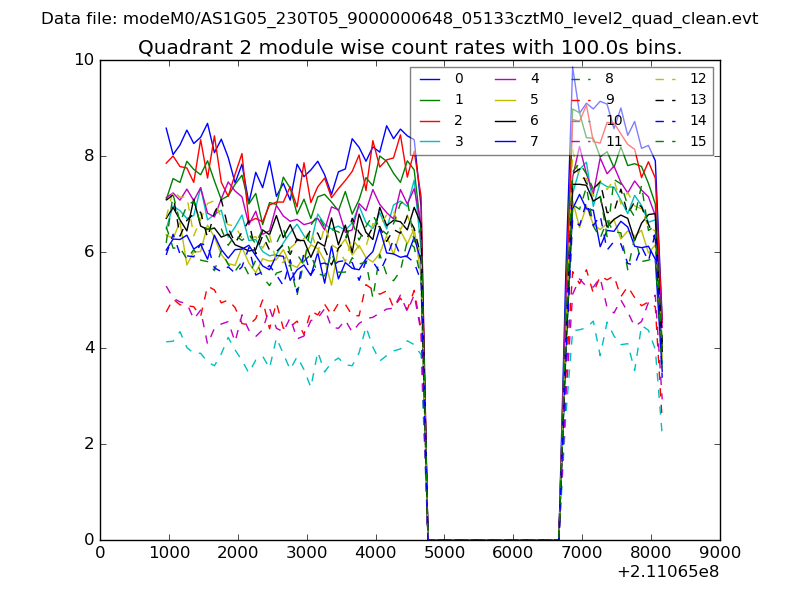
| Module-wise count rates for Quadrant B Data is divided into 100 sec bins |
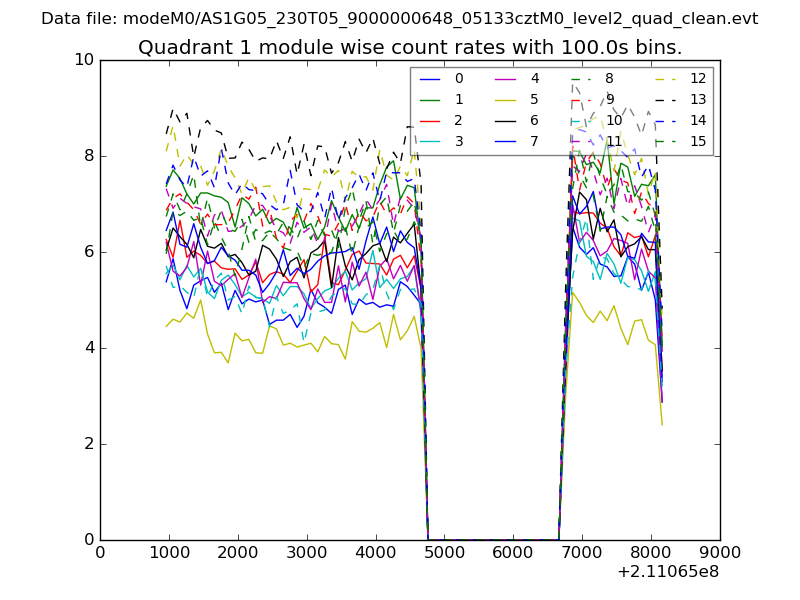 |
 |
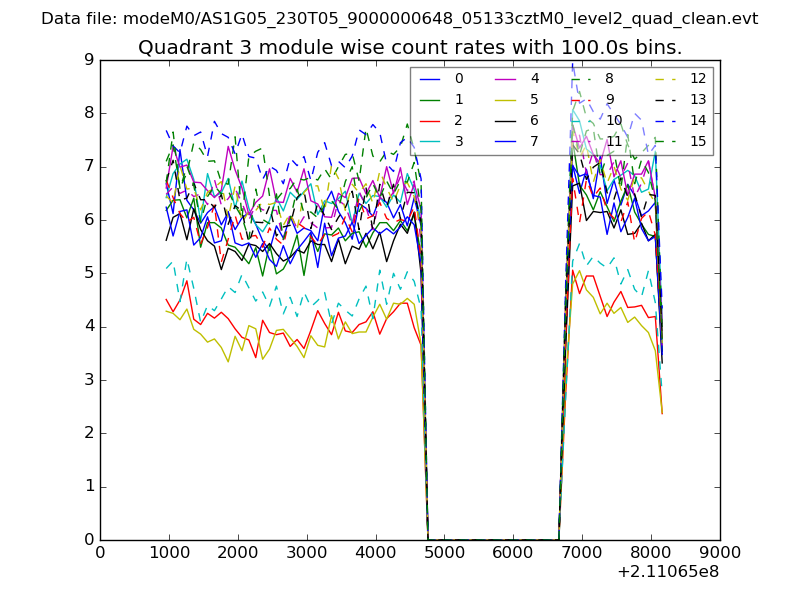
| Module-wise count rates for Quadrant C Data is divided into 100 sec bins |
 |
 |
| Module-wise count rates for Quadrant D Data is divided into 100 sec bins |
 |
 |
| Parameter | Plot |
|---|---|
| CZT HV Monitor | 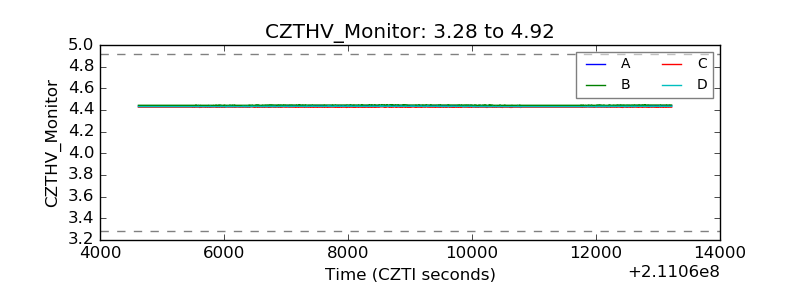 |
| D_VDD | 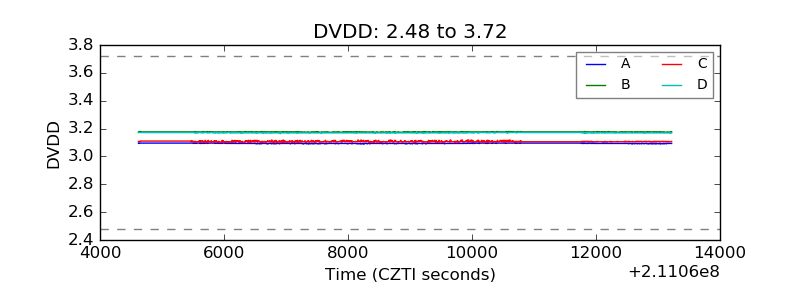 |
| Temperature 1 | 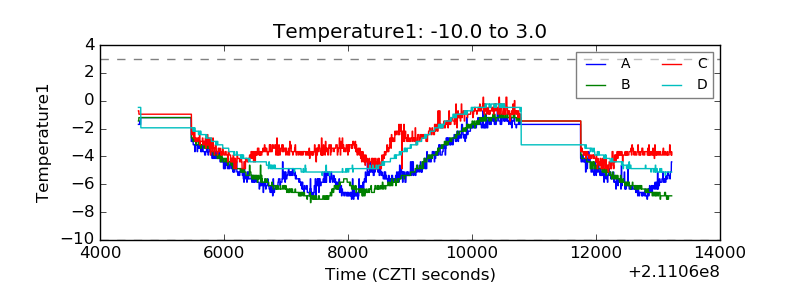 |
| Veto HV Monitor | 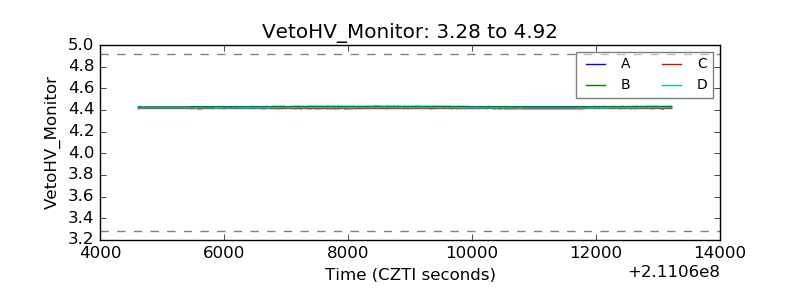 |
| Veto LLD | 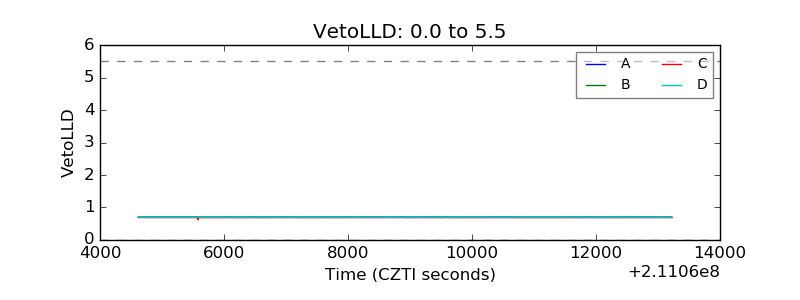 |
| Alpha Counter | 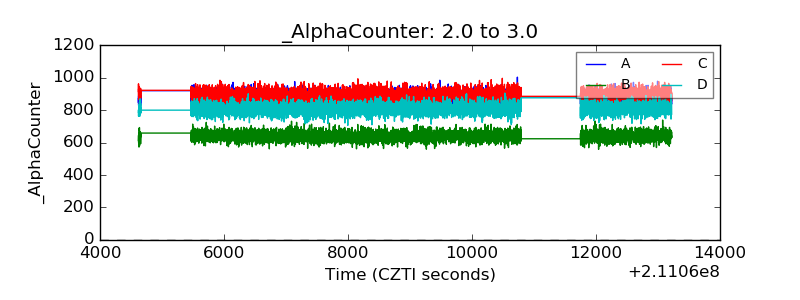 |
| _CPM_Rate | 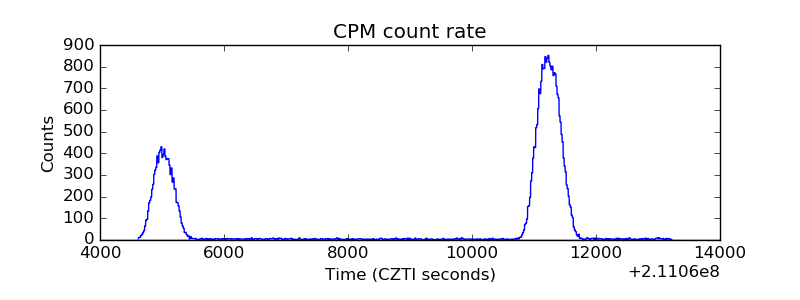 |
| CZT Counter | 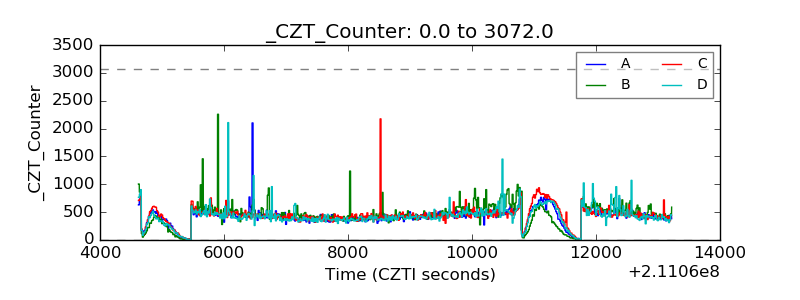 |
| +2.5 Volts monitor |  |
| +5 Volts monitor |  |
| _ROLL_ROT | 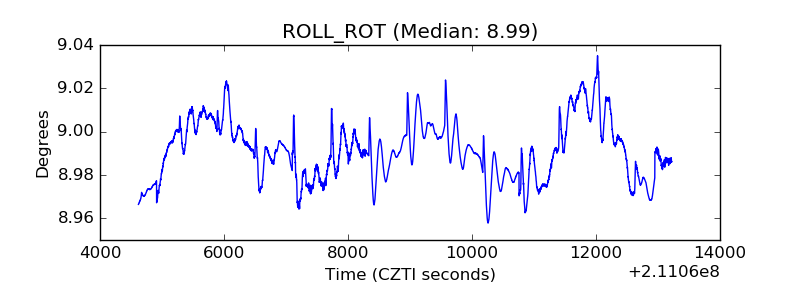 |
| _Roll_DEC | 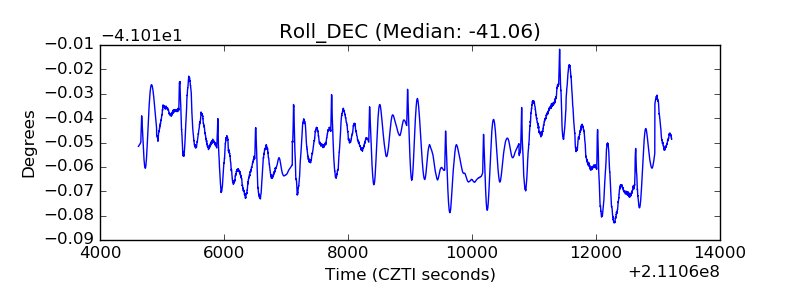 |
| _Roll_RA | 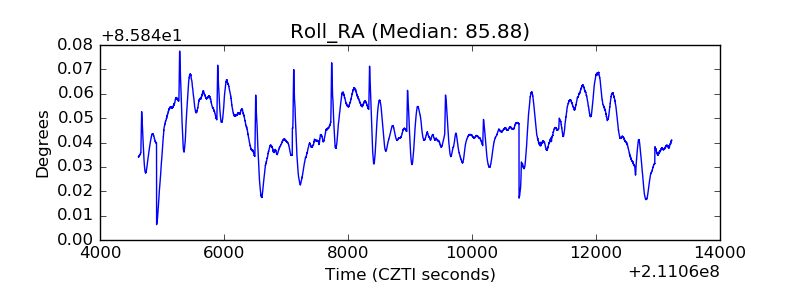 |
| Veto Counter | 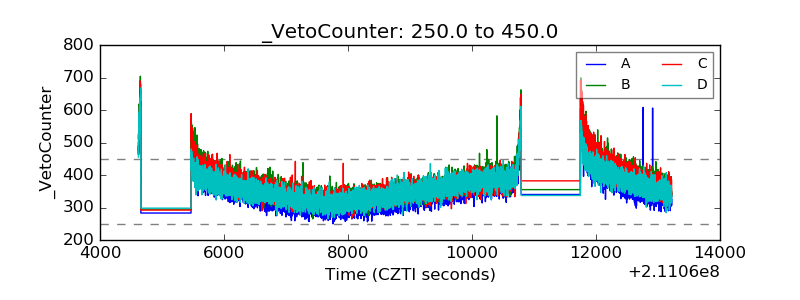 |