| Param | Original file | Final file |
|---|---|---|
| Filename | modeM0/AS1G05_230T05_9000000648_05136cztM0_level2.evt | modeM0/AS1G05_230T05_9000000648_05136cztM0_level2_quad_clean.evt |
| Size (bytes) | 41,869,440 | 9,561,600 |
| Size | 39.9 MB | 9.1 MB |
| Events in quadrant A | 275,237 | 60,289 |
| Events in quadrant B | 312,730 | 63,741 |
| Events in quadrant C | 278,684 | 63,419 |
| Events in quadrant D | 364,073 | 58,873 |
| Mode SS | |||
|---|---|---|---|
| Quadrant | BADHDUFLAG | Total packets | Discarded packets |
| A | 0 | 10 | 0 |
| B | 0 | 10 | 0 |
| C | 0 | 10 | 0 |
| D | 0 | 10 | 0 |
| Mode M0 | |||
|---|---|---|---|
| Quadrant | BADHDUFLAG | Total packets | Discarded packets |
| A | 0 | 1102 | 1 |
| B | 0 | 1245 | 1 |
| C | 0 | 1107 | 1 |
| D | 0 | 1424 | 1 |
| Mode M9 | |||
|---|---|---|---|
| Quadrant | BADHDUFLAG | Total packets | Discarded packets |
| A | 0 | 7 | 0 |
| B | 0 | 7 | 0 |
| C | 0 | 7 | 0 |
| D | 0 | 8 | 0 |
| Quadrant | Total seconds | Saturated seconds | Saturation percentage |
|---|---|---|---|
| A | 498 | 4 | 0.803213% |
| B | 498 | 7 | 1.405622% |
| C | 498 | 8 | 1.606426% |
| D | 498 | 12 | 2.409639% |
Noise dominated data is calculated using 1-second bins in cleaned event files. If a bin has >2000 counts, and if more than 50% of those come from <1% of pixels, then it is considered to be noise-dominated and hence unusable.
| Quadrant | # 1 sec bins | Bins with >0 counts | Bins with >2000 counts | High rate bins dominated by noise | Noise dominated (total time) | Noise dominated (detector-on time) | Marked lightcurve |
|---|---|---|---|---|---|---|---|
| A | 498 | 498 | 1 | 1 | 0.20% | 0.20% | 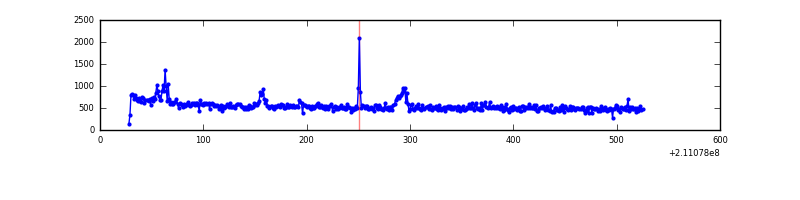 |
| B | 498 | 498 | 3 | 3 | 0.60% | 0.60% | 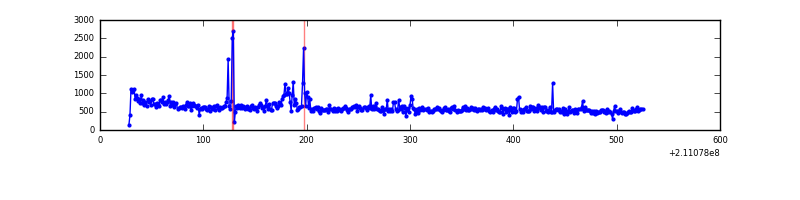 |
| C | 498 | 498 | 0 | 0 | 0.00% | 0.00% | 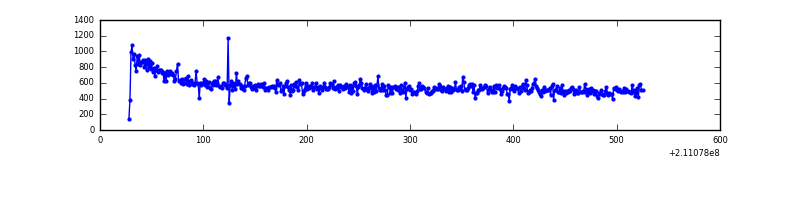 |
| D | 498 | 498 | 6 | 6 | 1.20% | 1.20% | 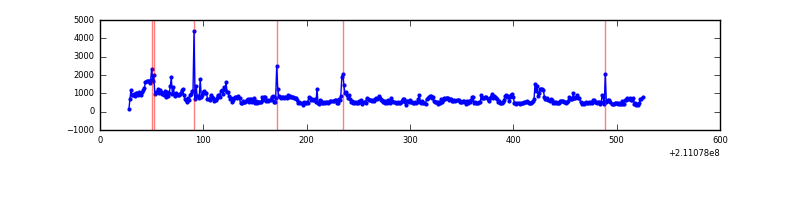 |
Top three noisy pixels from each quadrant. If the there are fewer than three noisy pixels in the level2.evt file, extra rows are filled as -1
| Pixel properties | Quadrant properties | ||||||
|---|---|---|---|---|---|---|---|
| Quadrant | DetID | PixID | Counts | Sigma | Mean | Median | Sigma |
| A | 0 | 50 | 10815 | 664.44 | 67 | 66 | 16.2 |
| A | 0 | 149 | 3189 | 193.05 | 67 | 66 | 16.2 |
| A | 0 | 226 | 912 | 52.29 | 67 | 66 | 16.2 |
| B | 4 | 80 | 15493 | 986.38 | 70 | 68 | 15.6 |
| B | 15 | 204 | 8650 | 548.79 | 70 | 68 | 15.6 |
| B | 0 | 219 | 7821 | 495.78 | 70 | 68 | 15.6 |
| C | 1 | 16 | 11892 | 662.85 | 68 | 68 | 17.8 |
| C | 14 | 67 | 611 | 30.44 | 68 | 68 | 17.8 |
| C | 13 | 61 | 544 | 26.68 | 68 | 68 | 17.8 |
| D | 8 | 195 | 55428 | 3014.02 | 66 | 63 | 18.4 |
| D | 2 | 33 | 38286 | 2080.83 | 66 | 63 | 18.4 |
| D | 2 | 14 | 12448 | 674.23 | 66 | 63 | 18.4 |
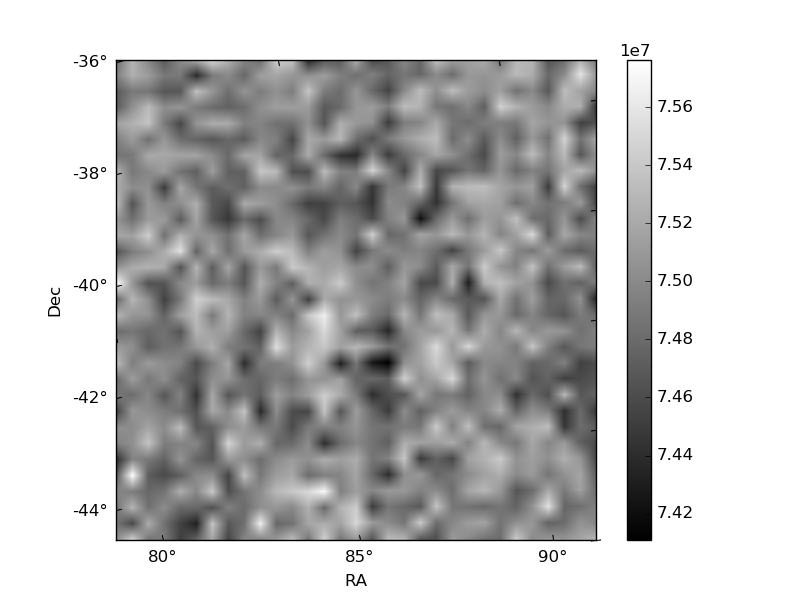
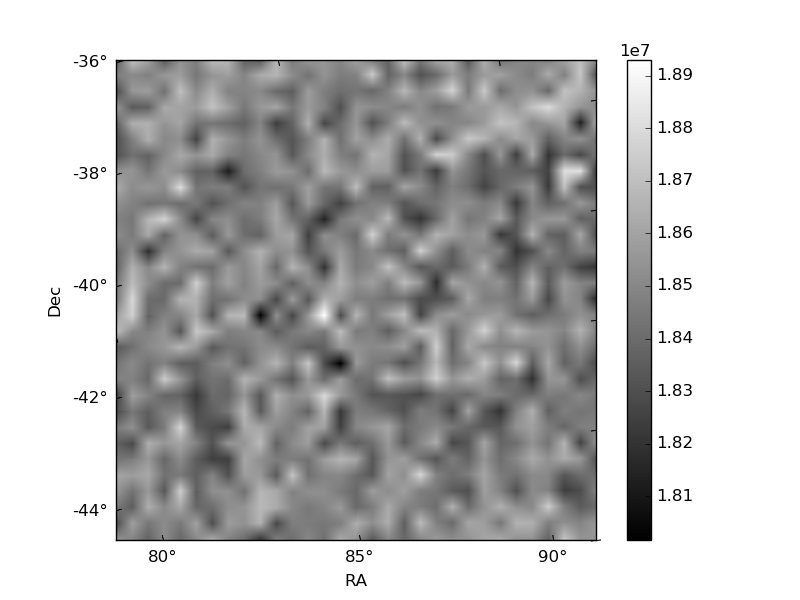
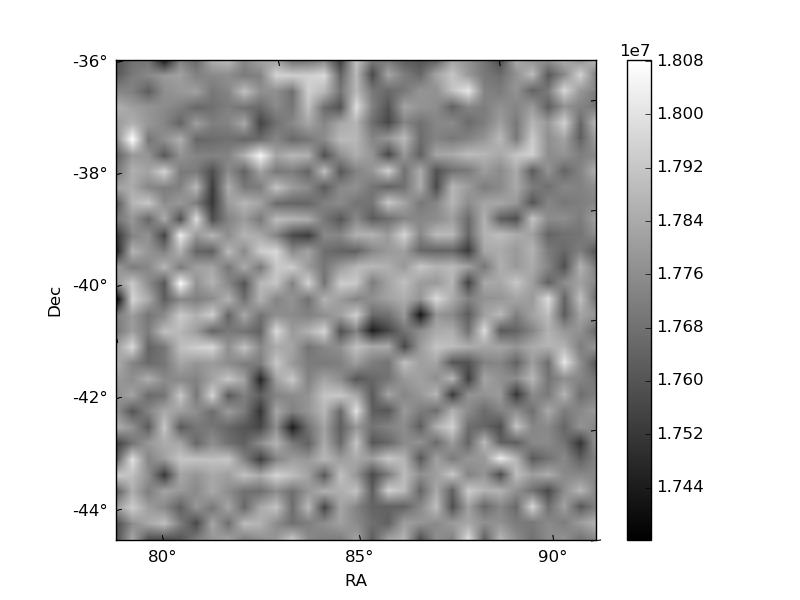
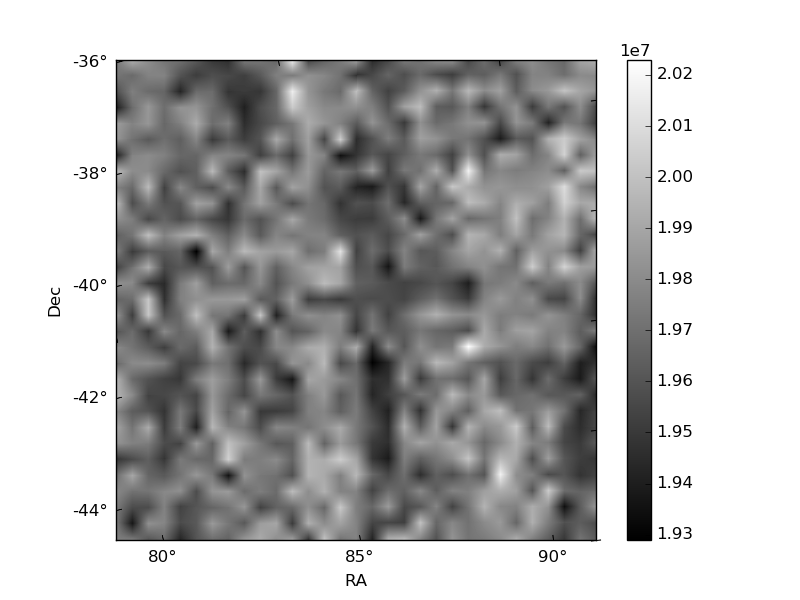
Histogram calculated using DETX and DETY for each event in the final _common_clean file
| Quadrant A | 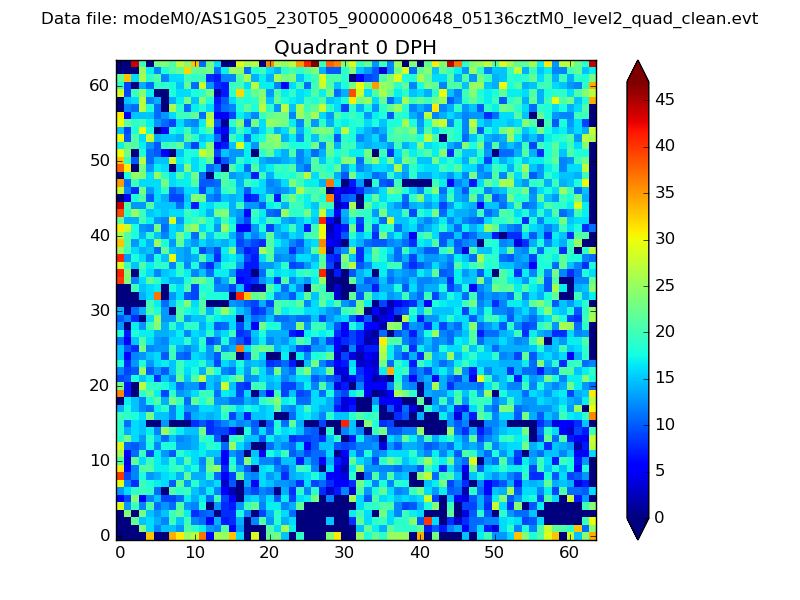 |
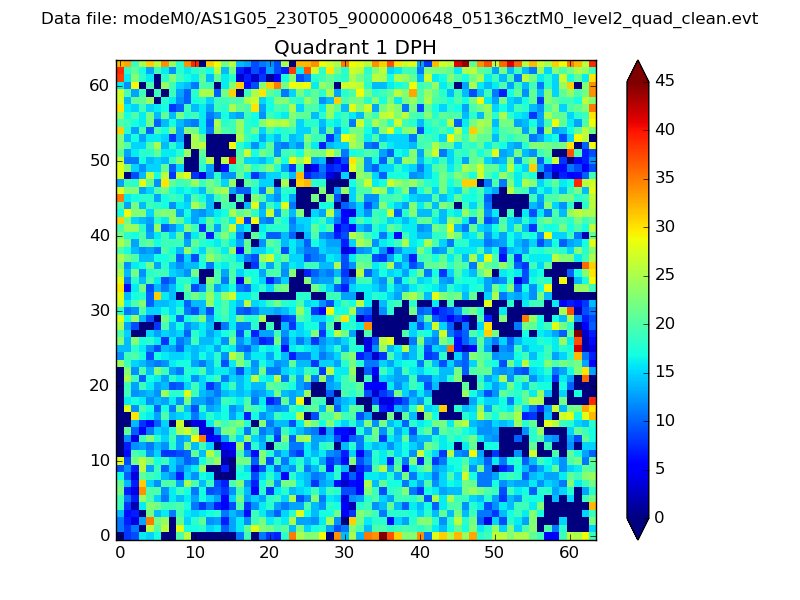 |
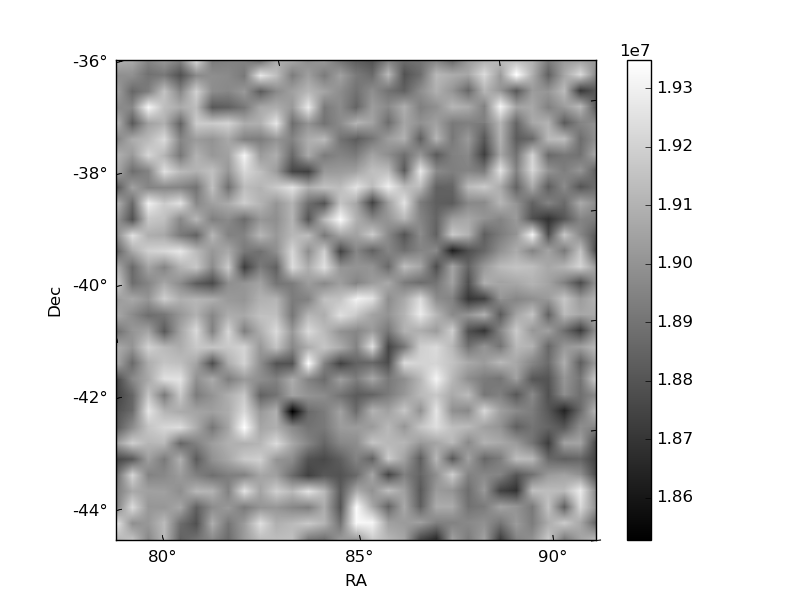
Quadrant B |
|---|---|---|---|
| Quadrant D | 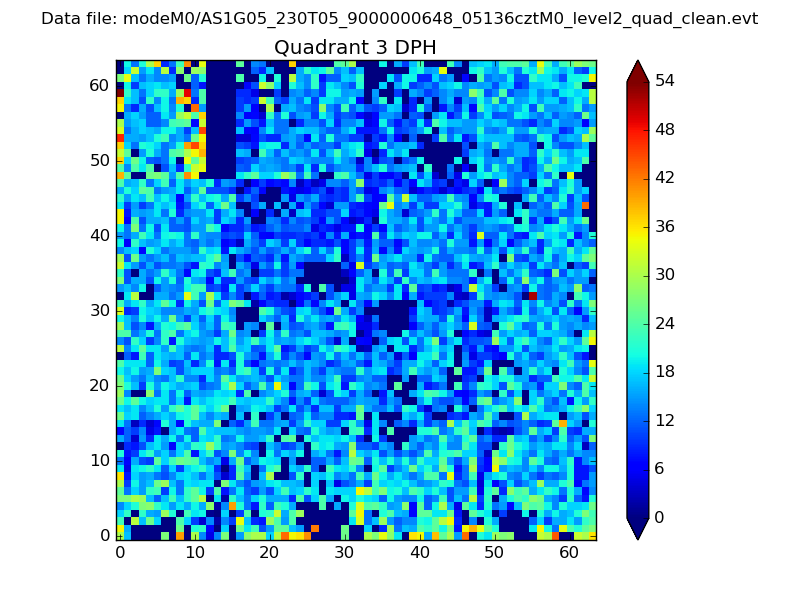 |
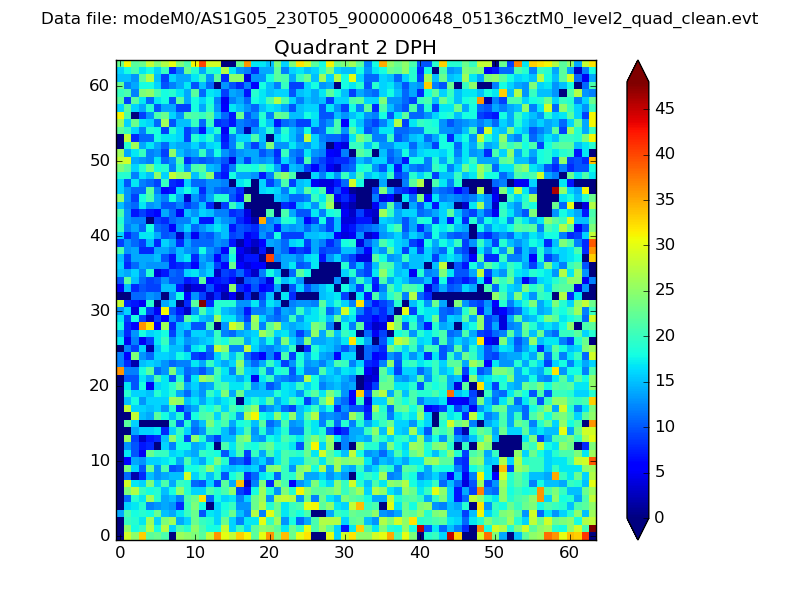 |
Quadrant C |
| Plot type | Count rate plots | Images |
|---|---|---|
| Comparison with Poisson distribution Blue bars denote a histogram of data divided into 1 sec bins. Red curve is a Poisson curve with rate = median count rate of data. |
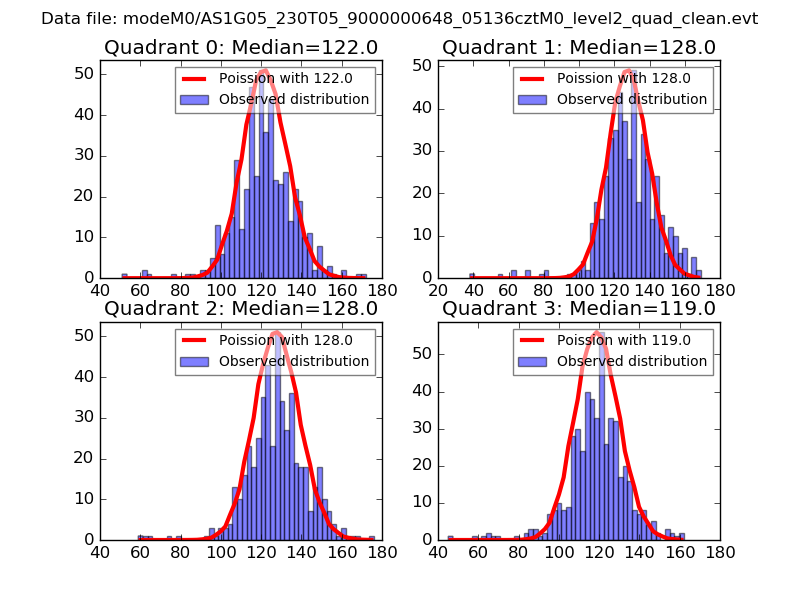 |
 |
| Quadrant-wise count rates Data is divided into 100 sec bins |
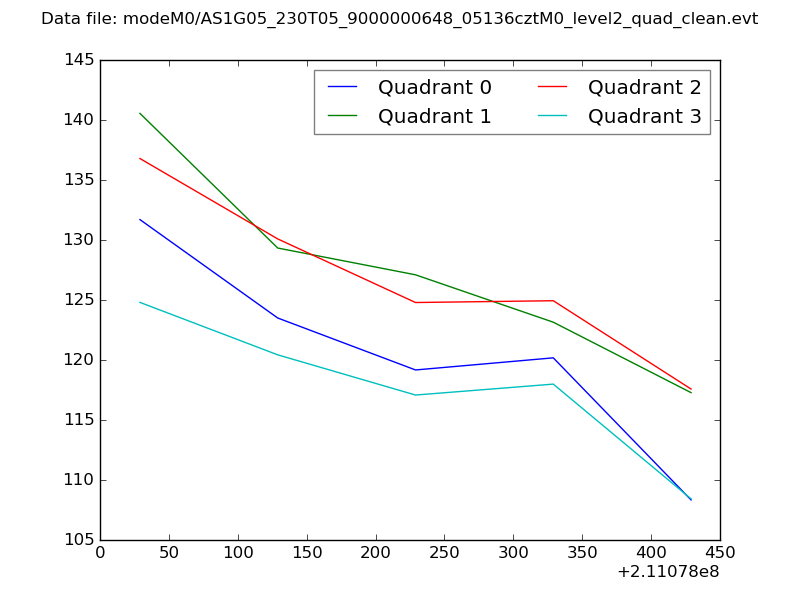 |
|
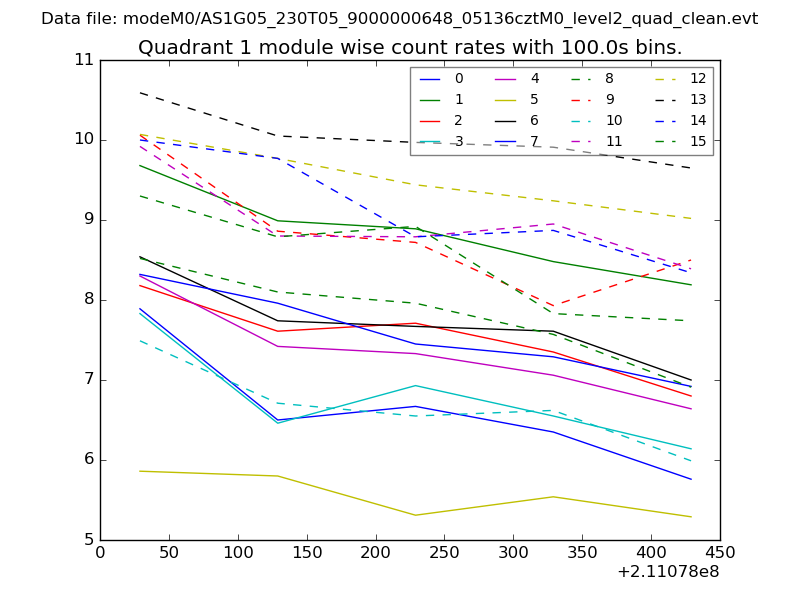
| Module-wise count rates for Quadrant A Data is divided into 100 sec bins |
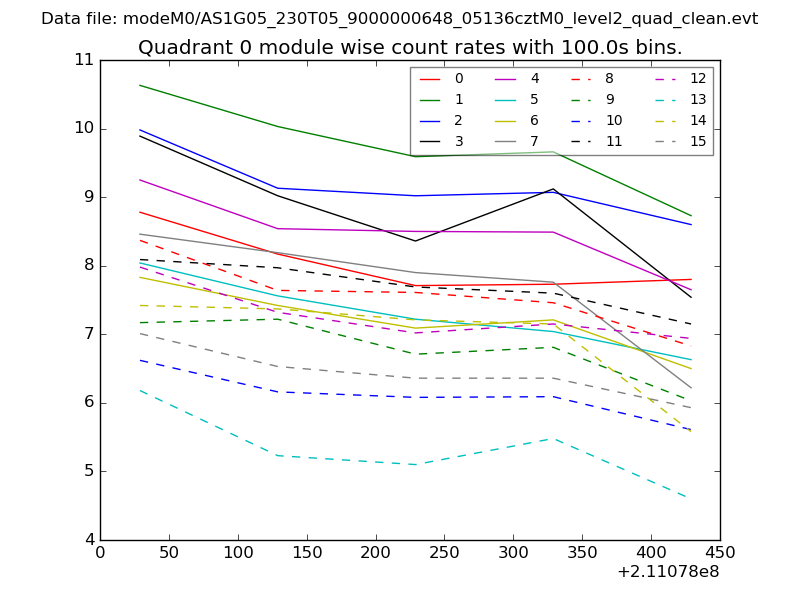 |
 |
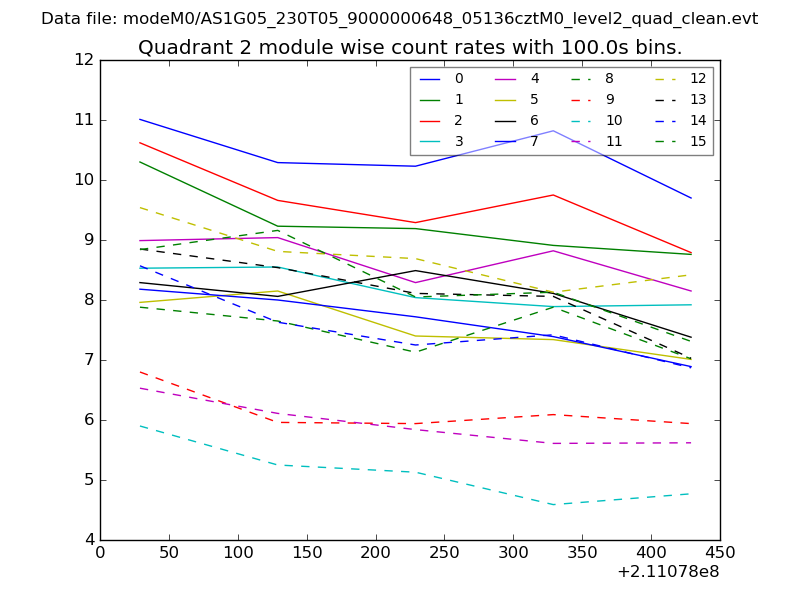
| Module-wise count rates for Quadrant B Data is divided into 100 sec bins |
 |
 |
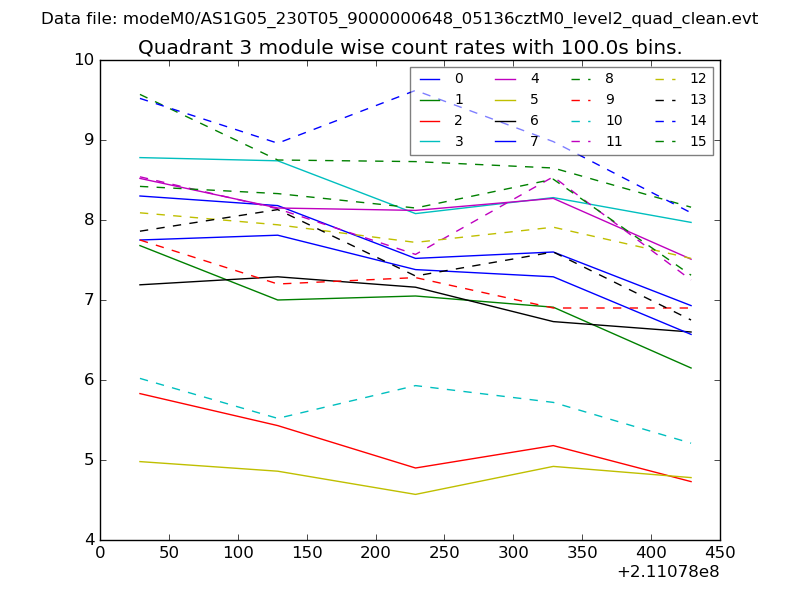
| Module-wise count rates for Quadrant C Data is divided into 100 sec bins |
 |
 |
| Module-wise count rates for Quadrant D Data is divided into 100 sec bins |
 |
 |
| Parameter | Plot |
|---|---|
| CZT HV Monitor | 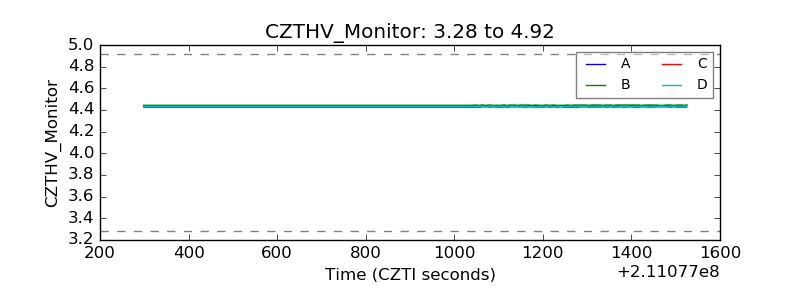 |
| D_VDD |  |
| Temperature 1 | 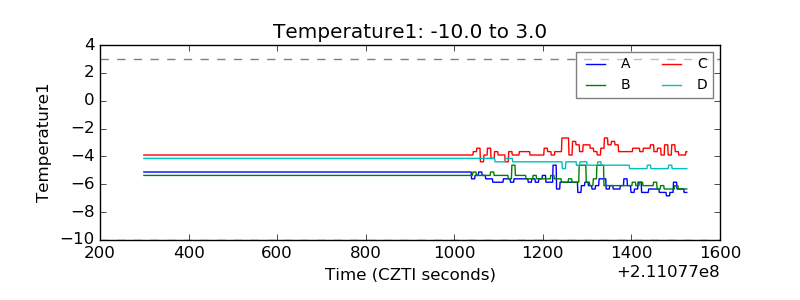 |
| Veto HV Monitor | 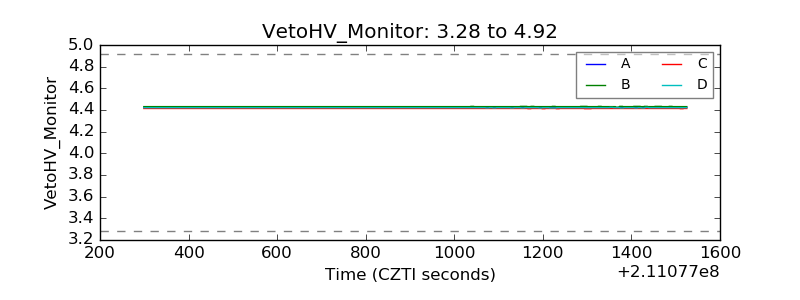 |
| Veto LLD | 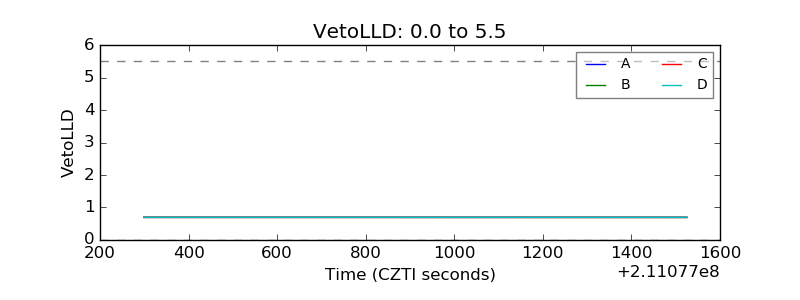 |
| Alpha Counter | 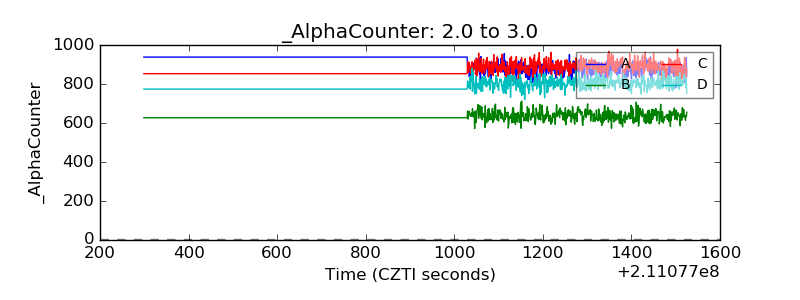 |
| _CPM_Rate | 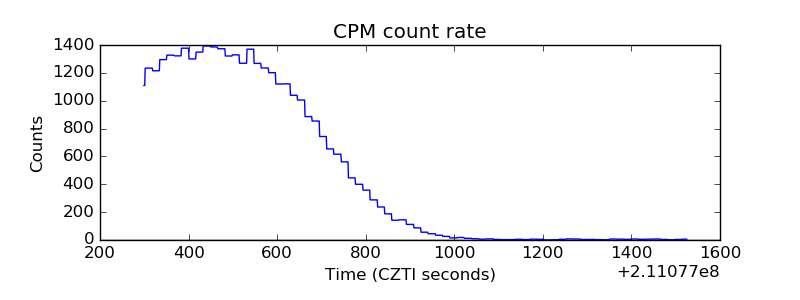 |
| CZT Counter | 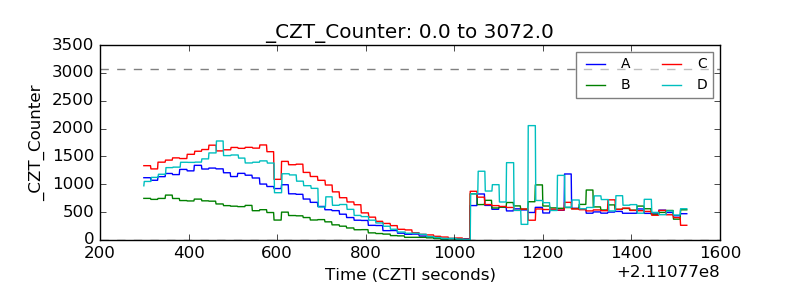 |
| +2.5 Volts monitor |  |
| +5 Volts monitor |  |
| _ROLL_ROT | 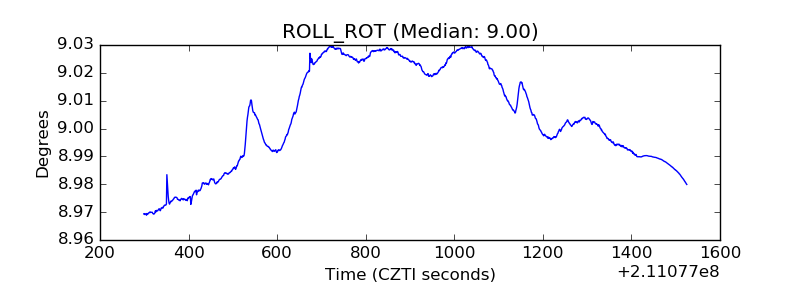 |
| _Roll_DEC | 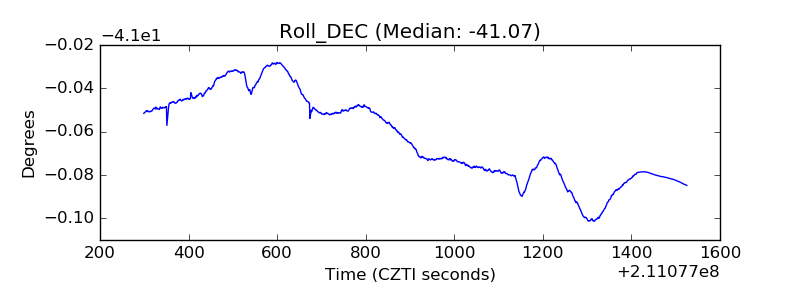 |
| _Roll_RA | 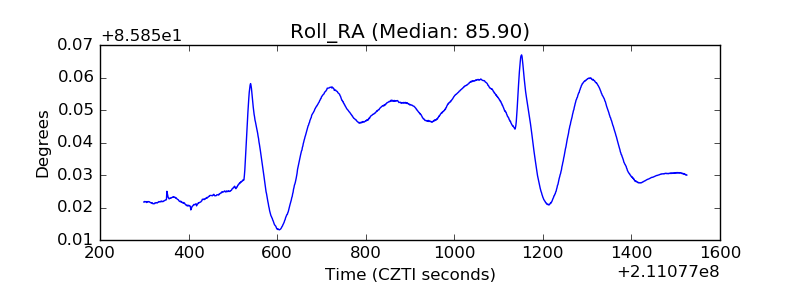 |
| Veto Counter | 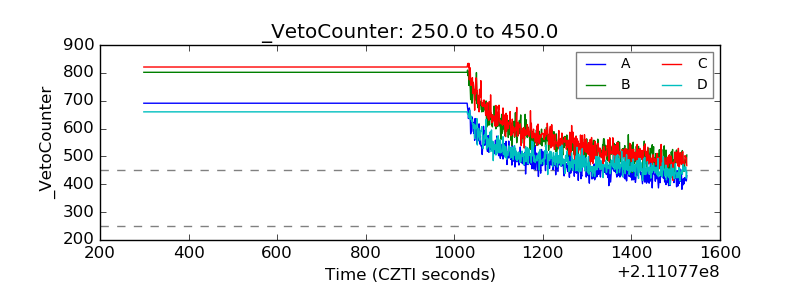 |