| Param | Original file | Final file |
|---|---|---|
| Filename | modeM0/AS1G05_102T01_9000000650cztM0_level2.fits | modeM0/AS1G05_102T01_9000000650cztM0_level2_quad_clean.evt |
| Size (bytes) | 801,028,800 | 789,943,680 |
| Size | 763.9 MB | 753.3 MB |
| Events in quadrant A | 4,834,014 | 4,692,262 |
| Events in quadrant B | 4,641,932 | 4,669,709 |
| Events in quadrant C | 4,777,700 | 4,559,336 |
| Events in quadrant D | 4,108,298 | 4,106,336 |
| Mode M0 | |||
|---|---|---|---|
| Quadrant | BADHDUFLAG | Total packets | Discarded packets |
| A | 0 | 177910 | 0 |
| B | 0 | 193340 | 0 |
| C | 0 | 177032 | 0 |
| D | 0 | 202406 | 0 |
| Mode M9 | |||
|---|---|---|---|
| Quadrant | BADHDUFLAG | Total packets | Discarded packets |
| A | 0 | 143 | 0 |
| B | 0 | 143 | 0 |
| C | 0 | 143 | 0 |
| D | 0 | 143 | 0 |
| Mode SS | |||
|---|---|---|---|
| Quadrant | BADHDUFLAG | Total packets | Discarded packets |
| A | 0 | 1756 | 0 |
| B | 0 | 1756 | 0 |
| C | 0 | 1756 | 0 |
| D | 0 | 1756 | 0 |
| Quadrant | Total seconds | Saturated seconds | Saturation percentage |
|---|---|---|---|
| A | 86013 | 972 | 1.130062% |
| B | 86013 | 1525 | 1.772988% |
| C | 86016 | 683 | 0.794038% |
| D | 86017 | 2343 | 2.723880% |
Noise dominated data is calculated using 1-second bins in cleaned event files. If a bin has >2000 counts, and if more than 50% of those come from <1% of pixels, then it is considered to be noise-dominated and hence unusable.
| Quadrant | # 1 sec bins | Bins with >0 counts | Bins with >2000 counts | High rate bins dominated by noise | Noise dominated (total time) | Noise dominated (detector-on time) | Marked lightcurve |
|---|---|---|---|---|---|---|---|
| A | 100311 | 86017 | 0 | 0 | 0.00% | 0.00% | 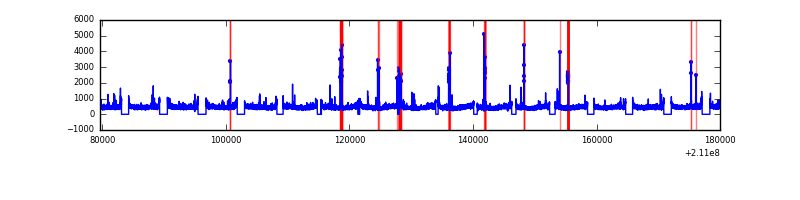 |
| B | 100311 | 86019 | 0 | 0 | 0.00% | 0.00% |  |
| C | 100311 | 86020 | 0 | 0 | 0.00% | 0.00% |  |
| D | 100311 | 85998 | 0 | 0 | 0.00% | 0.00% |  |
Top three noisy pixels from each quadrant. If the there are fewer than three noisy pixels in the level2.evt file, extra rows are filled as -1
| Pixel properties | Quadrant properties | ||||||
|---|---|---|---|---|---|---|---|
| Quadrant | DetID | PixID | Counts | Sigma | Mean | Median | Sigma |
| A | 14 | 188 | 4866 | 11.46 | 1254 | 1166 | 322.8 |
| A | 0 | 29 | 4609 | 10.67 | 1254 | 1166 | 322.8 |
| A | 14 | 204 | 4214 | 9.44 | 1254 | 1166 | 322.8 |
| B | 2 | 9 | 4036 | 11.62 | 1227 | 1165 | 247.0 |
| B | 12 | 226 | 3313 | 8.7 | 1227 | 1165 | 247.0 |
| B | 5 | 128 | 3222 | 8.33 | 1227 | 1165 | 247.0 |
| C | 1 | 80 | 3478 | 6.92 | 1261 | 1165 | 334.2 |
| C | 1 | 81 | 3415 | 6.73 | 1261 | 1165 | 334.2 |
| C | 12 | 241 | 3296 | 6.38 | 1261 | 1165 | 334.2 |
| D | 11 | 82 | 3224 | 6.93 | 1168 | 1062 | 312.2 |
| D | 3 | 14 | 3177 | 6.77 | 1168 | 1062 | 312.2 |
| D | 6 | 231 | 3060 | 6.4 | 1168 | 1062 | 312.2 |
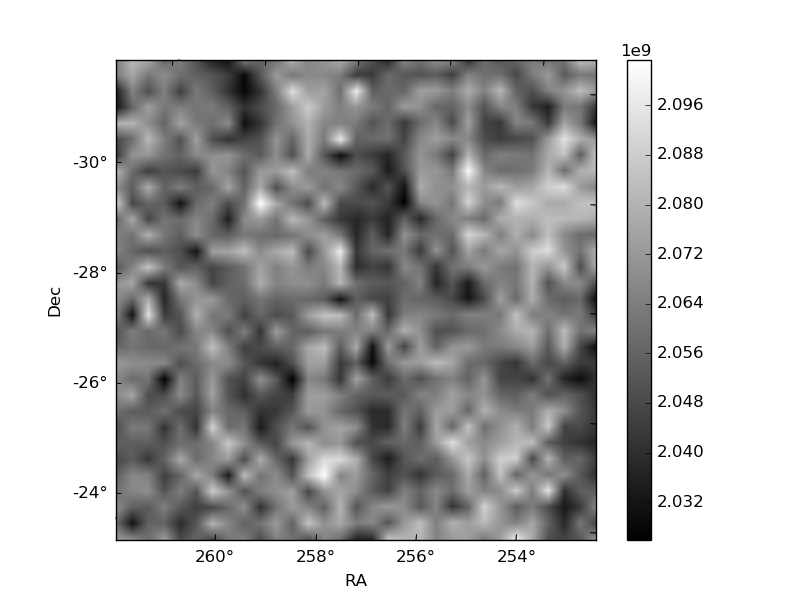
Histogram calculated using DETX and DETY for each event in the final _common_clean file
| Quadrant A |  |
 |
Quadrant B |
|---|---|---|---|
| Quadrant D |  |
 |
Quadrant C |
| Plot type | Count rate plots | Images |
|---|---|---|
| Comparison with Poisson distribution Blue bars denote a histogram of data divided into 1 sec bins. Red curve is a Poisson curve with rate = median count rate of data. |
 |
 |
| Quadrant-wise count rates Data is divided into 100 sec bins |
 |
|
| Module-wise count rates for Quadrant A Data is divided into 100 sec bins |
 |
 |
| Module-wise count rates for Quadrant B Data is divided into 100 sec bins |
 |
 |
| Module-wise count rates for Quadrant C Data is divided into 100 sec bins |
 |
 |
| Module-wise count rates for Quadrant D Data is divided into 100 sec bins |
 |
 |
| Parameter | Plot |
|---|---|
| CZT HV Monitor | 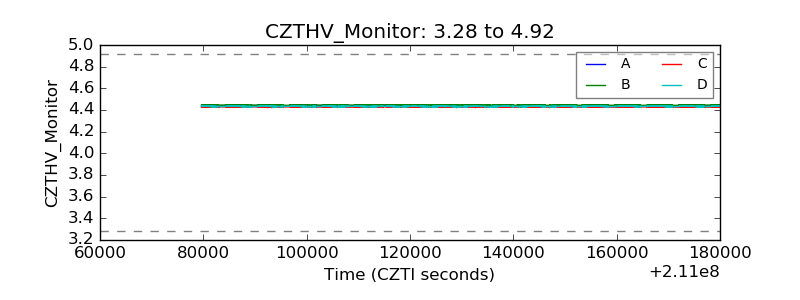 |
| D_VDD |  |
| Temperature 1 |  |
| Veto HV Monitor |  |
| Veto LLD |  |
| Alpha Counter |  |
| _CPM_Rate |  |
| CZT Counter |  |
| +2.5 Volts monitor |  |
| +5 Volts monitor |  |
| _ROLL_ROT |  |
| _Roll_DEC |  |
| _Roll_RA |  |
| Veto Counter |  |