| Param | Original file | Final file |
|---|---|---|
| Filename | modeM0/AS1G05_102T01_9000000650_05136cztM0_level2.evt | modeM0/AS1G05_102T01_9000000650_05136cztM0_level2_quad_clean.evt |
| Size (bytes) | 359,873,280 | 46,707,840 |
| Size | 343.2 MB | 44.5 MB |
| Events in quadrant A | 2,377,187 | 264,562 |
| Events in quadrant B | 3,057,132 | 267,486 |
| Events in quadrant C | 2,343,760 | 268,742 |
| Events in quadrant D | 2,775,194 | 257,389 |
| Mode M0 | |||
|---|---|---|---|
| Quadrant | BADHDUFLAG | Total packets | Discarded packets |
| A | 0 | 10435 | 2 |
| B | 0 | 12314 | 1 |
| C | 0 | 10416 | 1 |
| D | 0 | 11599 | 1 |
| Mode M9 | |||
|---|---|---|---|
| Quadrant | BADHDUFLAG | Total packets | Discarded packets |
| A | 0 | 11 | 0 |
| B | 0 | 11 | 0 |
| C | 0 | 11 | 0 |
| D | 0 | 11 | 0 |
| Mode SS | |||
|---|---|---|---|
| Quadrant | BADHDUFLAG | Total packets | Discarded packets |
| A | 0 | 104 | 0 |
| B | 0 | 104 | 0 |
| C | 0 | 104 | 0 |
| D | 0 | 104 | 0 |
| Quadrant | Total seconds | Saturated seconds | Saturation percentage |
|---|---|---|---|
| A | 5071 | 42 | 0.828239% |
| B | 5071 | 143 | 2.819957% |
| C | 5071 | 48 | 0.946559% |
| D | 5071 | 51 | 1.005719% |
Noise dominated data is calculated using 1-second bins in cleaned event files. If a bin has >2000 counts, and if more than 50% of those come from <1% of pixels, then it is considered to be noise-dominated and hence unusable.
| Quadrant | # 1 sec bins | Bins with >0 counts | Bins with >2000 counts | High rate bins dominated by noise | Noise dominated (total time) | Noise dominated (detector-on time) | Marked lightcurve |
|---|---|---|---|---|---|---|---|
| A | 6231 | 5072 | 0 | 0 | 0.00% | 0.00% | 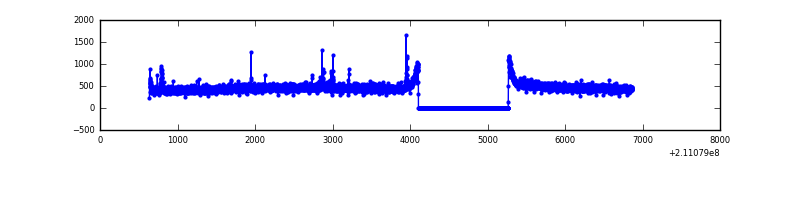 |
| B | 6231 | 5072 | 55 | 55 | 0.88% | 1.08% | 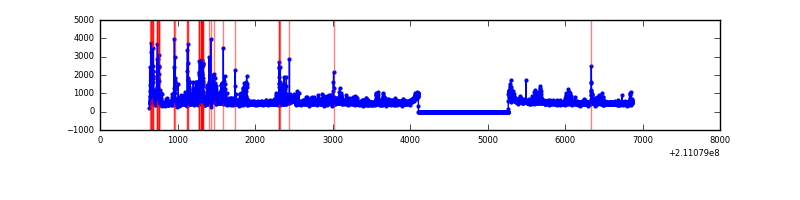 |
| C | 6231 | 5072 | 0 | 0 | 0.00% | 0.00% | 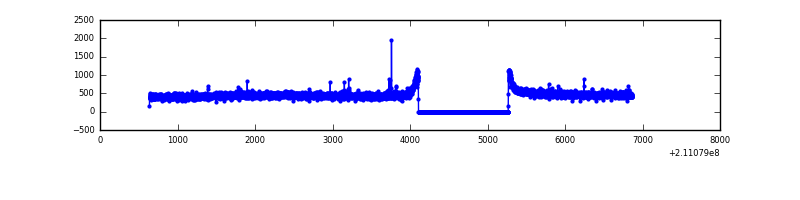 |
| D | 6231 | 5072 | 1 | 1 | 0.02% | 0.02% | 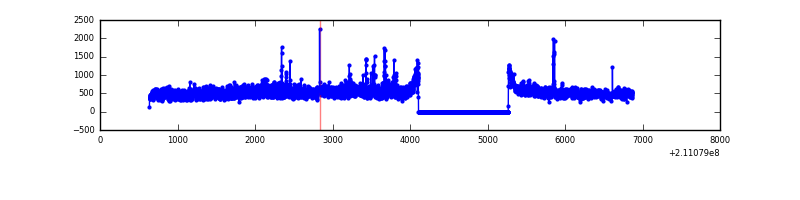 |
Top three noisy pixels from each quadrant. If the there are fewer than three noisy pixels in the level2.evt file, extra rows are filled as -1
| Pixel properties | Quadrant properties | ||||||
|---|---|---|---|---|---|---|---|
| Quadrant | DetID | PixID | Counts | Sigma | Mean | Median | Sigma |
| A | 0 | 149 | 34907 | 274.53 | 607 | 593 | 125.0 |
| A | 0 | 226 | 8948 | 66.84 | 607 | 593 | 125.0 |
| A | 12 | 194 | 5962 | 42.96 | 607 | 593 | 125.0 |
| B | 10 | 16 | 403729 | 3461.39 | 612 | 599 | 116.5 |
| B | 4 | 80 | 159039 | 1360.41 | 612 | 599 | 116.5 |
| B | 15 | 204 | 94050 | 802.4 | 612 | 599 | 116.5 |
| C | 12 | 4 | 14477 | 100.0 | 596 | 599 | 138.8 |
| C | 13 | 61 | 4914 | 31.09 | 596 | 599 | 138.8 |
| C | 1 | 16 | 4853 | 30.65 | 596 | 599 | 138.8 |
| D | 8 | 195 | 444653 | 3034.92 | 594 | 575 | 146.3 |
| D | 2 | 33 | 43406 | 292.72 | 594 | 575 | 146.3 |
| D | 12 | 233 | 20802 | 138.24 | 594 | 575 | 146.3 |
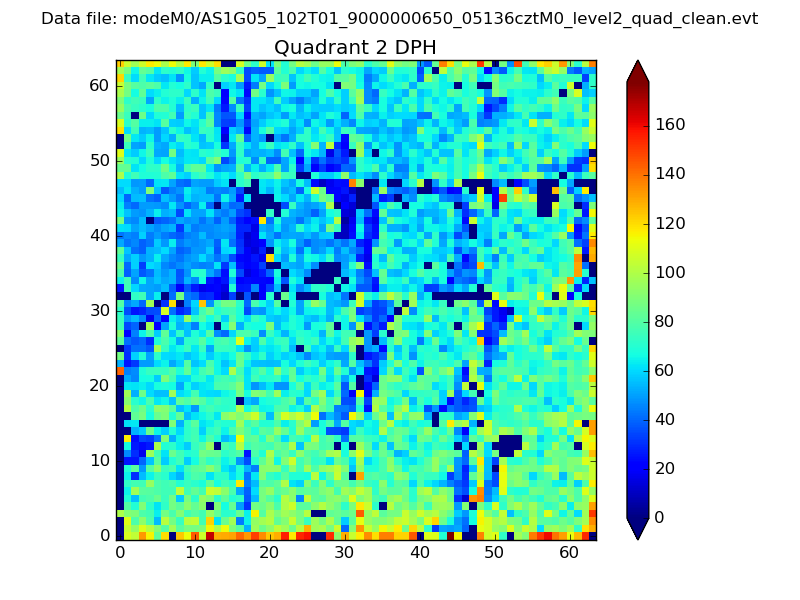
Histogram calculated using DETX and DETY for each event in the final _common_clean file
| Quadrant A | 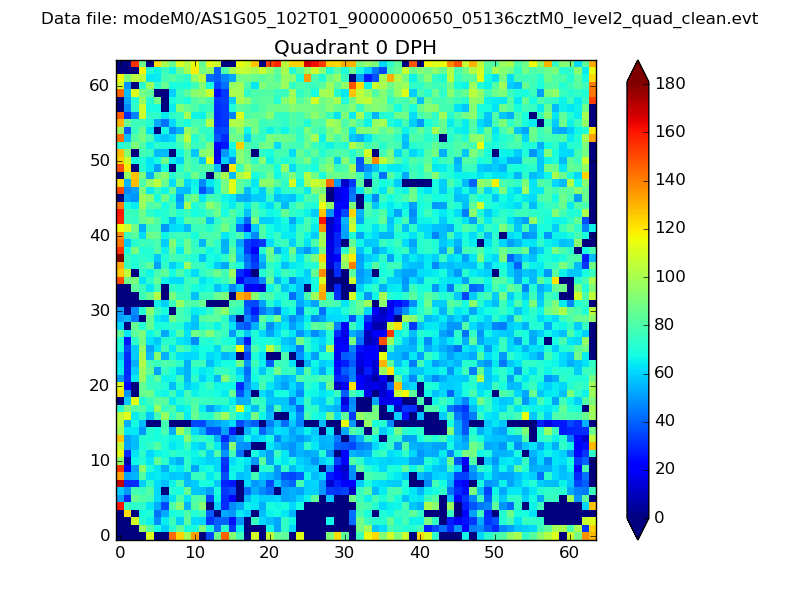 |
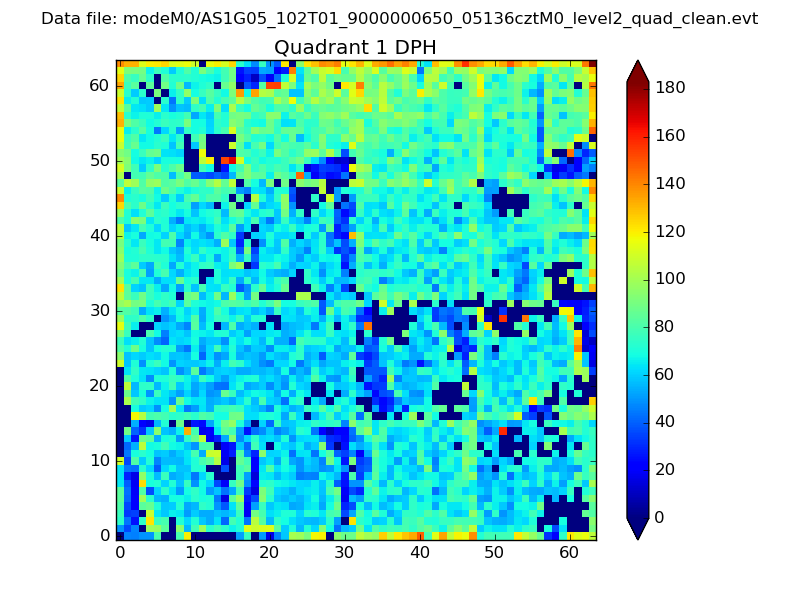 |
Quadrant B |
|---|---|---|---|
| Quadrant D | 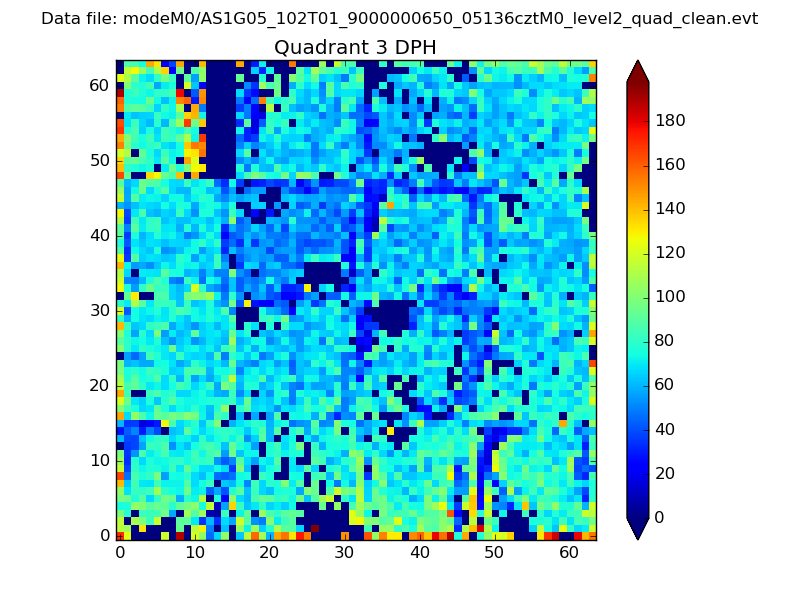 |
 |
Quadrant C |
| Plot type | Count rate plots | Images |
|---|---|---|
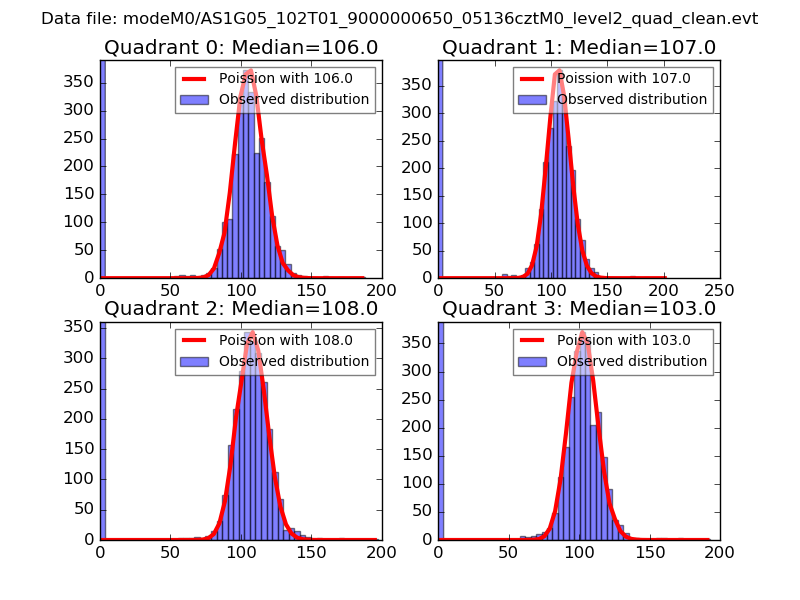
| Comparison with Poisson distribution Blue bars denote a histogram of data divided into 1 sec bins. Red curve is a Poisson curve with rate = median count rate of data. |
 |
 |
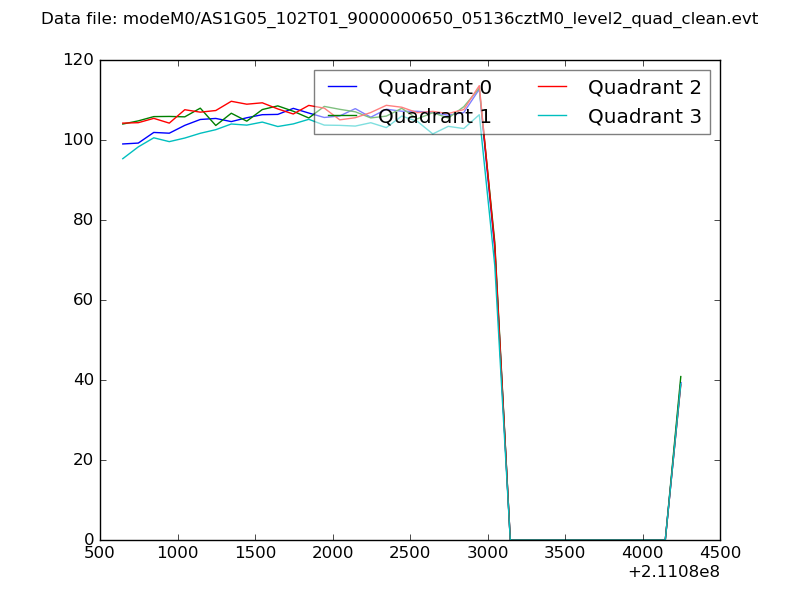
| Quadrant-wise count rates Data is divided into 100 sec bins |
 |
|
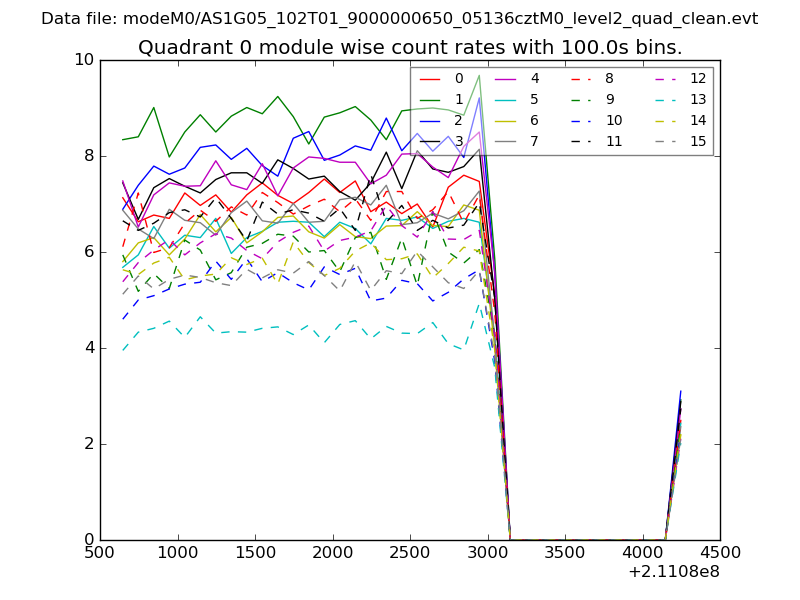
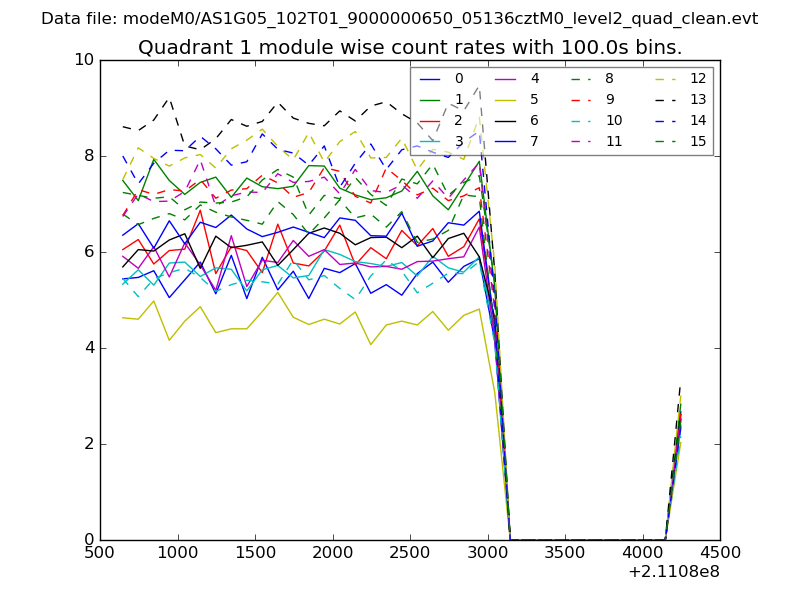
| Module-wise count rates for Quadrant A Data is divided into 100 sec bins |
 |
 |
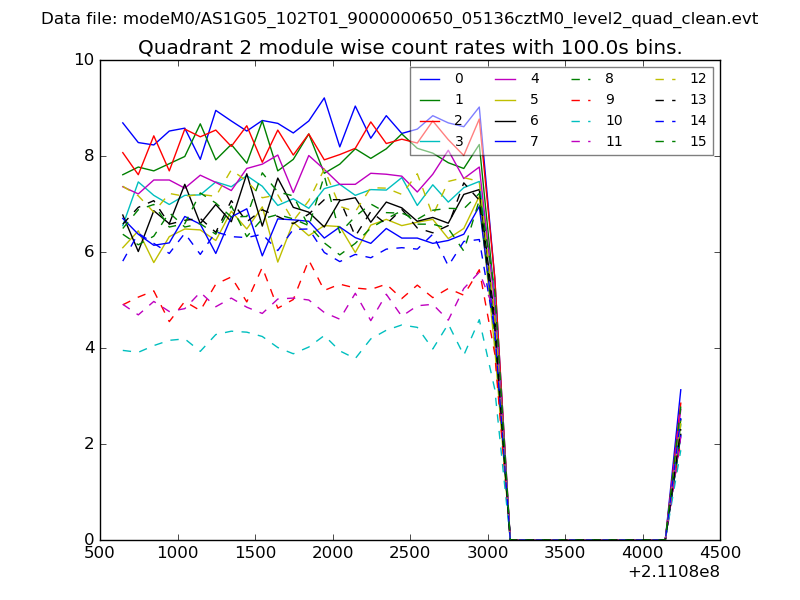
| Module-wise count rates for Quadrant B Data is divided into 100 sec bins |
 |
 |
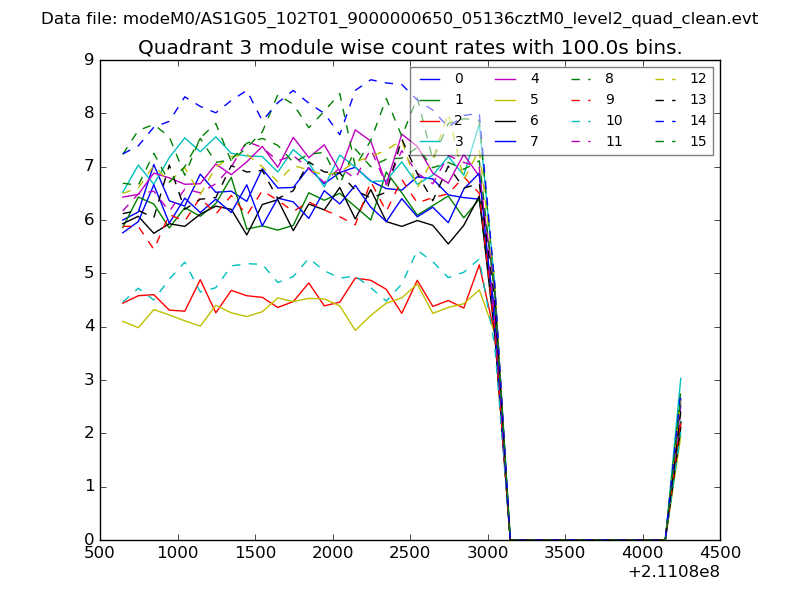
| Module-wise count rates for Quadrant C Data is divided into 100 sec bins |
 |
 |
| Module-wise count rates for Quadrant D Data is divided into 100 sec bins |
 |
 |
| Parameter | Plot |
|---|---|
| CZT HV Monitor | 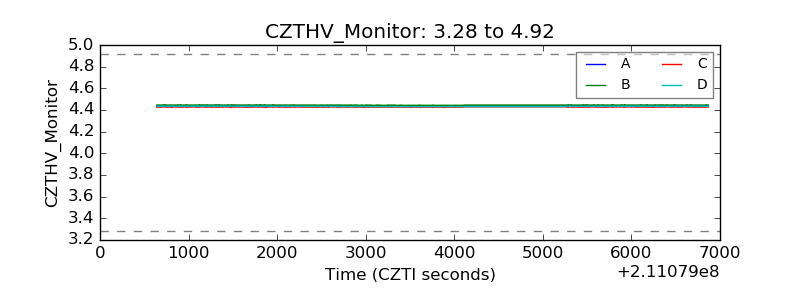 |
| D_VDD | 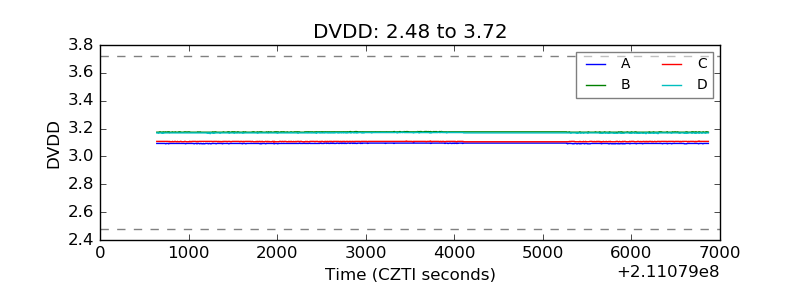 |
| Temperature 1 | 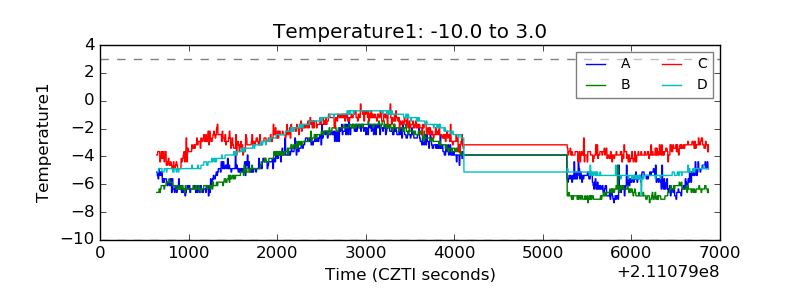 |
| Veto HV Monitor | 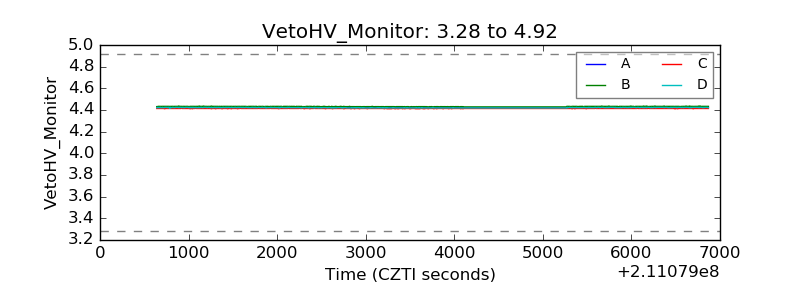 |
| Veto LLD | 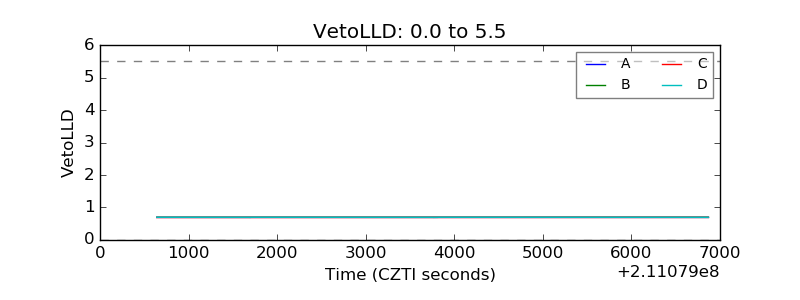 |
| Alpha Counter | 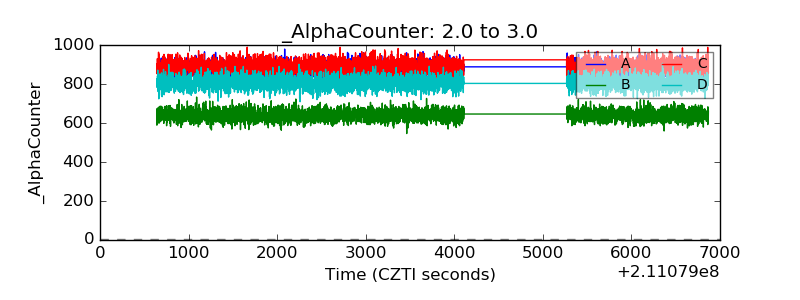 |
| _CPM_Rate | 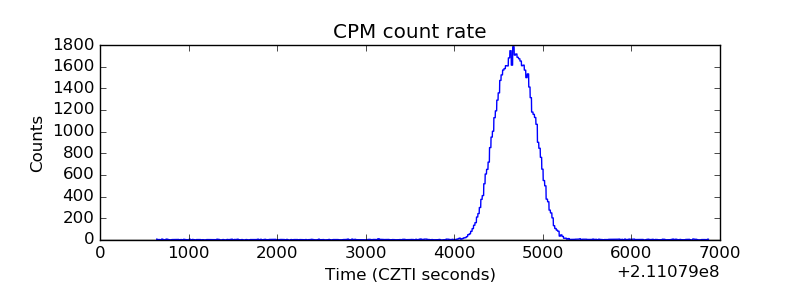 |
| CZT Counter | 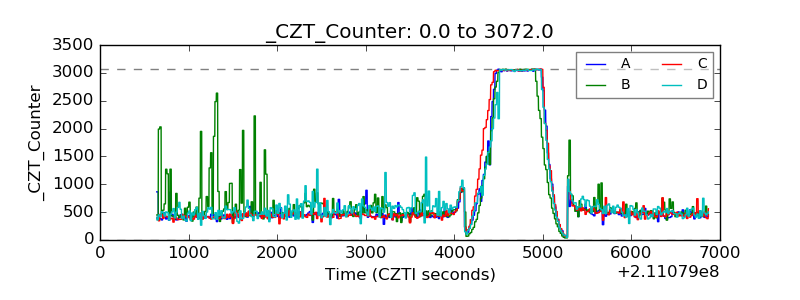 |
| +2.5 Volts monitor |  |
| +5 Volts monitor |  |
| _ROLL_ROT | 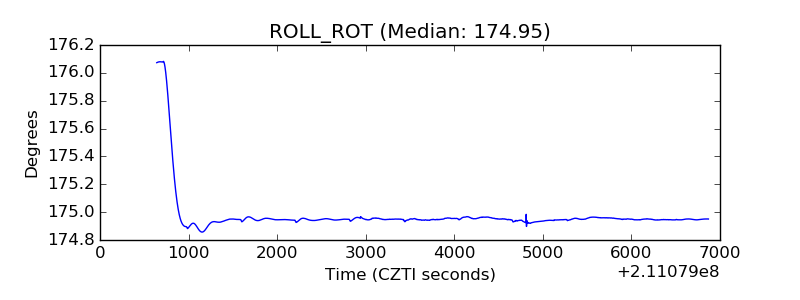 |
| _Roll_DEC | 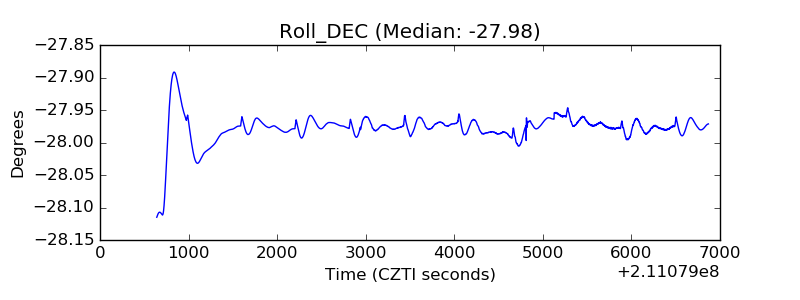 |
| _Roll_RA | 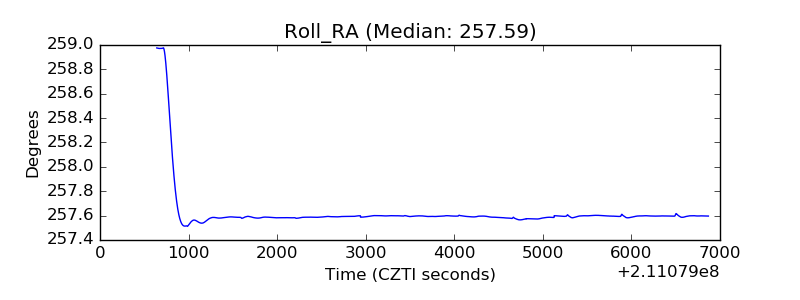 |
| Veto Counter | 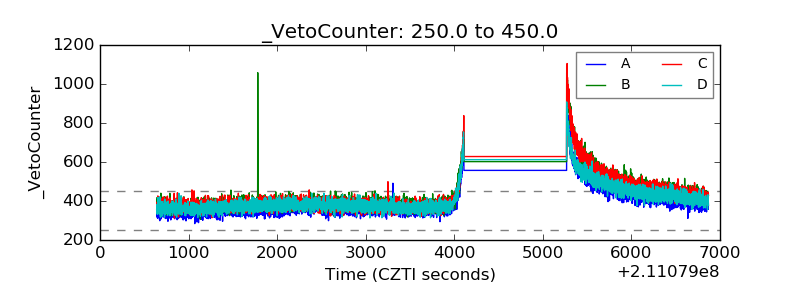 |