| Param | Original file | Final file |
|---|---|---|
| Filename | modeM0/AS1G05_102T01_9000000650_05137cztM0_level2.evt | modeM0/AS1G05_102T01_9000000650_05137cztM0_level2_quad_clean.evt |
| Size (bytes) | 456,454,080 | 55,195,200 |
| Size | 435.3 MB | 52.6 MB |
| Events in quadrant A | 3,073,460 | 308,225 |
| Events in quadrant B | 3,836,484 | 309,626 |
| Events in quadrant C | 3,081,301 | 310,770 |
| Events in quadrant D | 3,398,323 | 296,443 |
| Mode M0 | |||
|---|---|---|---|
| Quadrant | BADHDUFLAG | Total packets | Discarded packets |
| A | 0 | 13171 | 3 |
| B | 0 | 15387 | 2 |
| C | 0 | 13275 | 2 |
| D | 0 | 13998 | 2 |
| Mode M9 | |||
|---|---|---|---|
| Quadrant | BADHDUFLAG | Total packets | Discarded packets |
| A | 0 | 21 | 0 |
| B | 0 | 21 | 0 |
| C | 0 | 21 | 0 |
| D | 0 | 22 | 0 |
| Mode SS | |||
|---|---|---|---|
| Quadrant | BADHDUFLAG | Total packets | Discarded packets |
| A | 0 | 130 | 0 |
| B | 0 | 130 | 0 |
| C | 0 | 130 | 0 |
| D | 0 | 130 | 0 |
| Quadrant | Total seconds | Saturated seconds | Saturation percentage |
|---|---|---|---|
| A | 6389 | 42 | 0.657380% |
| B | 6389 | 187 | 2.926906% |
| C | 6389 | 50 | 0.782595% |
| D | 6389 | 54 | 0.845203% |
Noise dominated data is calculated using 1-second bins in cleaned event files. If a bin has >2000 counts, and if more than 50% of those come from <1% of pixels, then it is considered to be noise-dominated and hence unusable.
| Quadrant | # 1 sec bins | Bins with >0 counts | Bins with >2000 counts | High rate bins dominated by noise | Noise dominated (total time) | Noise dominated (detector-on time) | Marked lightcurve |
|---|---|---|---|---|---|---|---|
| A | 7659 | 6390 | 0 | 0 | 0.00% | 0.00% | 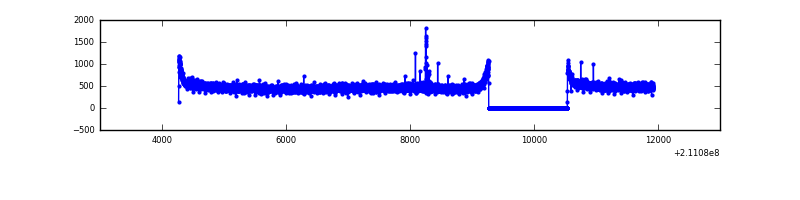 |
| B | 7659 | 6390 | 81 | 81 | 1.06% | 1.27% | 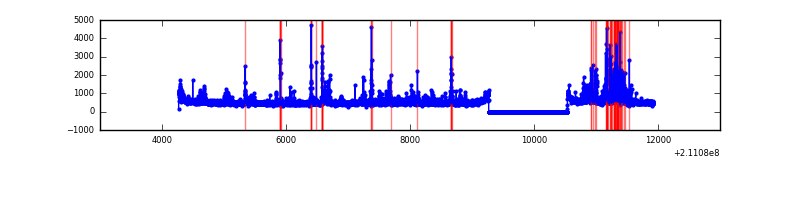 |
| C | 7659 | 6390 | 5 | 5 | 0.07% | 0.08% | 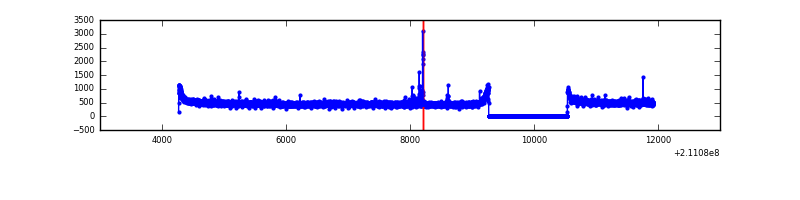 |
| D | 7659 | 6390 | 7 | 7 | 0.09% | 0.11% | 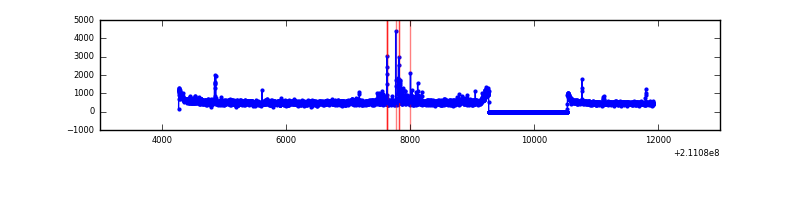 |
Top three noisy pixels from each quadrant. If the there are fewer than three noisy pixels in the level2.evt file, extra rows are filled as -1
| Pixel properties | Quadrant properties | ||||||
|---|---|---|---|---|---|---|---|
| Quadrant | DetID | PixID | Counts | Sigma | Mean | Median | Sigma |
| A | 0 | 50 | 16439 | 96.69 | 795 | 781 | 161.9 |
| A | 0 | 226 | 8017 | 44.68 | 795 | 781 | 161.9 |
| A | 12 | 194 | 7804 | 43.37 | 795 | 781 | 161.9 |
| B | 10 | 16 | 516198 | 3441.9 | 801 | 784 | 149.7 |
| B | 4 | 80 | 98437 | 652.12 | 801 | 784 | 149.7 |
| B | 15 | 204 | 48535 | 318.88 | 801 | 784 | 149.7 |
| C | 12 | 4 | 35190 | 192.51 | 777 | 782 | 178.7 |
| C | 1 | 16 | 12612 | 66.19 | 777 | 782 | 178.7 |
| C | 13 | 61 | 6429 | 31.59 | 777 | 782 | 178.7 |
| D | 8 | 195 | 339799 | 1800.4 | 773 | 750 | 188.3 |
| D | 12 | 233 | 54020 | 282.87 | 773 | 750 | 188.3 |
| D | 2 | 33 | 53441 | 279.8 | 773 | 750 | 188.3 |
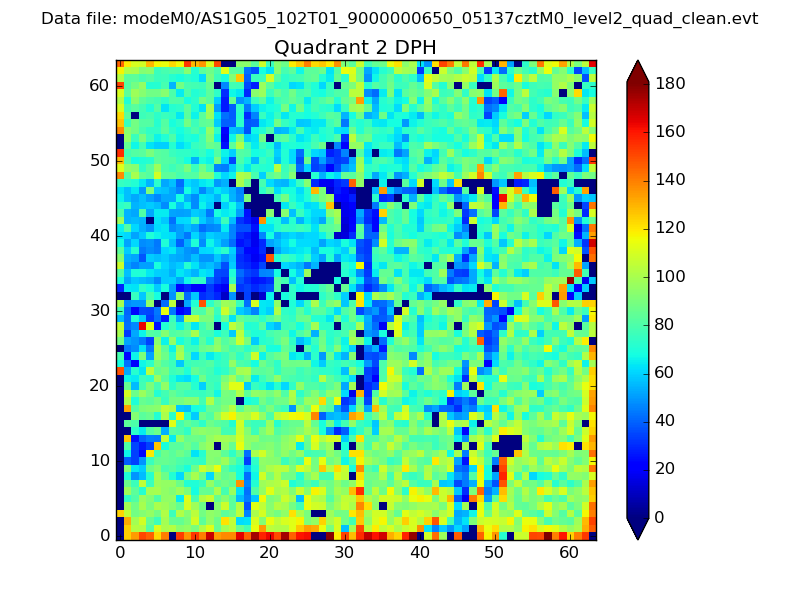
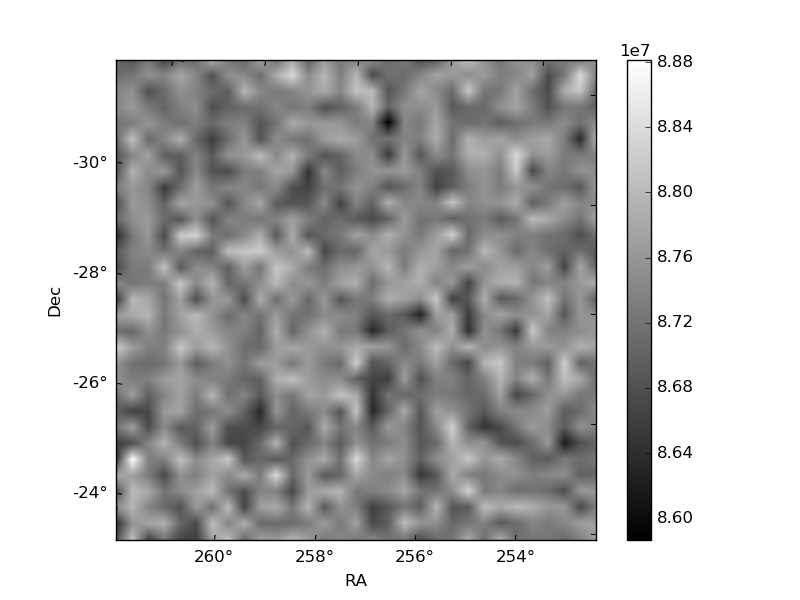
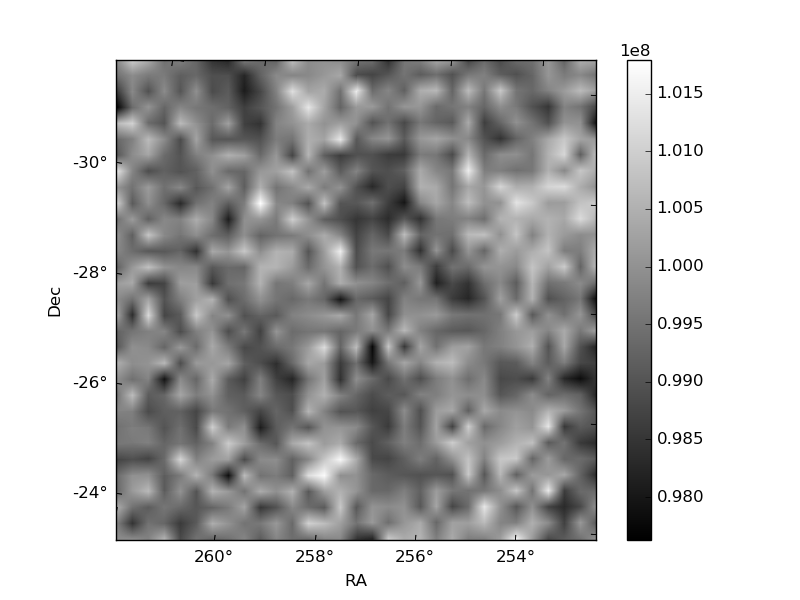
Histogram calculated using DETX and DETY for each event in the final _common_clean file
| Quadrant A | 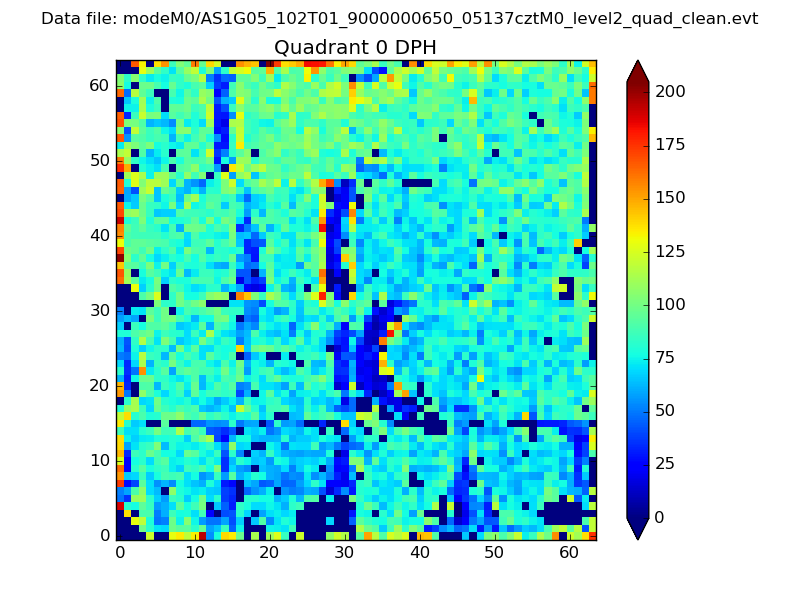 |
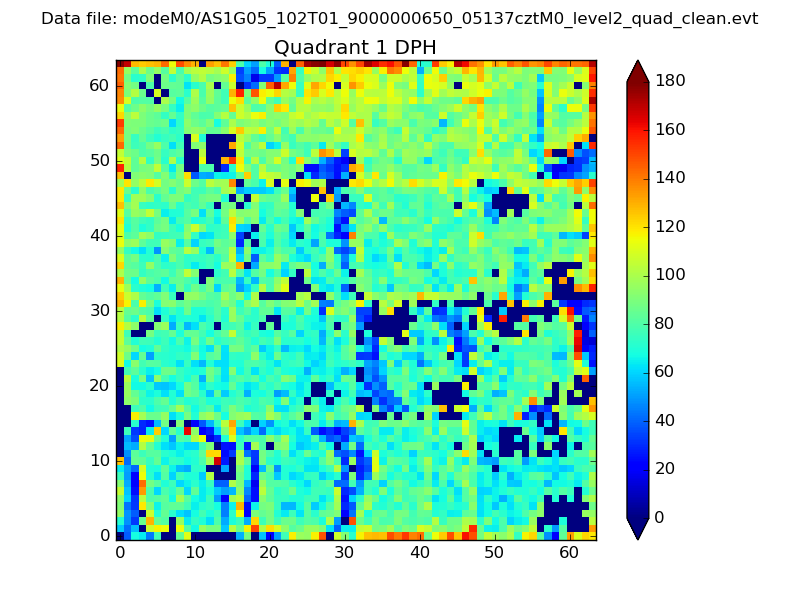 |
Quadrant B |
|---|---|---|---|
| Quadrant D | 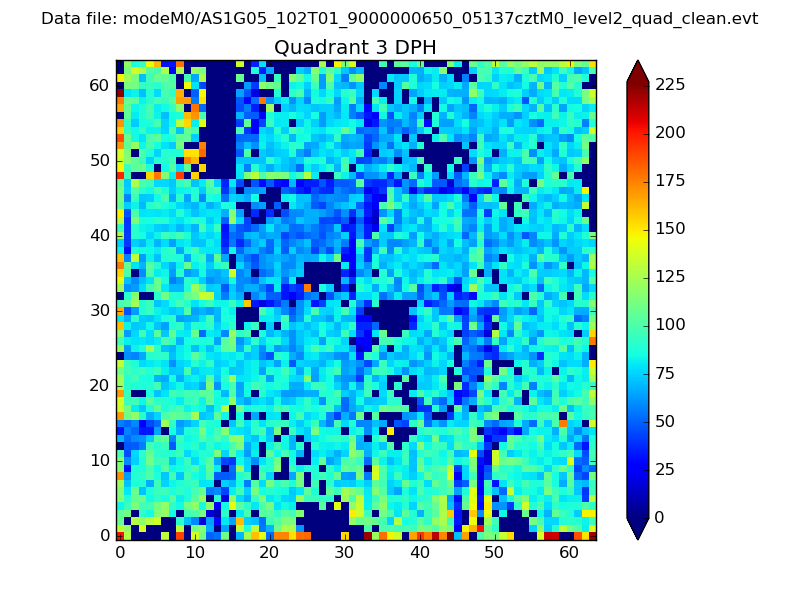 |
 |
Quadrant C |
| Plot type | Count rate plots | Images |
|---|---|---|
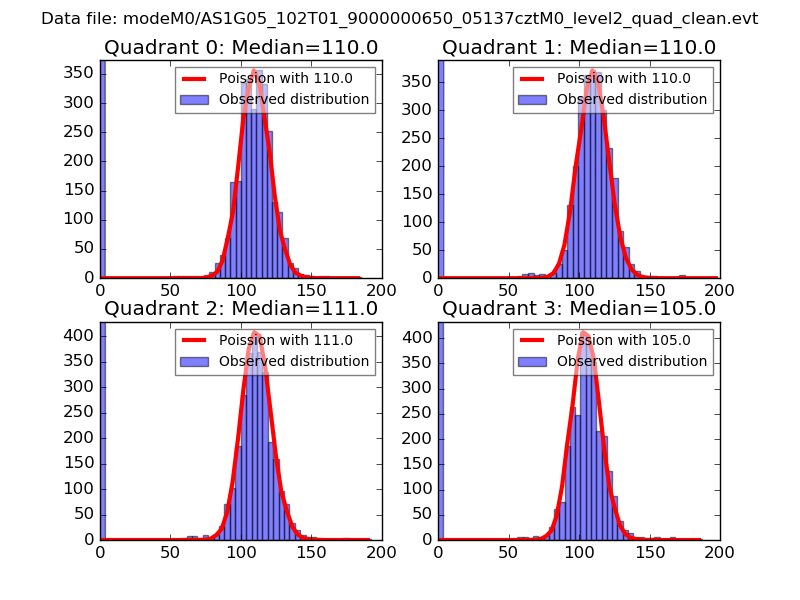
| Comparison with Poisson distribution Blue bars denote a histogram of data divided into 1 sec bins. Red curve is a Poisson curve with rate = median count rate of data. |
 |
 |
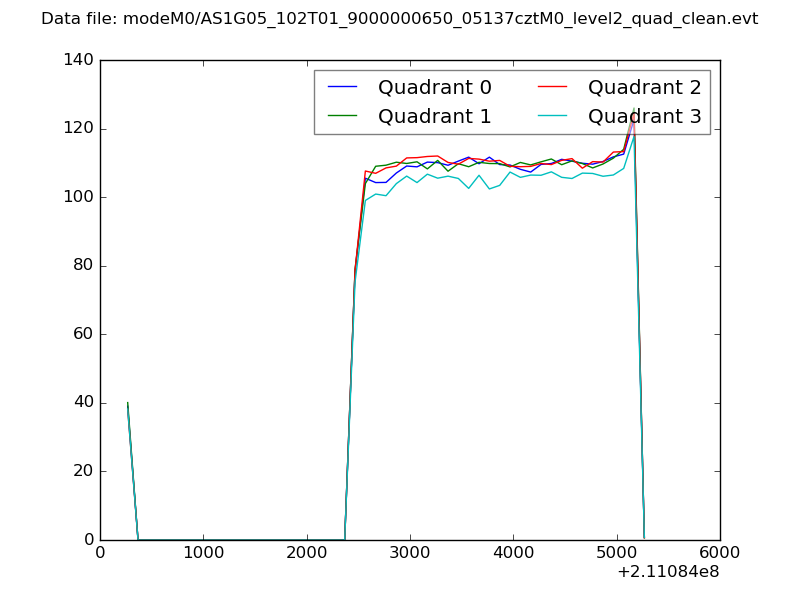
| Quadrant-wise count rates Data is divided into 100 sec bins |
 |
|
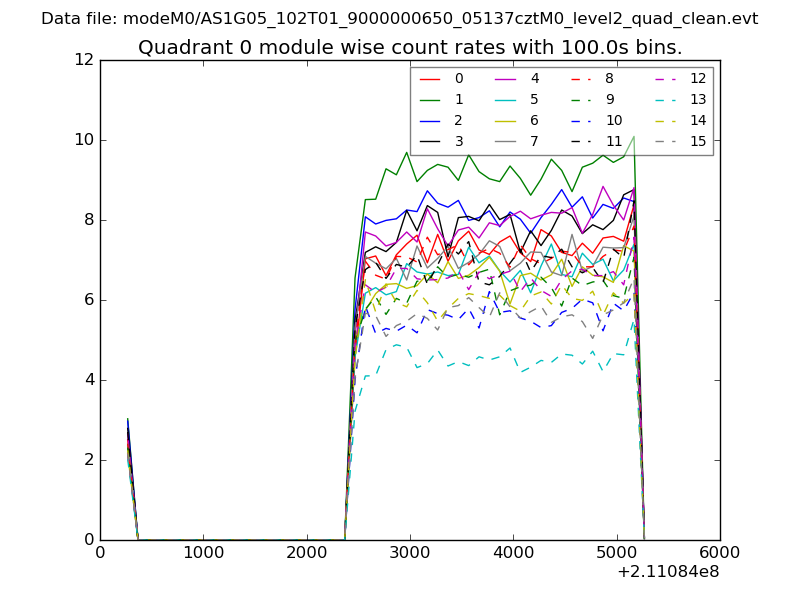
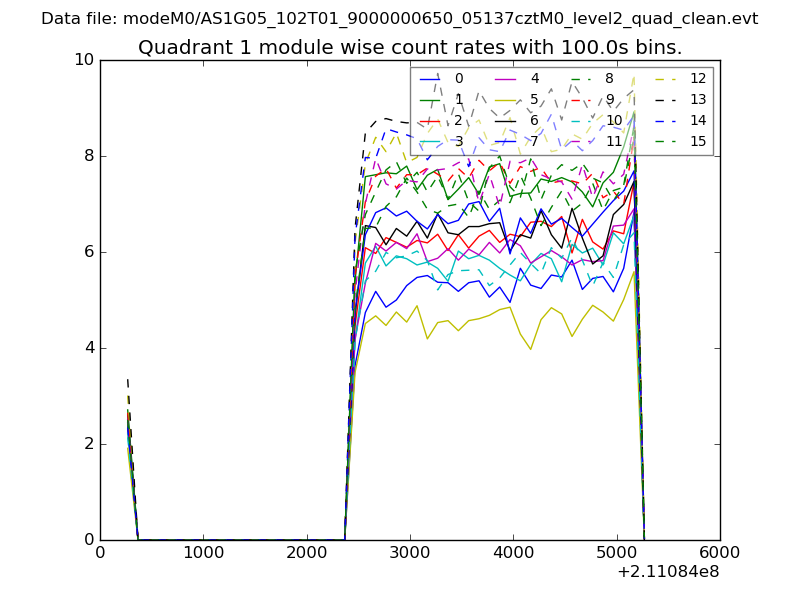
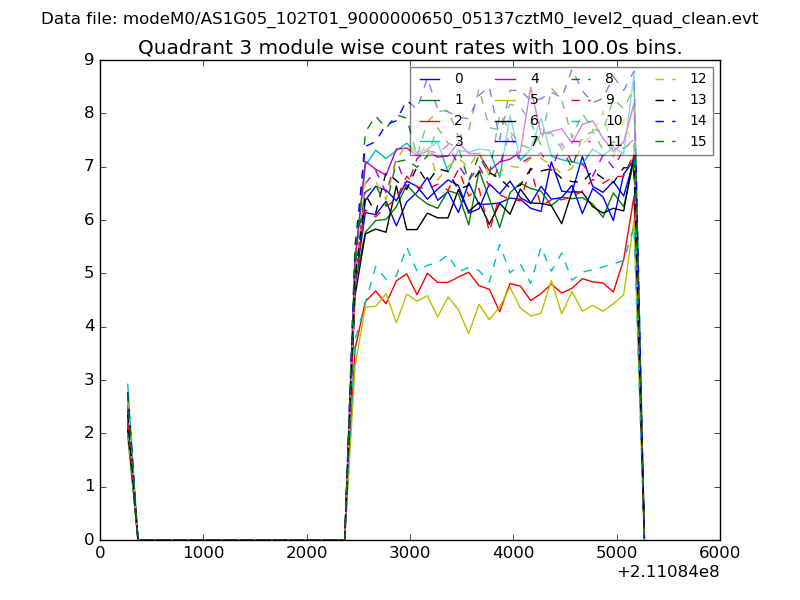
| Module-wise count rates for Quadrant A Data is divided into 100 sec bins |
 |
 |
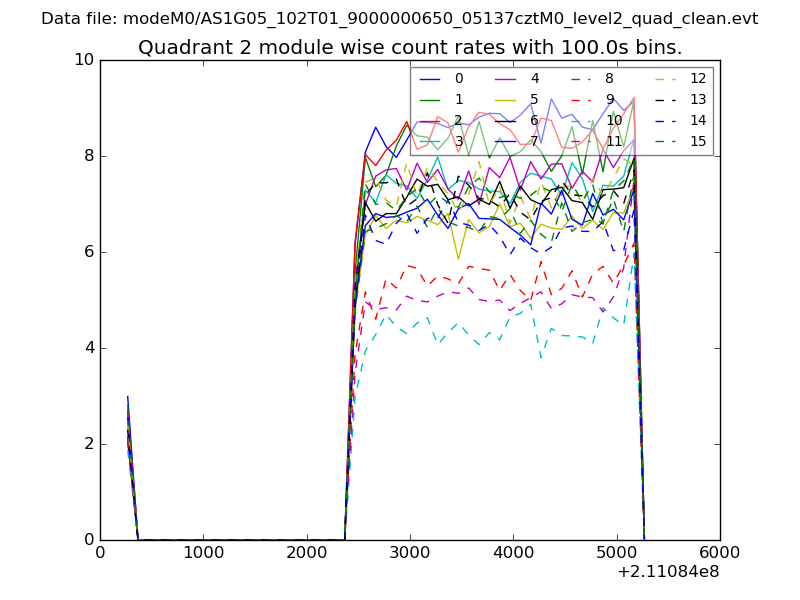
| Module-wise count rates for Quadrant B Data is divided into 100 sec bins |
 |
 |
| Module-wise count rates for Quadrant C Data is divided into 100 sec bins |
 |
 |
| Module-wise count rates for Quadrant D Data is divided into 100 sec bins |
 |
 |
| Parameter | Plot |
|---|---|
| CZT HV Monitor | 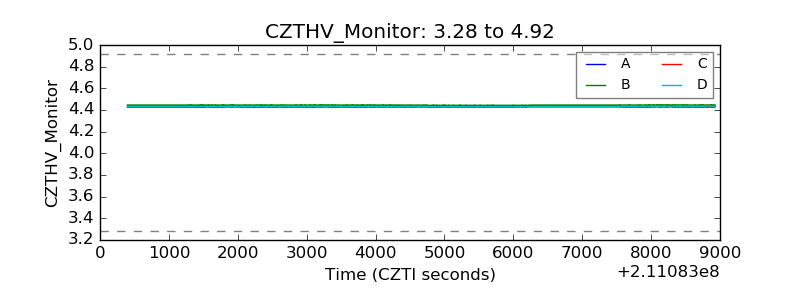 |
| D_VDD | 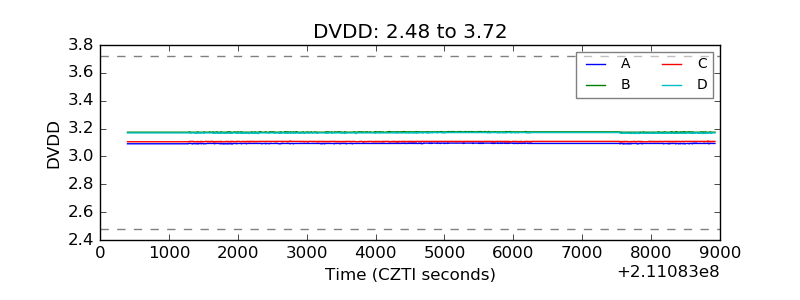 |
| Temperature 1 | 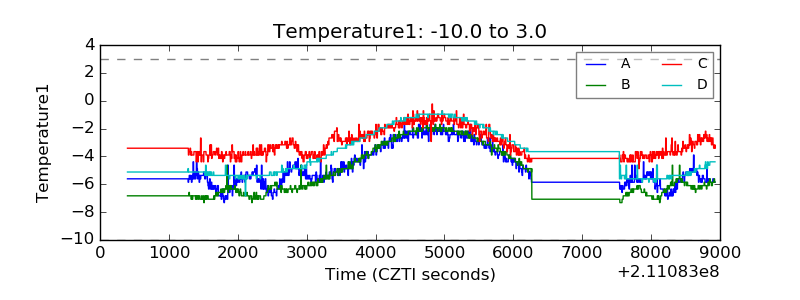 |
| Veto HV Monitor | 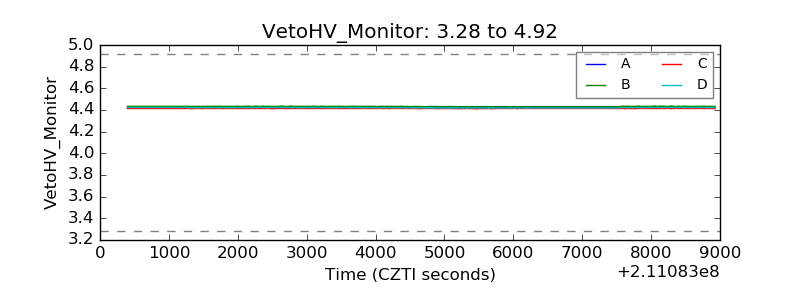 |
| Veto LLD | 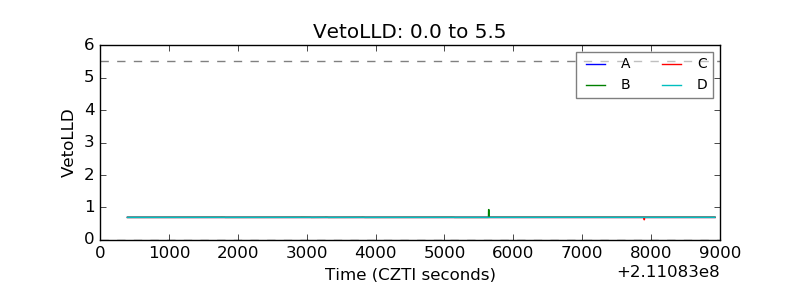 |
| Alpha Counter | 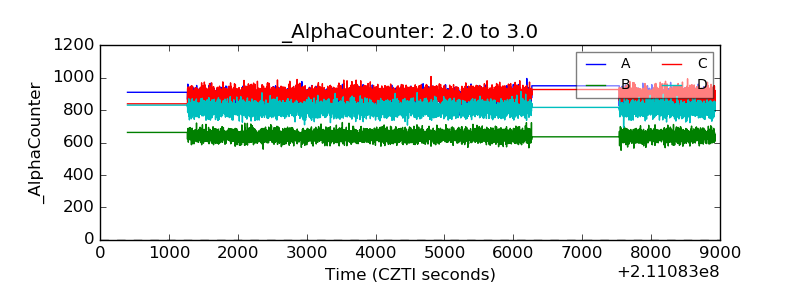 |
| _CPM_Rate | 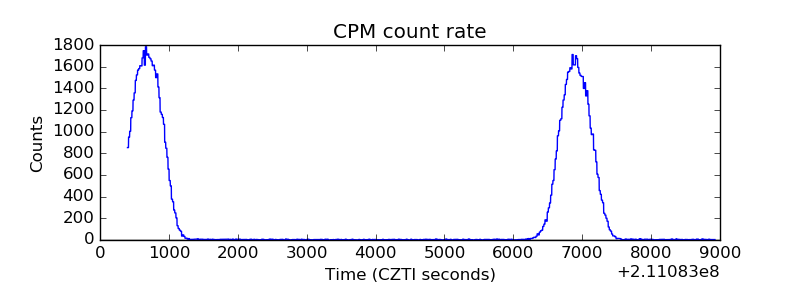 |
| CZT Counter | 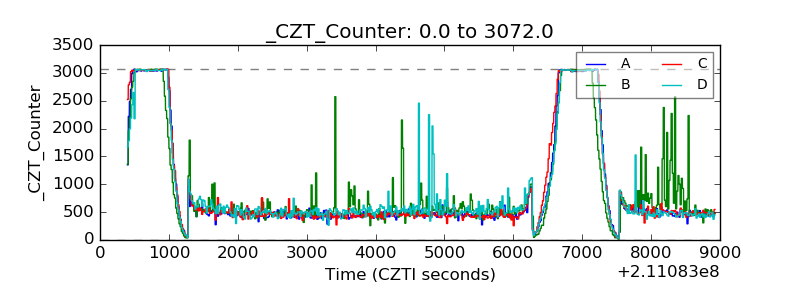 |
| +2.5 Volts monitor |  |
| +5 Volts monitor |  |
| _ROLL_ROT | 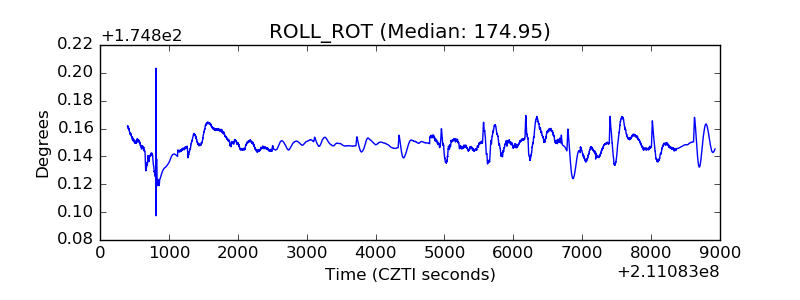 |
| _Roll_DEC | 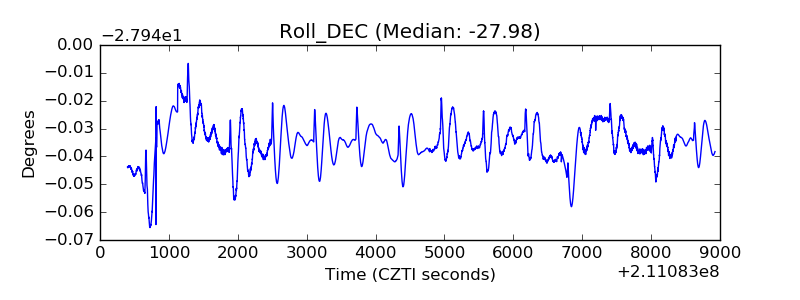 |
| _Roll_RA | 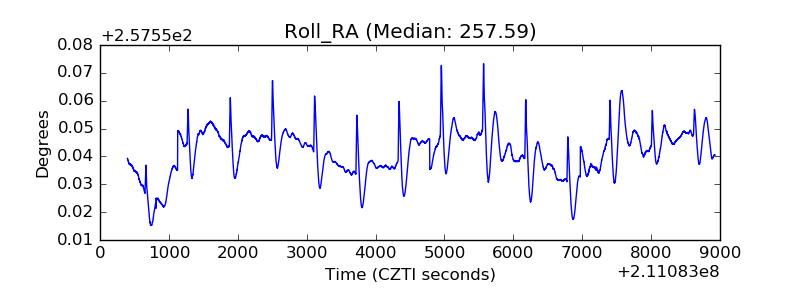 |
| Veto Counter | 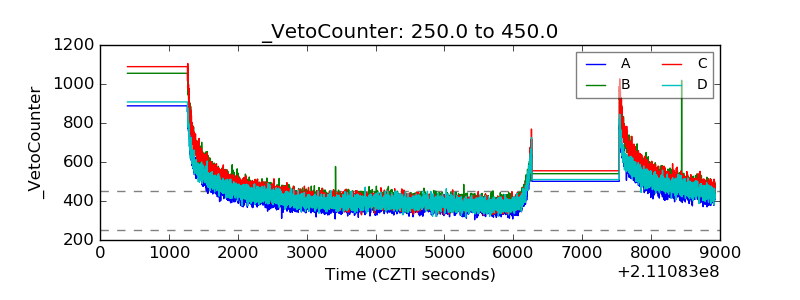 |