| Param | Original file | Final file |
|---|---|---|
| Filename | modeM0/AS1G05_102T01_9000000650_05138cztM0_level2.evt | modeM0/AS1G05_102T01_9000000650_05138cztM0_level2_quad_clean.evt |
| Size (bytes) | 442,111,680 | 60,969,600 |
| Size | 421.6 MB | 58.1 MB |
| Events in quadrant A | 3,046,691 | 355,526 |
| Events in quadrant B | 3,582,052 | 357,252 |
| Events in quadrant C | 3,054,800 | 357,726 |
| Events in quadrant D | 3,282,241 | 340,491 |
| Mode M0 | |||
|---|---|---|---|
| Quadrant | BADHDUFLAG | Total packets | Discarded packets |
| A | 0 | 12898 | 3 |
| B | 0 | 14433 | 2 |
| C | 0 | 12994 | 2 |
| D | 0 | 13909 | 2 |
| Mode M9 | |||
|---|---|---|---|
| Quadrant | BADHDUFLAG | Total packets | Discarded packets |
| A | 0 | 26 | 0 |
| B | 0 | 26 | 0 |
| C | 0 | 26 | 0 |
| D | 0 | 26 | 0 |
| Mode SS | |||
|---|---|---|---|
| Quadrant | BADHDUFLAG | Total packets | Discarded packets |
| A | 0 | 128 | 0 |
| B | 0 | 128 | 0 |
| C | 0 | 128 | 0 |
| D | 0 | 128 | 0 |
| Quadrant | Total seconds | Saturated seconds | Saturation percentage |
|---|---|---|---|
| A | 6233 | 64 | 1.026793% |
| B | 6233 | 179 | 2.871811% |
| C | 6233 | 80 | 1.283491% |
| D | 6233 | 122 | 1.957324% |
Noise dominated data is calculated using 1-second bins in cleaned event files. If a bin has >2000 counts, and if more than 50% of those come from <1% of pixels, then it is considered to be noise-dominated and hence unusable.
| Quadrant | # 1 sec bins | Bins with >0 counts | Bins with >2000 counts | High rate bins dominated by noise | Noise dominated (total time) | Noise dominated (detector-on time) | Marked lightcurve |
|---|---|---|---|---|---|---|---|
| A | 8803 | 6235 | 0 | 0 | 0.00% | 0.00% | 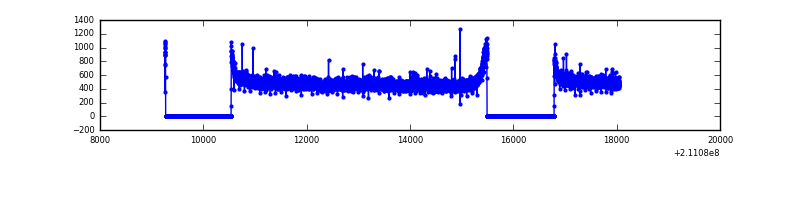 |
| B | 8803 | 6235 | 57 | 57 | 0.65% | 0.91% | 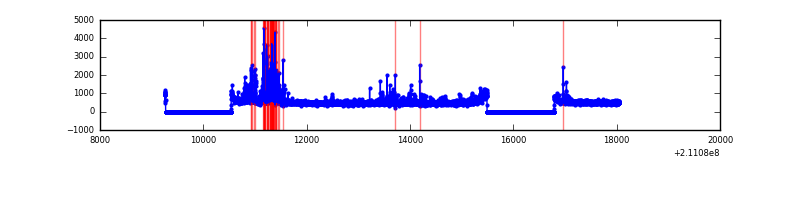 |
| C | 8803 | 6235 | 0 | 0 | 0.00% | 0.00% | 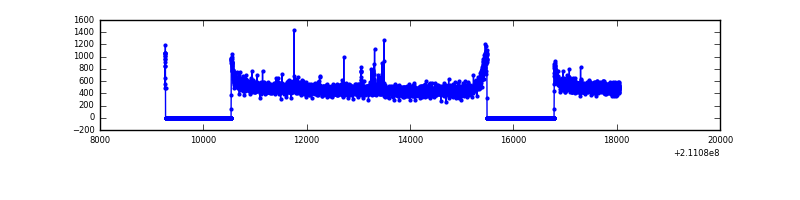 |
| D | 8803 | 6235 | 54 | 54 | 0.61% | 0.87% | 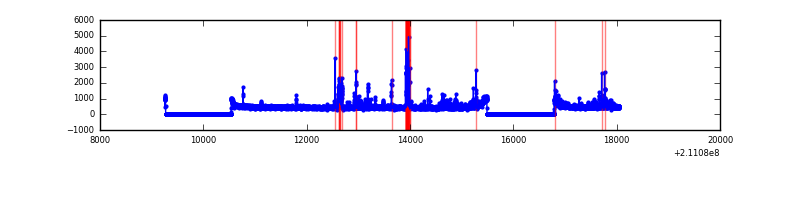 |
Top three noisy pixels from each quadrant. If the there are fewer than three noisy pixels in the level2.evt file, extra rows are filled as -1
| Pixel properties | Quadrant properties | ||||||
|---|---|---|---|---|---|---|---|
| Quadrant | DetID | PixID | Counts | Sigma | Mean | Median | Sigma |
| A | 12 | 194 | 7801 | 43.44 | 790 | 774 | 161.8 |
| A | 0 | 226 | 7727 | 42.98 | 790 | 774 | 161.8 |
| A | 0 | 50 | 6720 | 36.76 | 790 | 774 | 161.8 |
| B | 10 | 16 | 373515 | 2503.37 | 794 | 779 | 148.9 |
| B | 15 | 204 | 38690 | 254.62 | 794 | 779 | 148.9 |
| B | 4 | 80 | 34291 | 225.07 | 794 | 779 | 148.9 |
| C | 1 | 16 | 20433 | 111.2 | 771 | 776 | 176.8 |
| C | 12 | 4 | 20053 | 109.05 | 771 | 776 | 176.8 |
| C | 13 | 61 | 6345 | 31.51 | 771 | 776 | 176.8 |
| D | 2 | 33 | 187606 | 1005.1 | 764 | 742 | 185.9 |
| D | 12 | 233 | 169719 | 908.89 | 764 | 742 | 185.9 |
| D | 2 | 14 | 22588 | 117.51 | 764 | 742 | 185.9 |
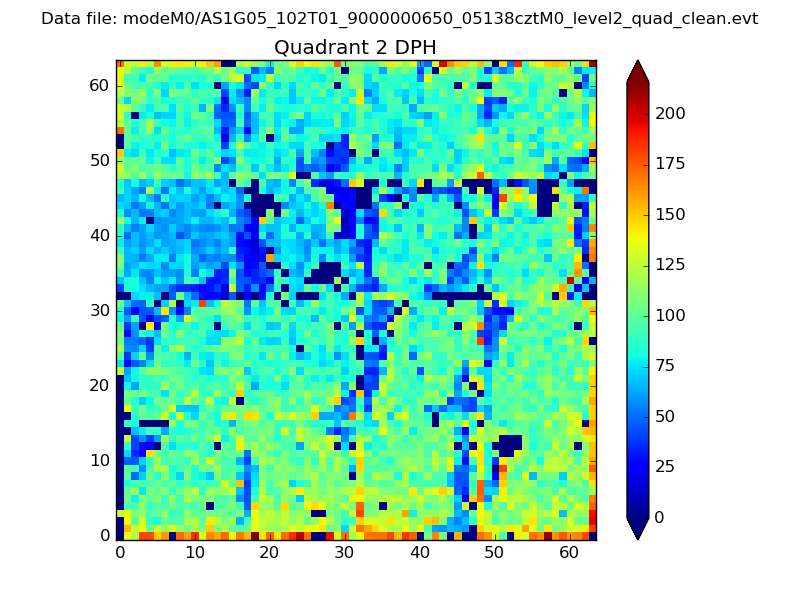
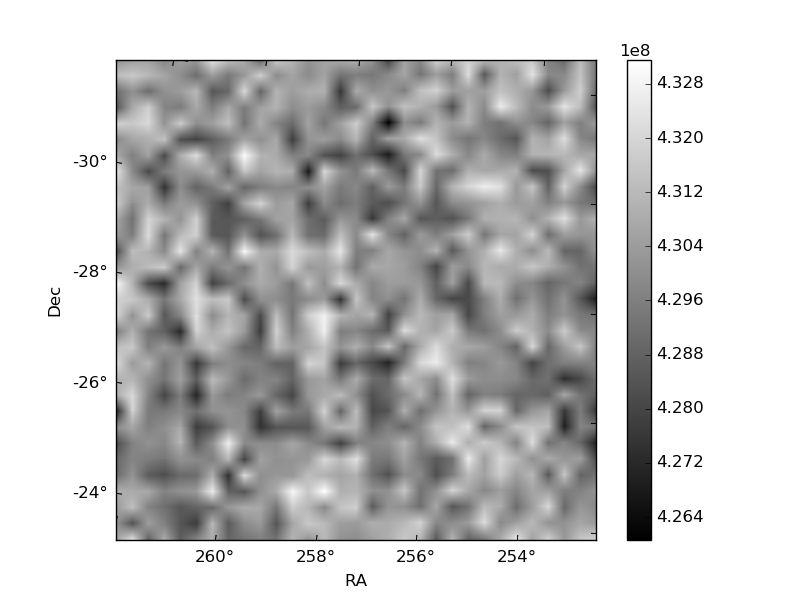
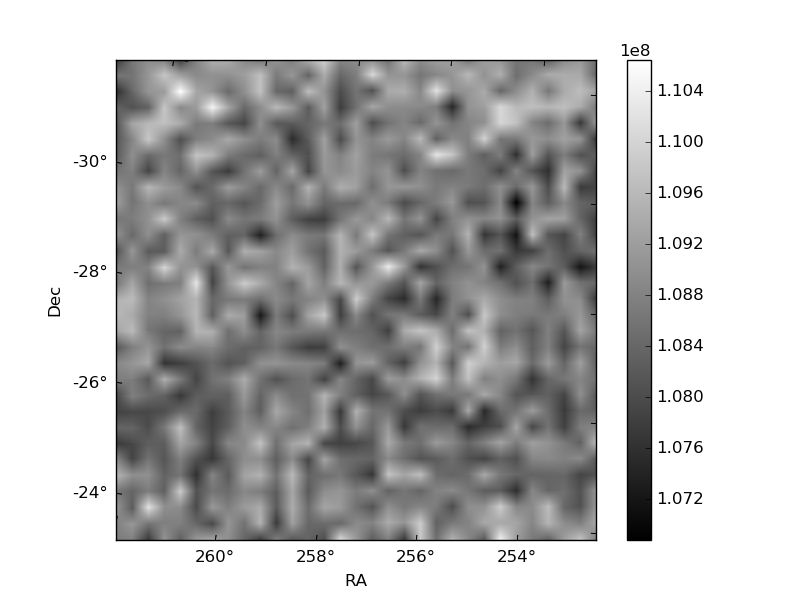
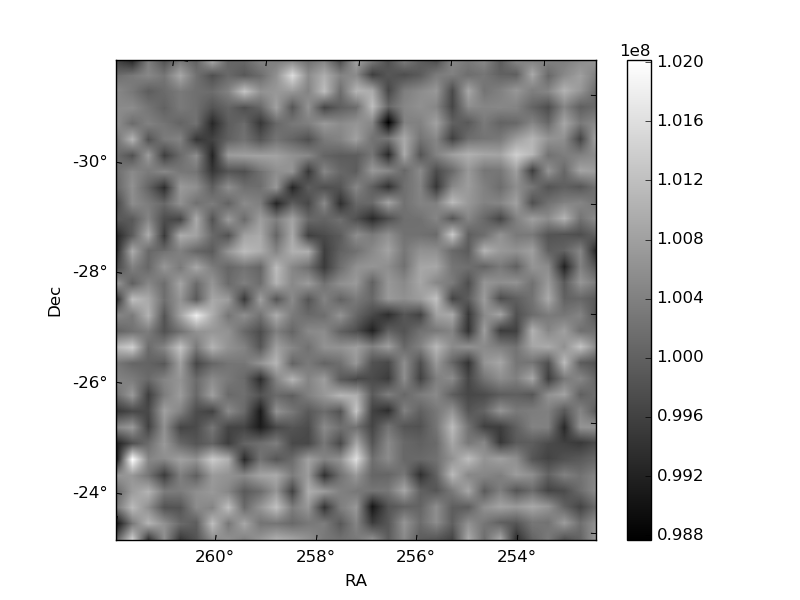
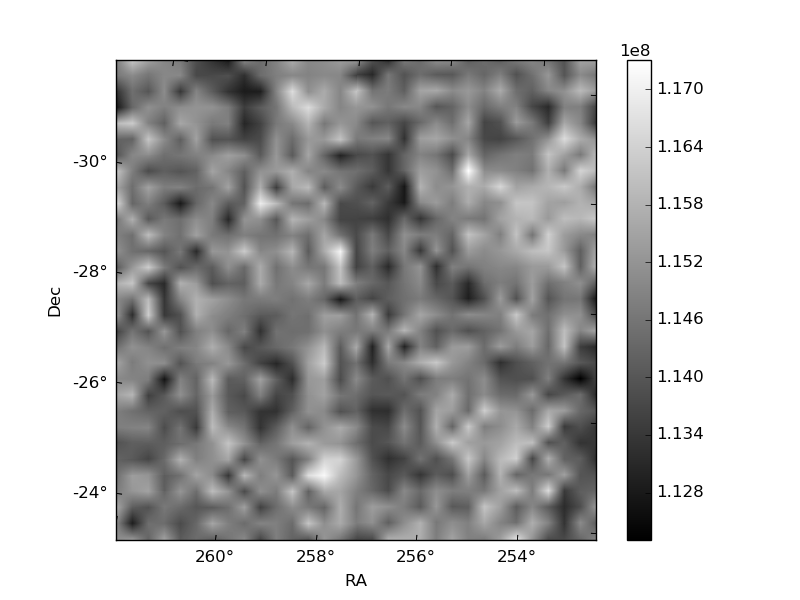
Histogram calculated using DETX and DETY for each event in the final _common_clean file
| Quadrant A | 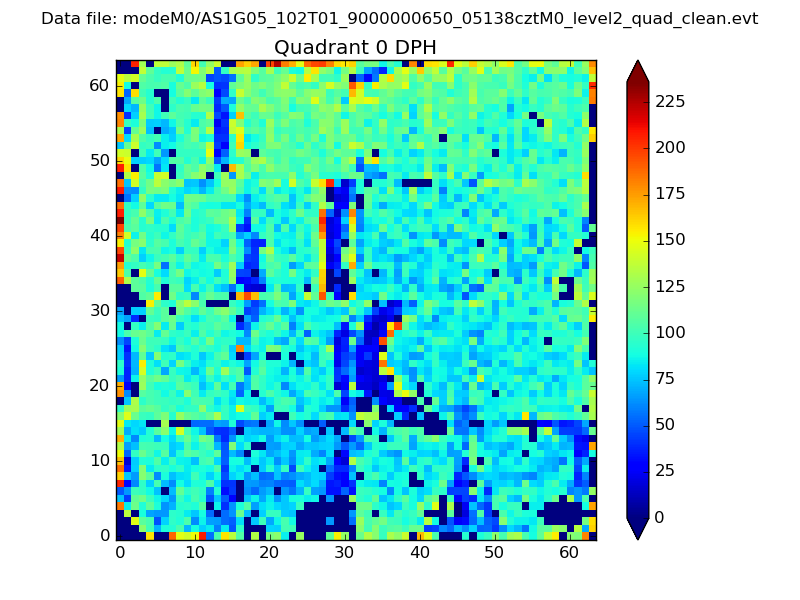 |
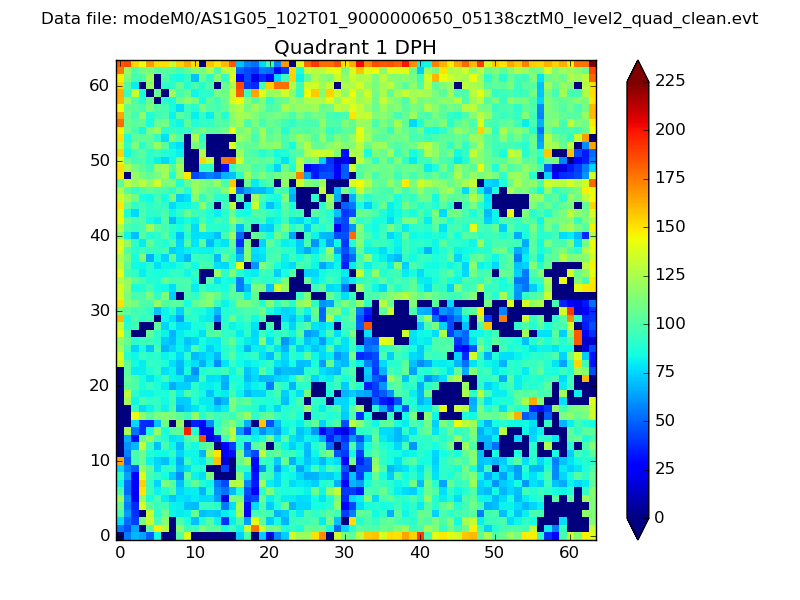 |
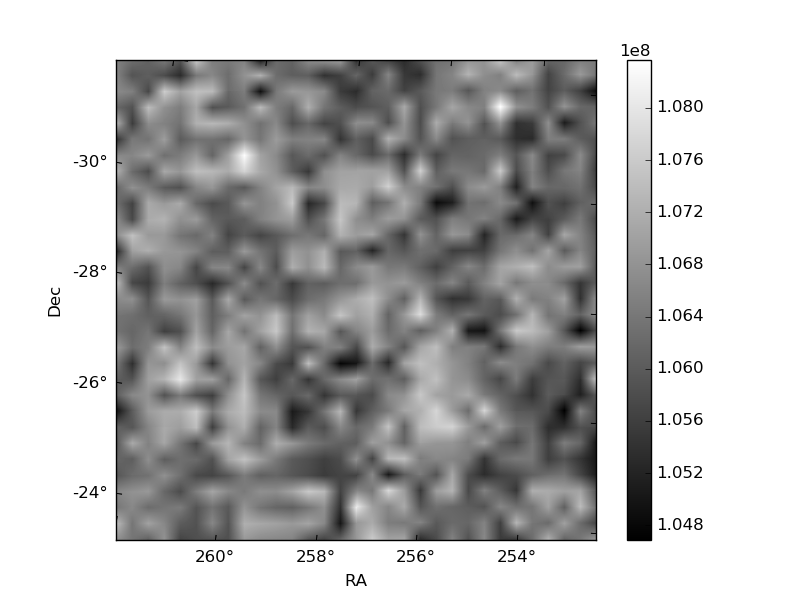
Quadrant B |
|---|---|---|---|
| Quadrant D | 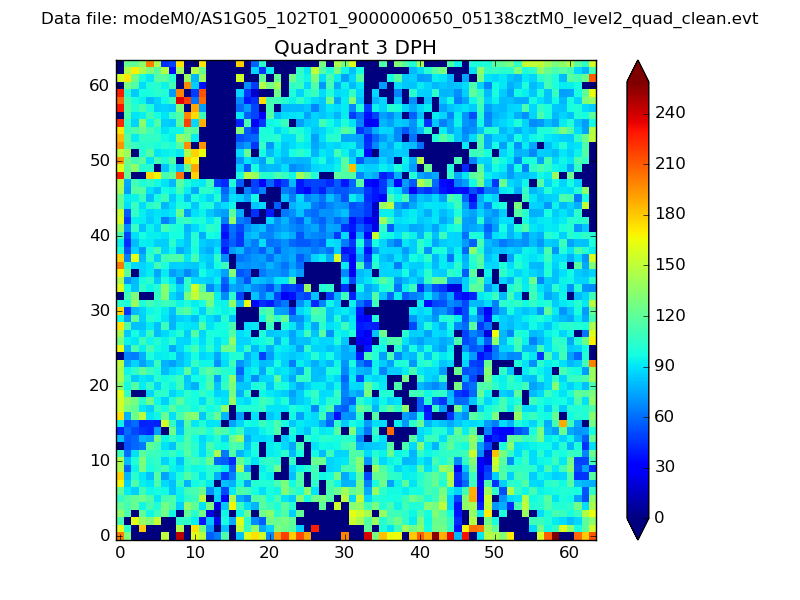 |
 |
Quadrant C |
| Plot type | Count rate plots | Images |
|---|---|---|
| Comparison with Poisson distribution Blue bars denote a histogram of data divided into 1 sec bins. Red curve is a Poisson curve with rate = median count rate of data. |
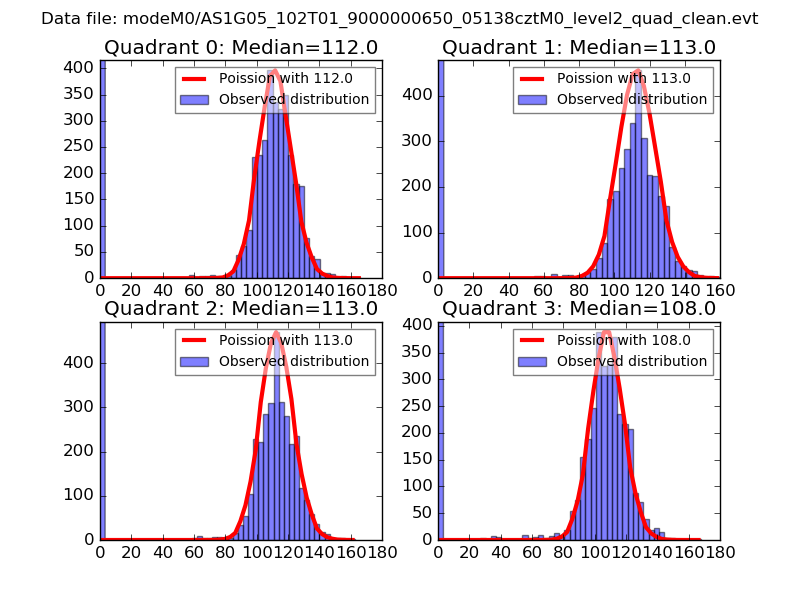 |
 |
| Quadrant-wise count rates Data is divided into 100 sec bins |
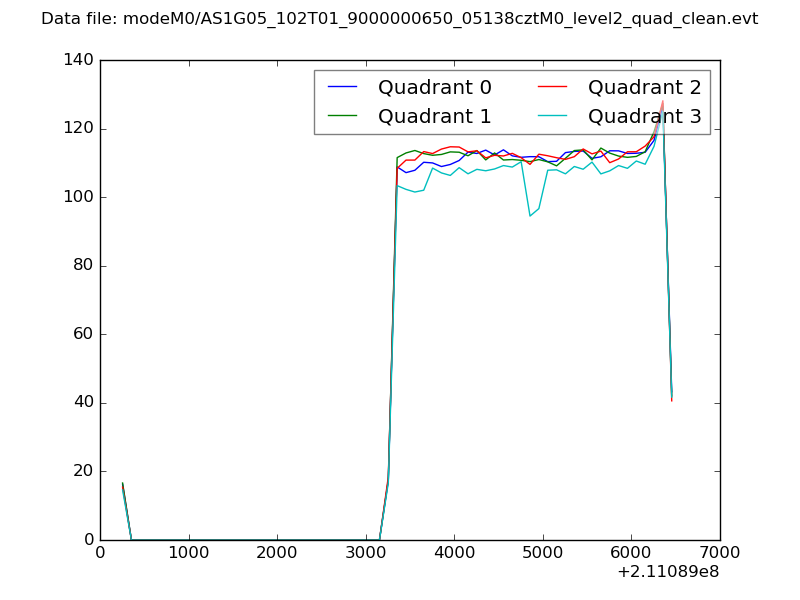 |
|
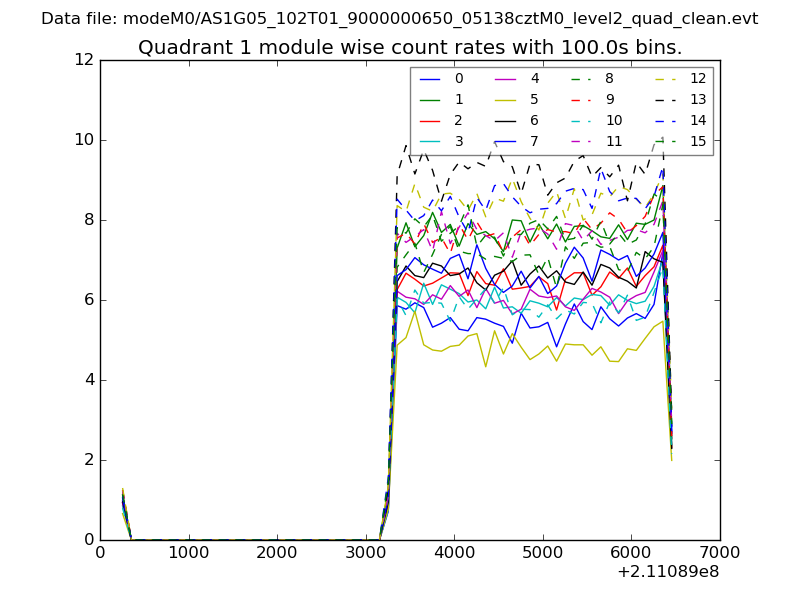
| Module-wise count rates for Quadrant A Data is divided into 100 sec bins |
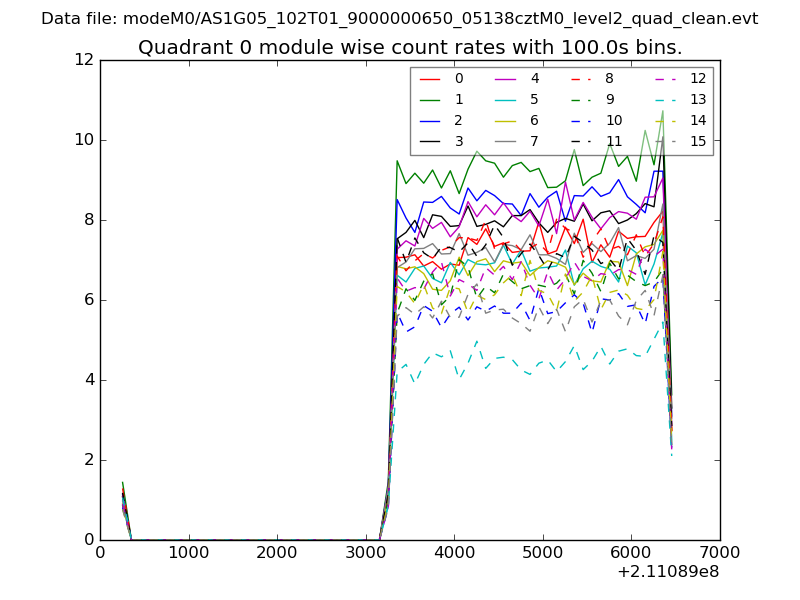 |
 |
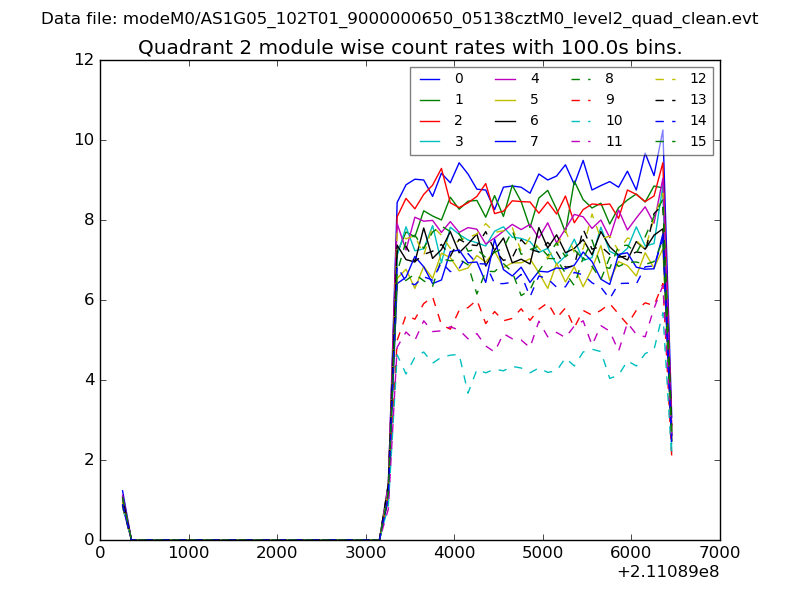
| Module-wise count rates for Quadrant B Data is divided into 100 sec bins |
 |
 |
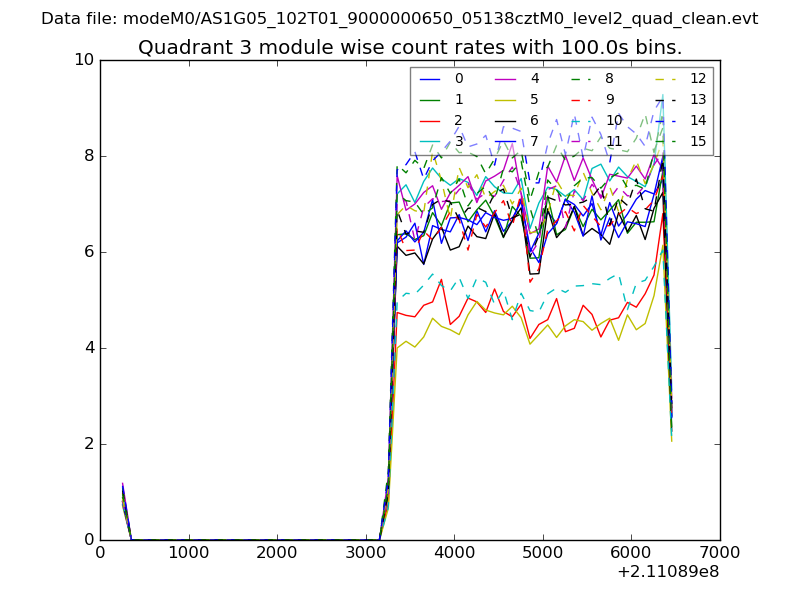
| Module-wise count rates for Quadrant C Data is divided into 100 sec bins |
 |
 |
| Module-wise count rates for Quadrant D Data is divided into 100 sec bins |
 |
 |
| Parameter | Plot |
|---|---|
| CZT HV Monitor | 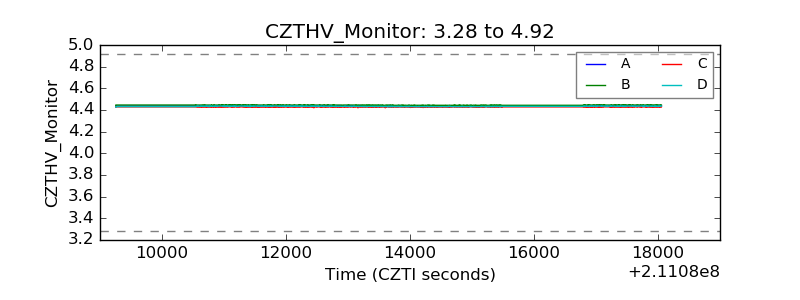 |
| D_VDD | 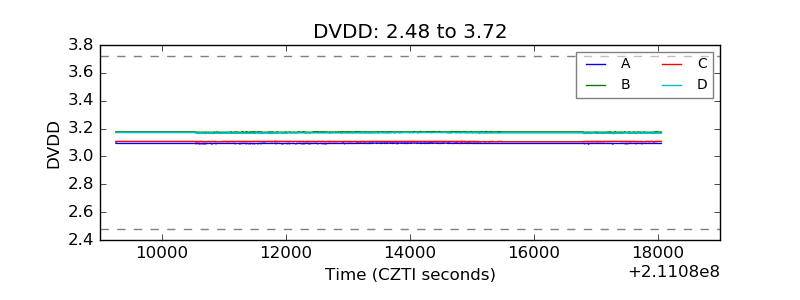 |
| Temperature 1 | 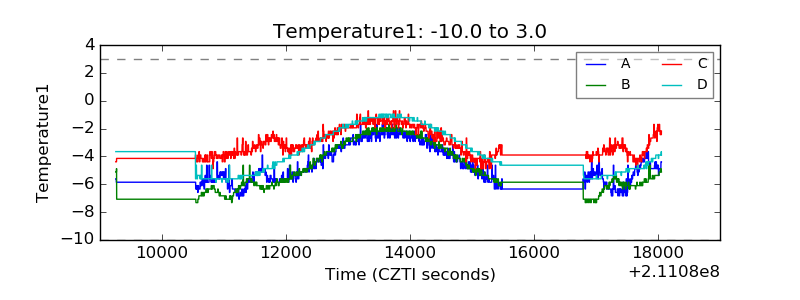 |
| Veto HV Monitor | 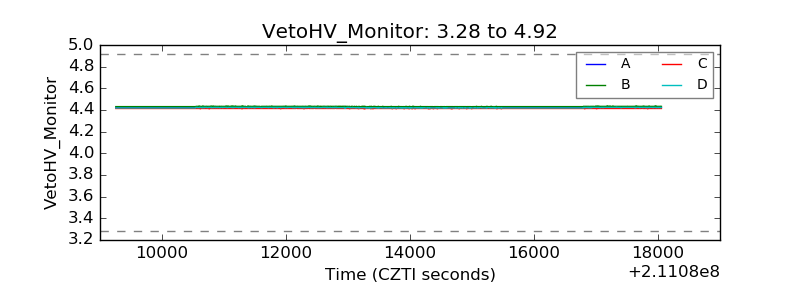 |
| Veto LLD | 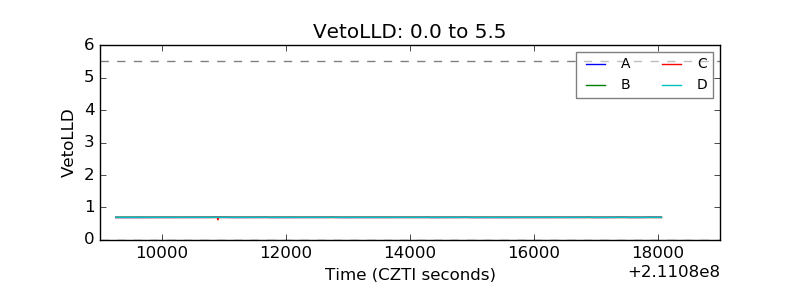 |
| Alpha Counter | 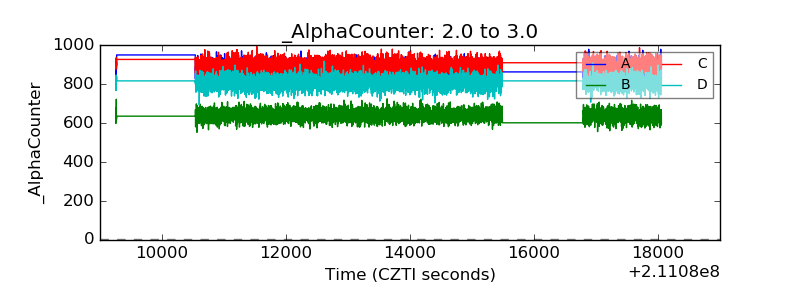 |
| _CPM_Rate | 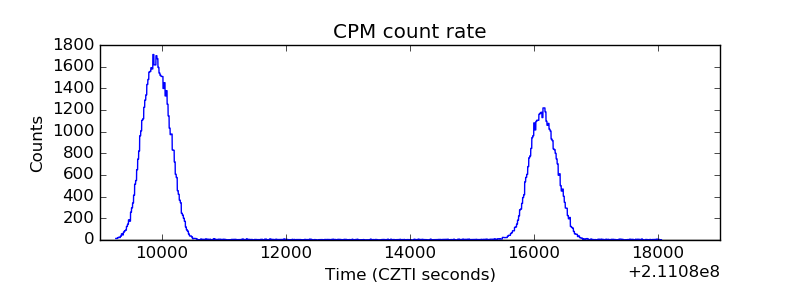 |
| CZT Counter | 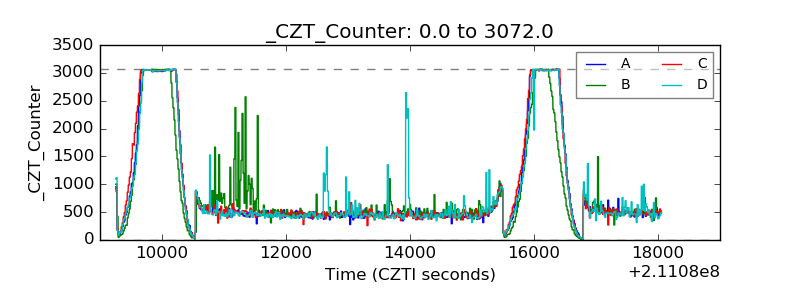 |
| +2.5 Volts monitor |  |
| +5 Volts monitor |  |
| _ROLL_ROT | 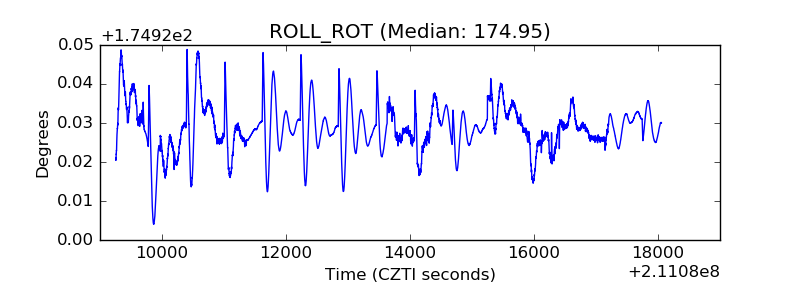 |
| _Roll_DEC | 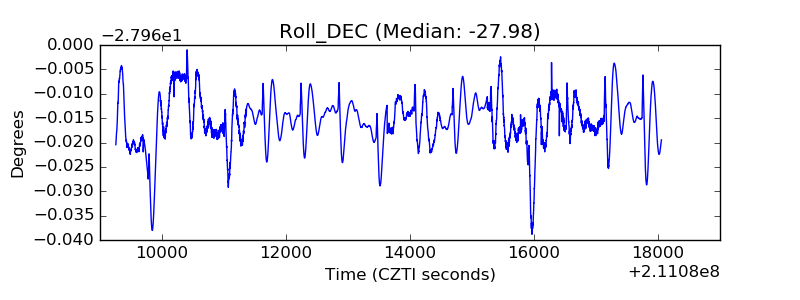 |
| _Roll_RA | 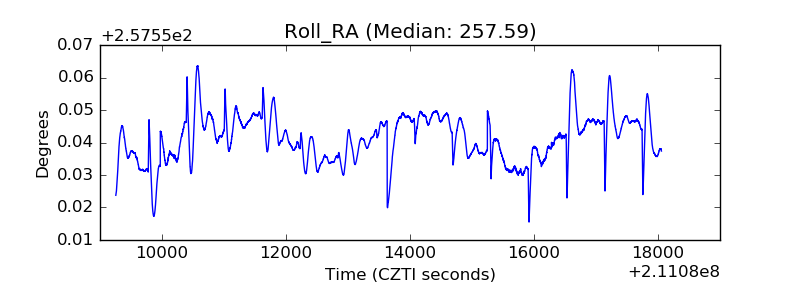 |
| Veto Counter | 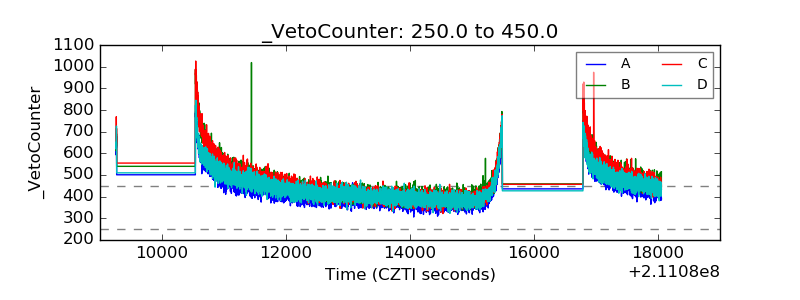 |