| Param | Original file | Final file |
|---|---|---|
| Filename | modeM0/AS1G05_102T01_9000000650_05139cztM0_level2.evt | modeM0/AS1G05_102T01_9000000650_05139cztM0_level2_quad_clean.evt |
| Size (bytes) | 491,411,520 | 77,005,440 |
| Size | 468.6 MB | 73.4 MB |
| Events in quadrant A | 3,291,495 | 472,906 |
| Events in quadrant B | 3,665,368 | 475,078 |
| Events in quadrant C | 3,249,071 | 474,464 |
| Events in quadrant D | 4,227,344 | 447,973 |
| Mode M0 | |||
|---|---|---|---|
| Quadrant | BADHDUFLAG | Total packets | Discarded packets |
| A | 0 | 13928 | 3 |
| B | 0 | 14868 | 2 |
| C | 0 | 13956 | 2 |
| D | 0 | 16911 | 2 |
| Mode M9 | |||
|---|---|---|---|
| Quadrant | BADHDUFLAG | Total packets | Discarded packets |
| A | 0 | 25 | 0 |
| B | 0 | 25 | 0 |
| C | 0 | 25 | 0 |
| D | 0 | 25 | 0 |
| Mode SS | |||
|---|---|---|---|
| Quadrant | BADHDUFLAG | Total packets | Discarded packets |
| A | 0 | 136 | 0 |
| B | 0 | 136 | 0 |
| C | 0 | 136 | 0 |
| D | 0 | 136 | 0 |
| Quadrant | Total seconds | Saturated seconds | Saturation percentage |
|---|---|---|---|
| A | 6612 | 160 | 2.419843% |
| B | 6612 | 210 | 3.176044% |
| C | 6612 | 173 | 2.616455% |
| D | 6612 | 347 | 5.248034% |
Noise dominated data is calculated using 1-second bins in cleaned event files. If a bin has >2000 counts, and if more than 50% of those come from <1% of pixels, then it is considered to be noise-dominated and hence unusable.
| Quadrant | # 1 sec bins | Bins with >0 counts | Bins with >2000 counts | High rate bins dominated by noise | Noise dominated (total time) | Noise dominated (detector-on time) | Marked lightcurve |
|---|---|---|---|---|---|---|---|
| A | 9107 | 6613 | 3 | 3 | 0.03% | 0.05% | 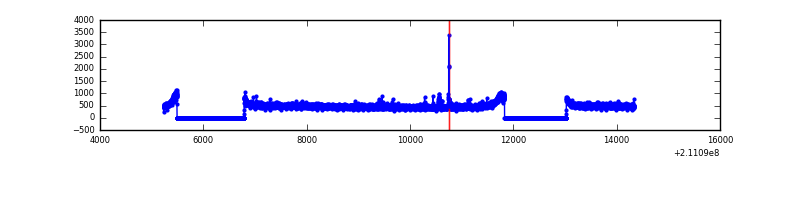 |
| B | 9107 | 6614 | 23 | 23 | 0.25% | 0.35% | 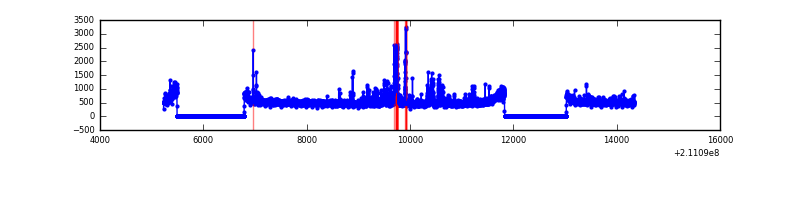 |
| C | 9107 | 6614 | 0 | 0 | 0.00% | 0.00% | 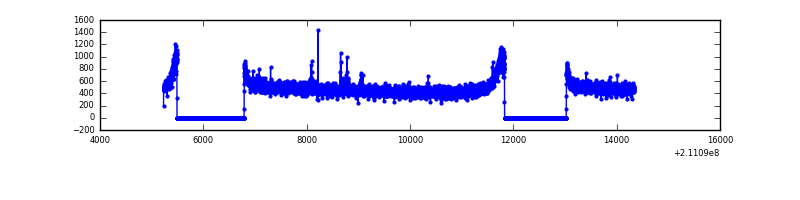 |
| D | 9107 | 6614 | 104 | 104 | 1.14% | 1.57% | 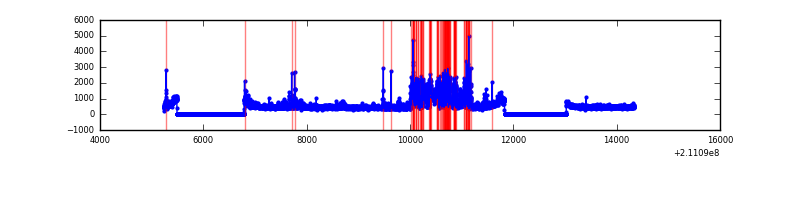 |
Top three noisy pixels from each quadrant. If the there are fewer than three noisy pixels in the level2.evt file, extra rows are filled as -1
| Pixel properties | Quadrant properties | ||||||
|---|---|---|---|---|---|---|---|
| Quadrant | DetID | PixID | Counts | Sigma | Mean | Median | Sigma |
| A | 0 | 50 | 41791 | 237.06 | 845 | 826 | 172.8 |
| A | 12 | 194 | 8296 | 43.23 | 845 | 826 | 172.8 |
| A | 0 | 226 | 8224 | 42.81 | 845 | 826 | 172.8 |
| B | 8 | 3 | 232098 | 1424.98 | 851 | 832 | 162.3 |
| B | 4 | 80 | 41711 | 251.88 | 851 | 832 | 162.3 |
| B | 10 | 16 | 22759 | 135.11 | 851 | 832 | 162.3 |
| C | 12 | 4 | 16380 | 81.87 | 823 | 828 | 189.9 |
| C | 1 | 16 | 13633 | 67.41 | 823 | 828 | 189.9 |
| C | 13 | 61 | 6610 | 30.44 | 823 | 828 | 189.9 |
| D | 2 | 33 | 873760 | 4352.21 | 818 | 793 | 200.6 |
| D | 1 | 239 | 104601 | 517.54 | 818 | 793 | 200.6 |
| D | 12 | 233 | 85240 | 421.01 | 818 | 793 | 200.6 |
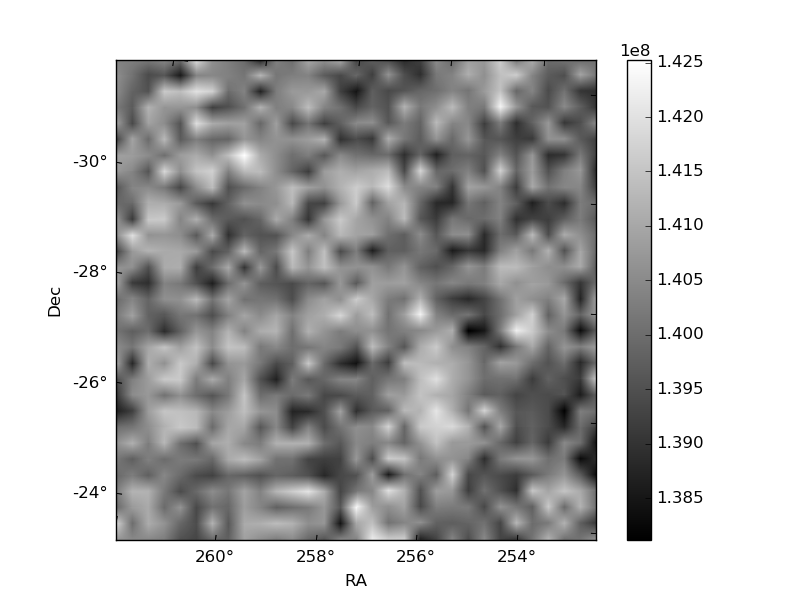
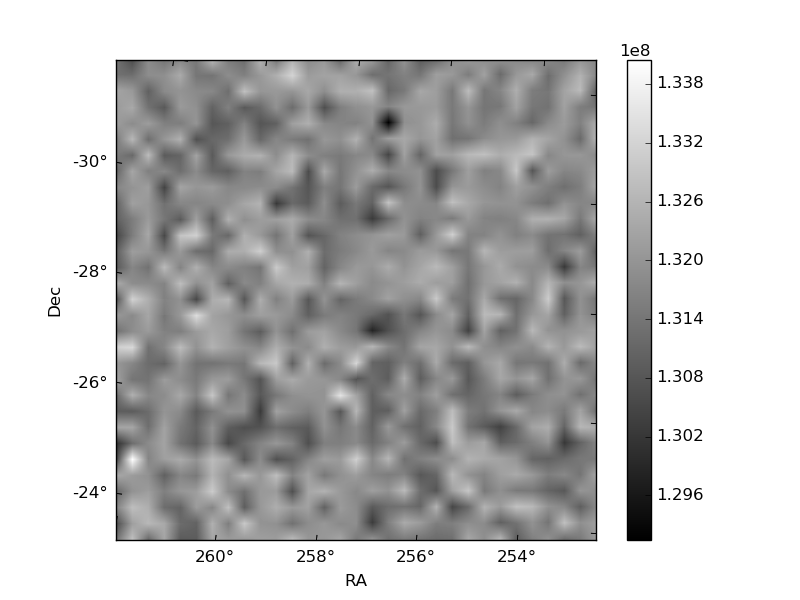
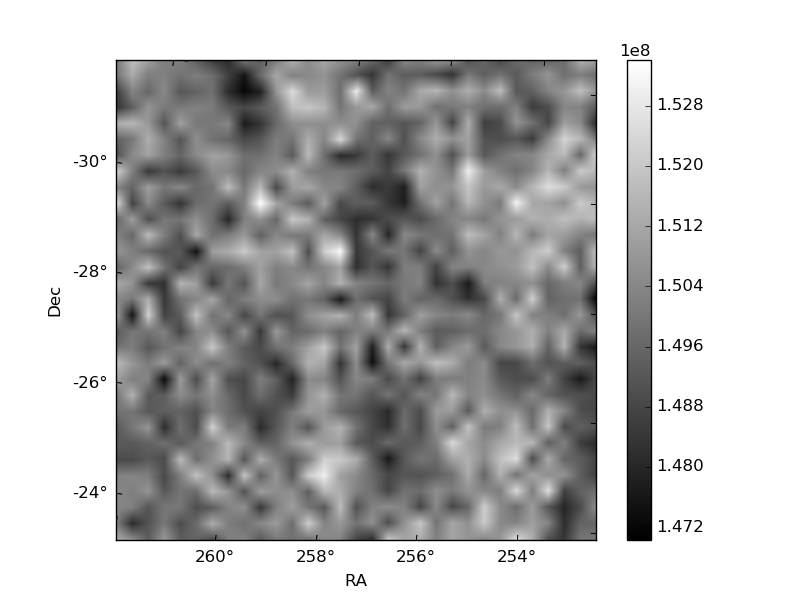
Histogram calculated using DETX and DETY for each event in the final _common_clean file
| Quadrant A | 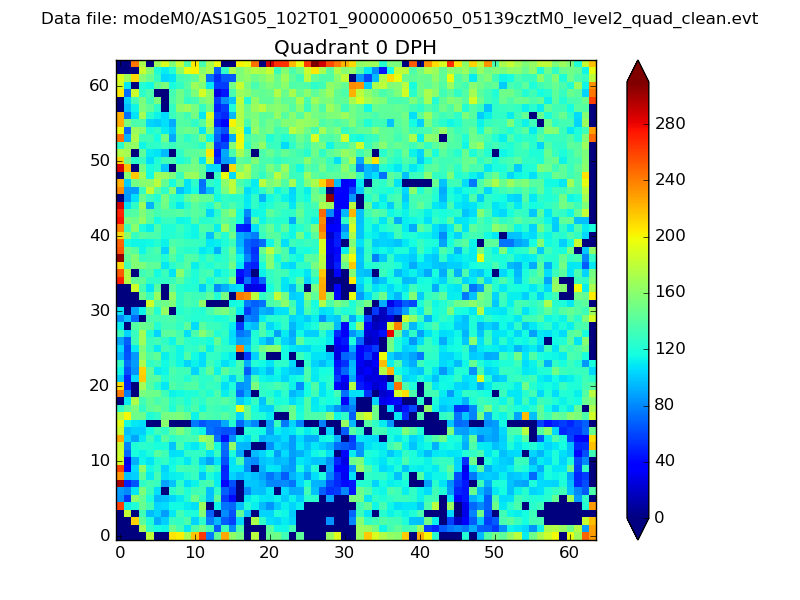 |
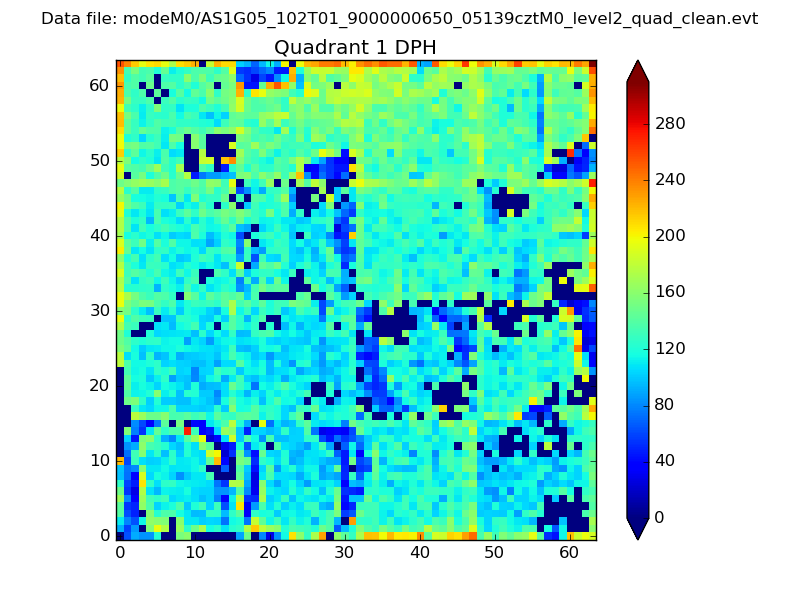 |
Quadrant B |
|---|---|---|---|
| Quadrant D | 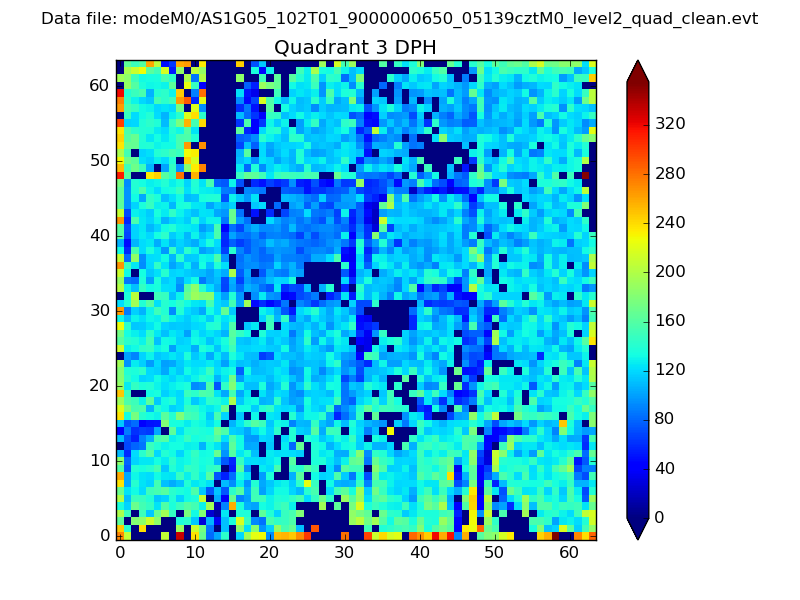 |
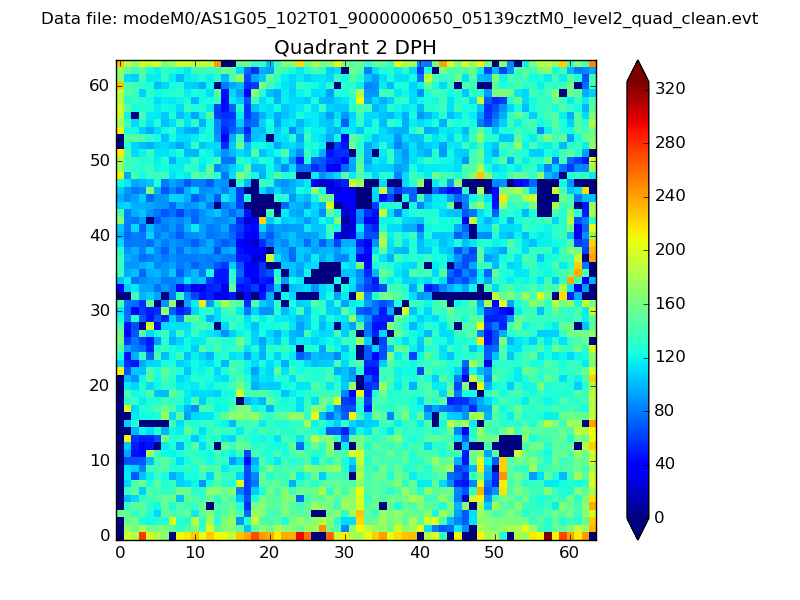 |
Quadrant C |
| Plot type | Count rate plots | Images |
|---|---|---|
| Comparison with Poisson distribution Blue bars denote a histogram of data divided into 1 sec bins. Red curve is a Poisson curve with rate = median count rate of data. |
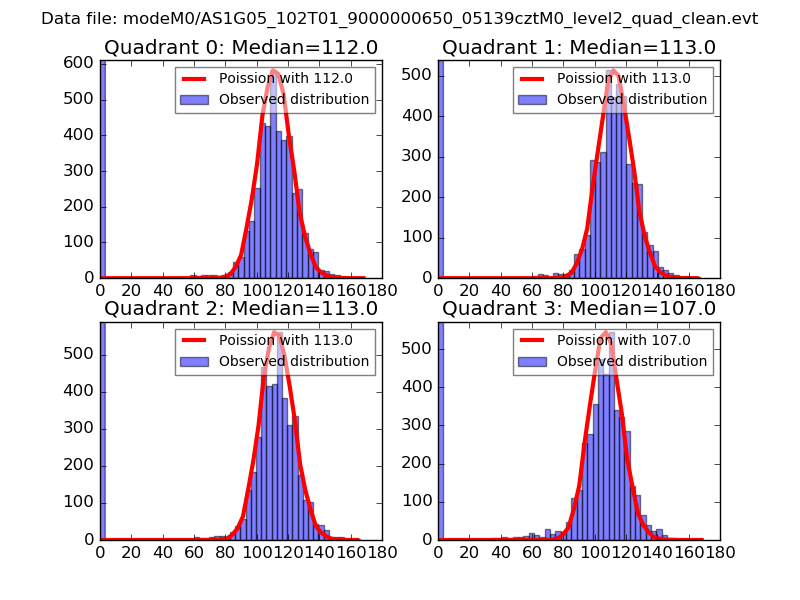 |
 |
| Quadrant-wise count rates Data is divided into 100 sec bins |
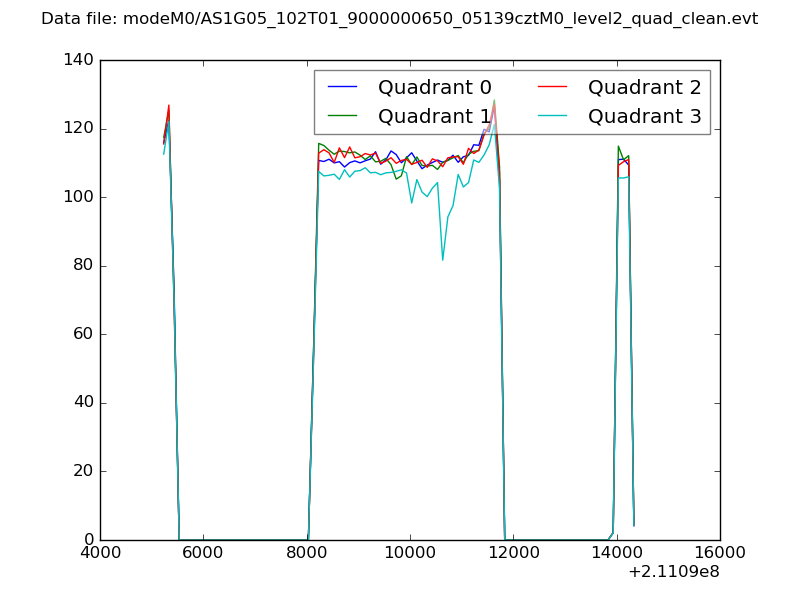 |
|
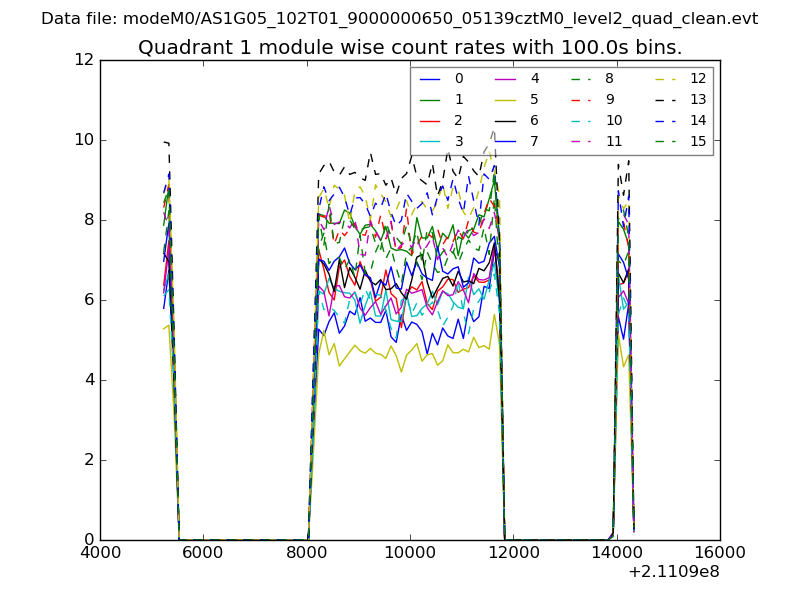
| Module-wise count rates for Quadrant A Data is divided into 100 sec bins |
 |
 |
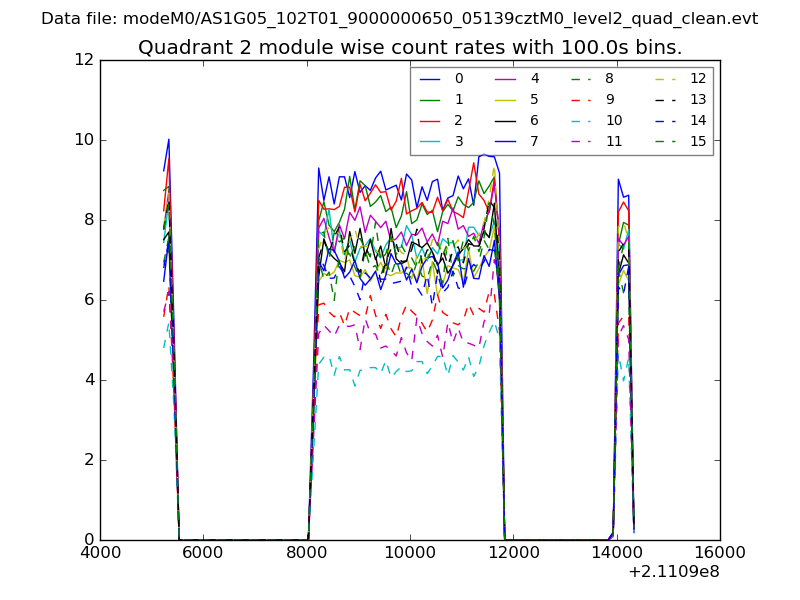
| Module-wise count rates for Quadrant B Data is divided into 100 sec bins |
 |
 |
| Module-wise count rates for Quadrant C Data is divided into 100 sec bins |
 |
 |
| Module-wise count rates for Quadrant D Data is divided into 100 sec bins |
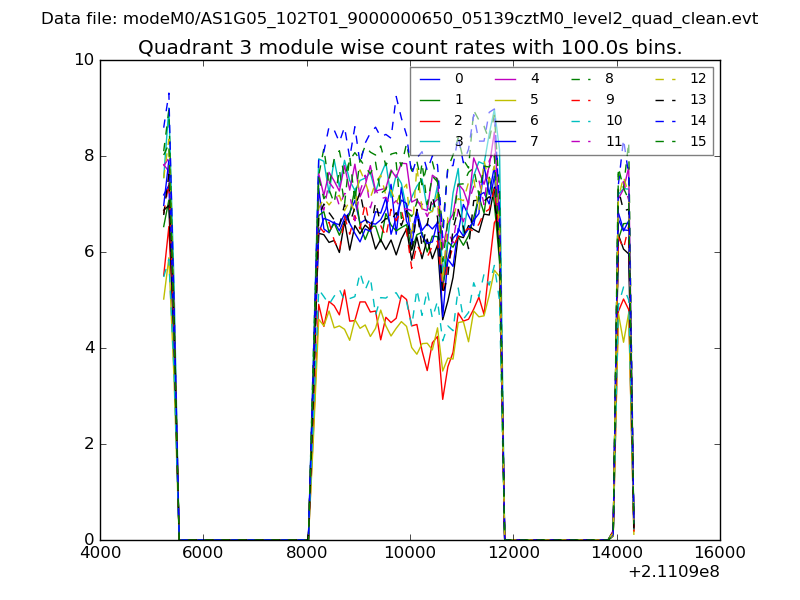 |
 |
| Parameter | Plot |
|---|---|
| CZT HV Monitor | 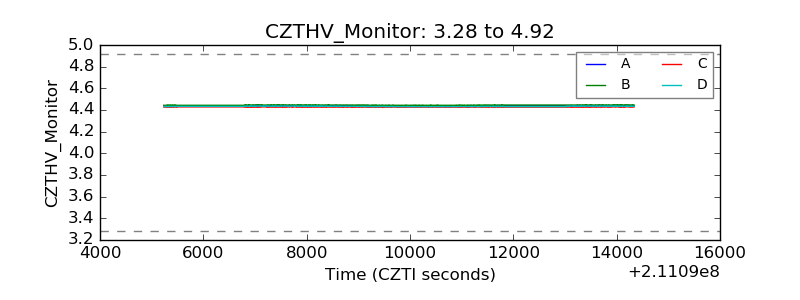 |
| D_VDD | 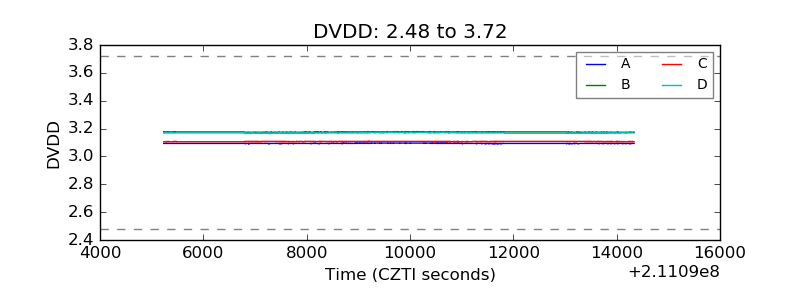 |
| Temperature 1 | 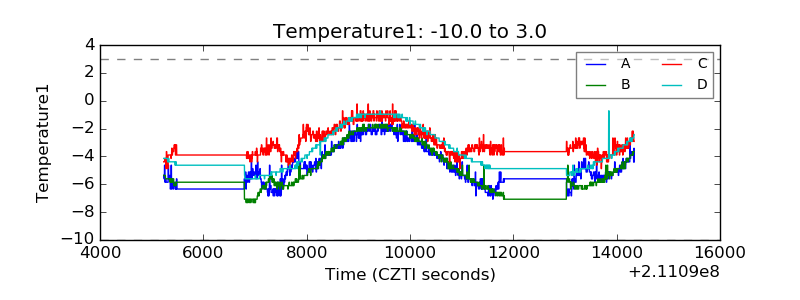 |
| Veto HV Monitor | 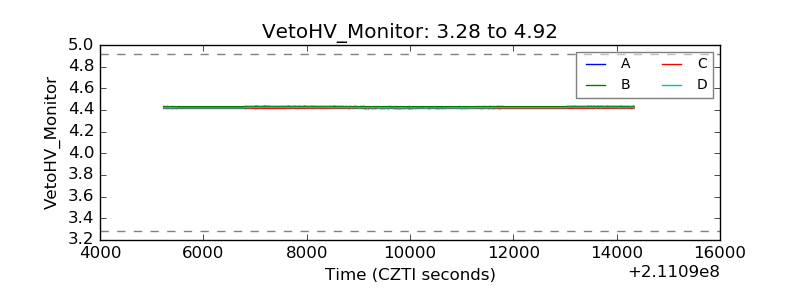 |
| Veto LLD | 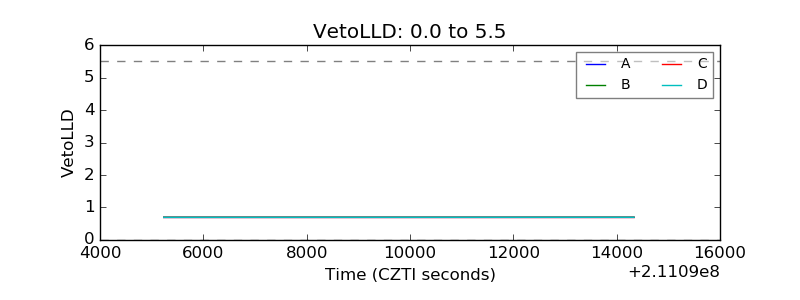 |
| Alpha Counter | 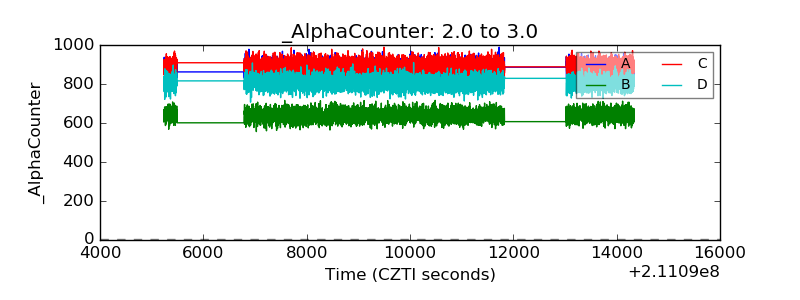 |
| _CPM_Rate |  |
| CZT Counter | 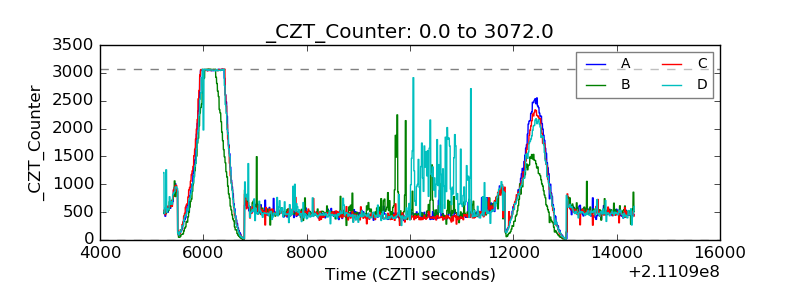 |
| +2.5 Volts monitor |  |
| +5 Volts monitor |  |
| _ROLL_ROT | 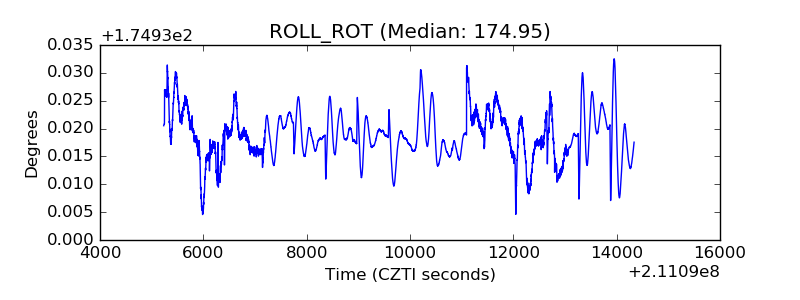 |
| _Roll_DEC | 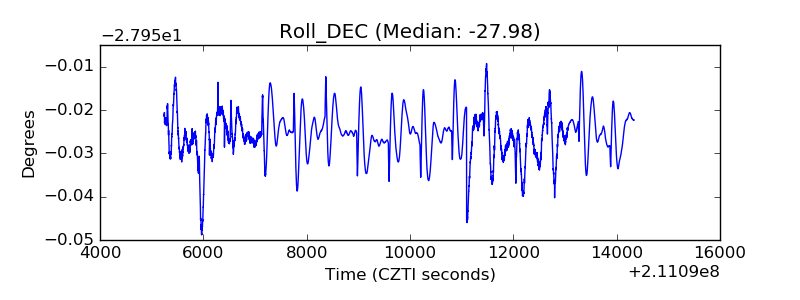 |
| _Roll_RA | 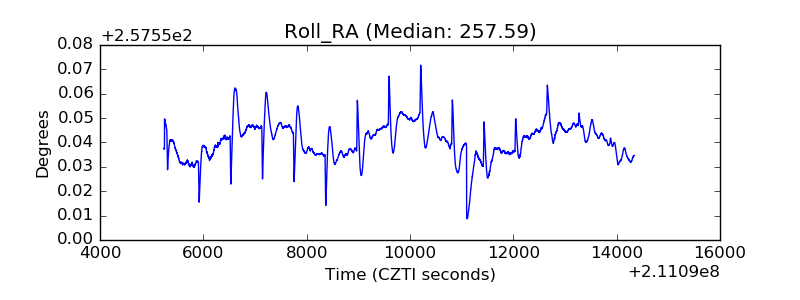 |
| Veto Counter | 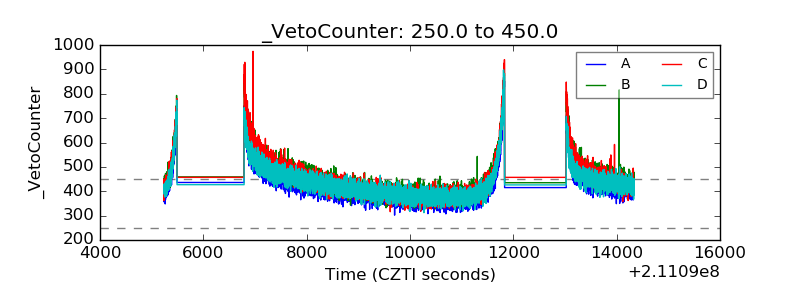 |