| Param | Original file | Final file |
|---|---|---|
| Filename | modeM0/AS1G05_102T01_9000000650_05140cztM0_level2.evt | modeM0/AS1G05_102T01_9000000650_05140cztM0_level2_quad_clean.evt |
| Size (bytes) | 482,564,160 | 77,941,440 |
| Size | 460.2 MB | 74.3 MB |
| Events in quadrant A | 3,124,525 | 480,013 |
| Events in quadrant B | 3,370,035 | 479,565 |
| Events in quadrant C | 3,081,568 | 483,923 |
| Events in quadrant D | 4,589,286 | 455,694 |
| Mode M0 | |||
|---|---|---|---|
| Quadrant | BADHDUFLAG | Total packets | Discarded packets |
| A | 0 | 13615 | 3 |
| B | 0 | 14105 | 2 |
| C | 0 | 13624 | 2 |
| D | 0 | 18033 | 2 |
| Mode M9 | |||
|---|---|---|---|
| Quadrant | BADHDUFLAG | Total packets | Discarded packets |
| A | 0 | 11 | 0 |
| B | 0 | 11 | 0 |
| C | 0 | 11 | 0 |
| D | 0 | 12 | 0 |
| Mode SS | |||
|---|---|---|---|
| Quadrant | BADHDUFLAG | Total packets | Discarded packets |
| A | 0 | 134 | 0 |
| B | 0 | 134 | 0 |
| C | 0 | 134 | 0 |
| D | 0 | 134 | 0 |
| Quadrant | Total seconds | Saturated seconds | Saturation percentage |
|---|---|---|---|
| A | 6609 | 131 | 1.982146% |
| B | 6609 | 143 | 2.163716% |
| C | 6609 | 101 | 1.528219% |
| D | 6609 | 515 | 7.792404% |
Noise dominated data is calculated using 1-second bins in cleaned event files. If a bin has >2000 counts, and if more than 50% of those come from <1% of pixels, then it is considered to be noise-dominated and hence unusable.
| Quadrant | # 1 sec bins | Bins with >0 counts | Bins with >2000 counts | High rate bins dominated by noise | Noise dominated (total time) | Noise dominated (detector-on time) | Marked lightcurve |
|---|---|---|---|---|---|---|---|
| A | 7619 | 6609 | 0 | 0 | 0.00% | 0.00% | 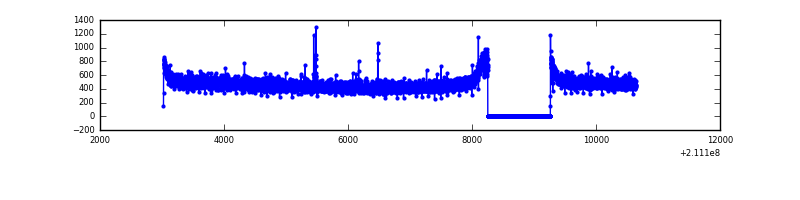 |
| B | 7619 | 6610 | 6 | 6 | 0.08% | 0.09% | 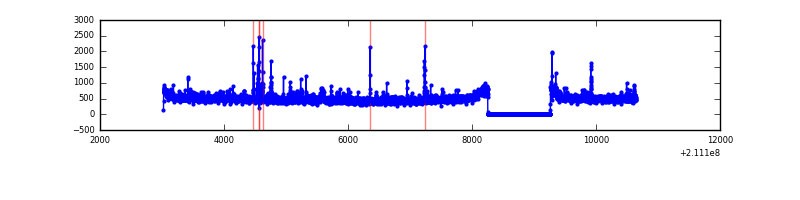 |
| C | 7619 | 6610 | 0 | 0 | 0.00% | 0.00% | 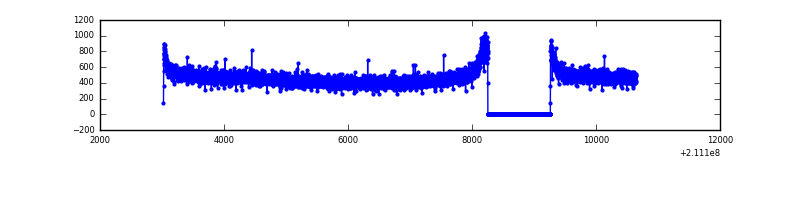 |
| D | 7619 | 6610 | 332 | 332 | 4.36% | 5.02% | 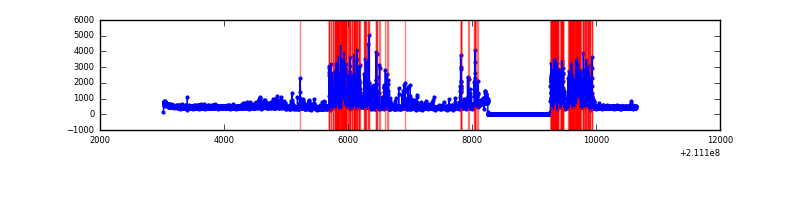 |
Top three noisy pixels from each quadrant. If the there are fewer than three noisy pixels in the level2.evt file, extra rows are filled as -1
| Pixel properties | Quadrant properties | ||||||
|---|---|---|---|---|---|---|---|
| Quadrant | DetID | PixID | Counts | Sigma | Mean | Median | Sigma |
| A | 0 | 50 | 11523 | 65.11 | 809 | 792 | 164.8 |
| A | 12 | 194 | 8210 | 45.01 | 809 | 792 | 164.8 |
| A | 0 | 226 | 7944 | 43.39 | 809 | 792 | 164.8 |
| B | 4 | 80 | 62433 | 394.55 | 812 | 793 | 156.2 |
| B | 8 | 3 | 44764 | 281.46 | 812 | 793 | 156.2 |
| B | 10 | 16 | 40975 | 257.2 | 812 | 793 | 156.2 |
| C | 1 | 16 | 18012 | 94.49 | 785 | 790 | 182.3 |
| C | 13 | 61 | 6300 | 30.23 | 785 | 790 | 182.3 |
| C | 7 | 159 | 2031 | 6.81 | 785 | 790 | 182.3 |
| D | 12 | 233 | 1113597 | 5889.77 | 766 | 742 | 188.9 |
| D | 2 | 33 | 392469 | 2073.21 | 766 | 742 | 188.9 |
| D | 1 | 239 | 68404 | 358.1 | 766 | 742 | 188.9 |
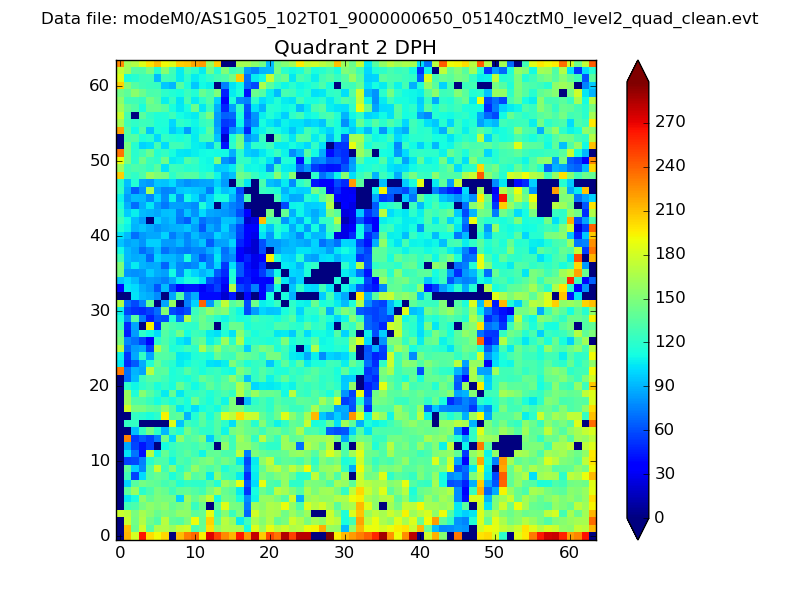
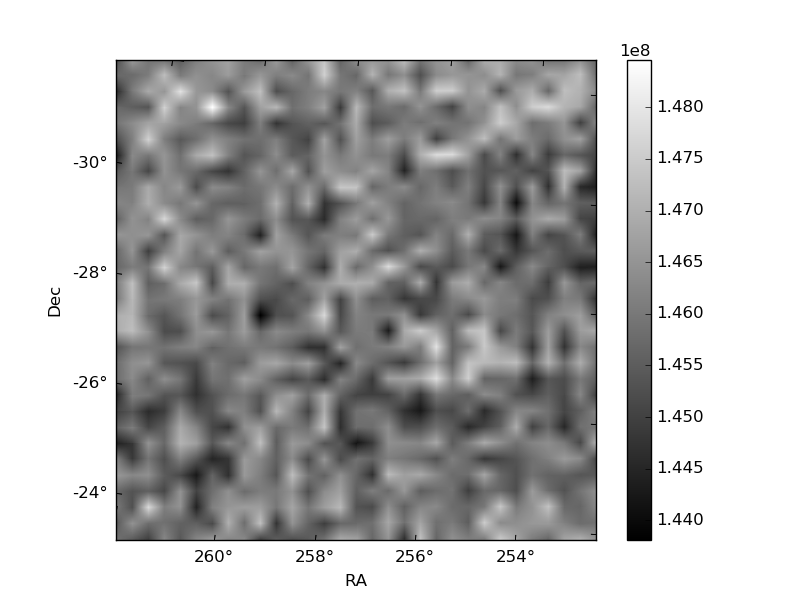
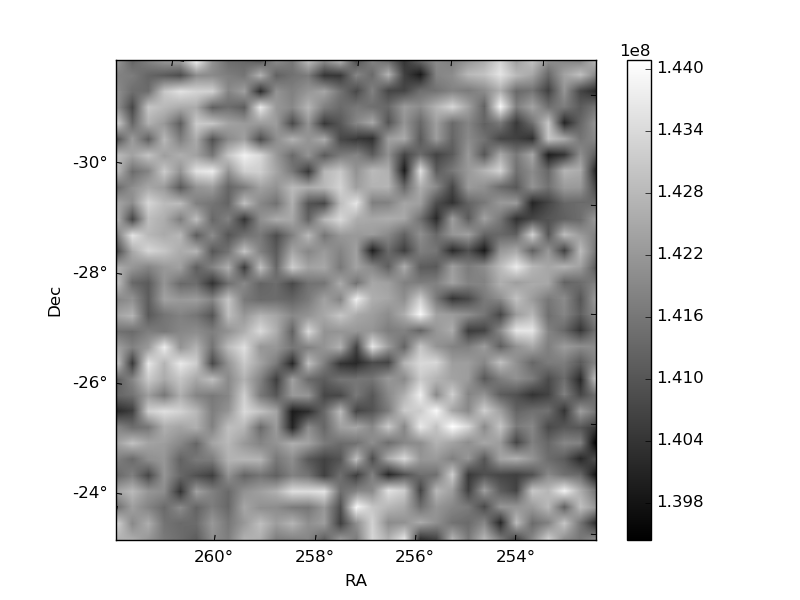
Histogram calculated using DETX and DETY for each event in the final _common_clean file
| Quadrant A | 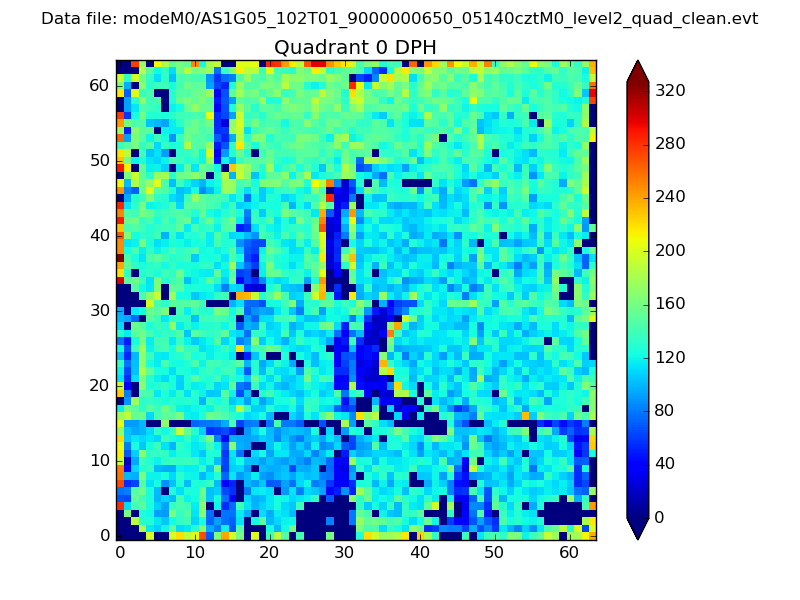 |
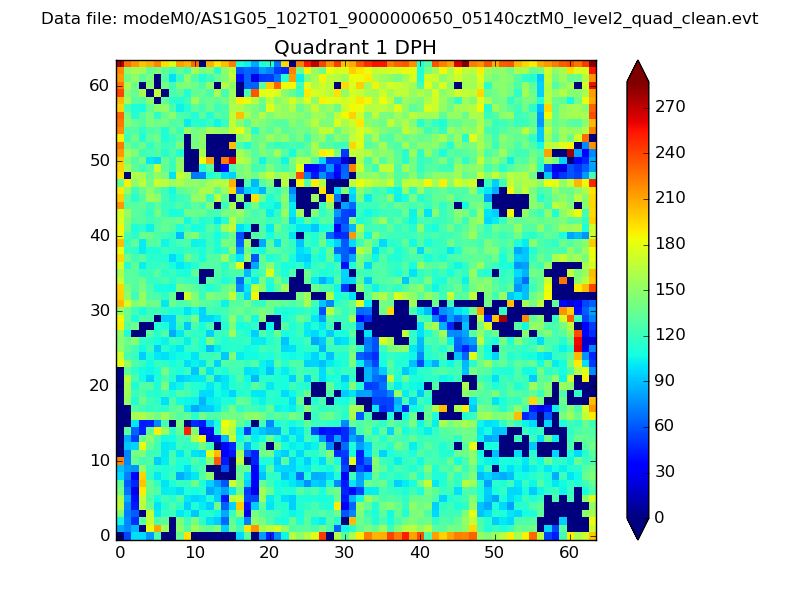 |
Quadrant B |
|---|---|---|---|
| Quadrant D | 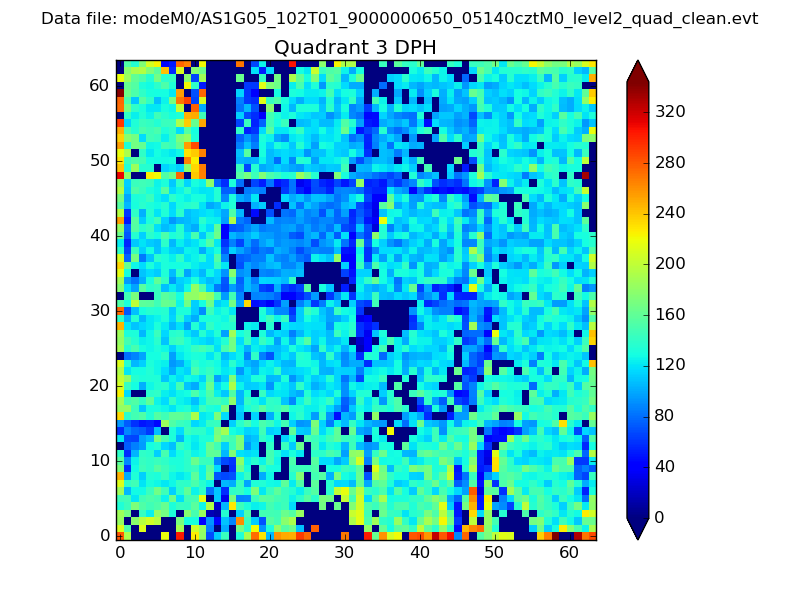 |
 |
Quadrant C |
| Plot type | Count rate plots | Images |
|---|---|---|
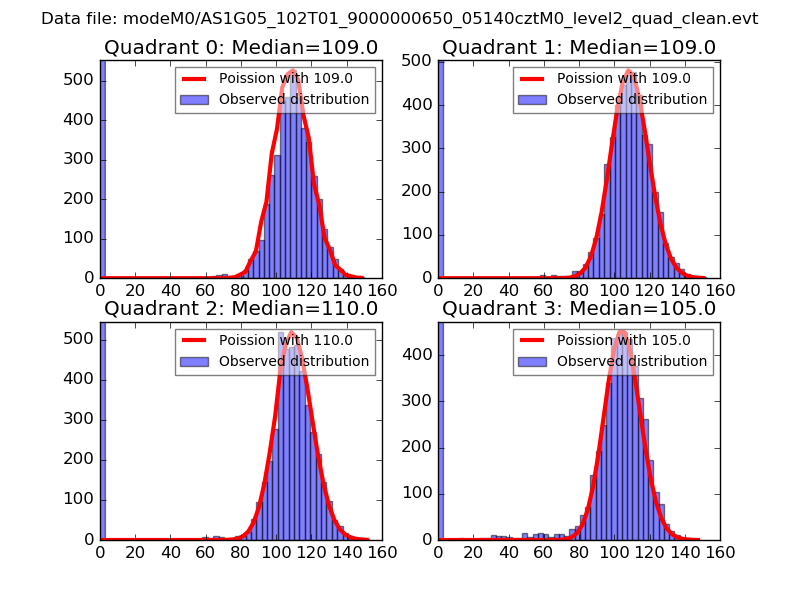
| Comparison with Poisson distribution Blue bars denote a histogram of data divided into 1 sec bins. Red curve is a Poisson curve with rate = median count rate of data. |
 |
 |
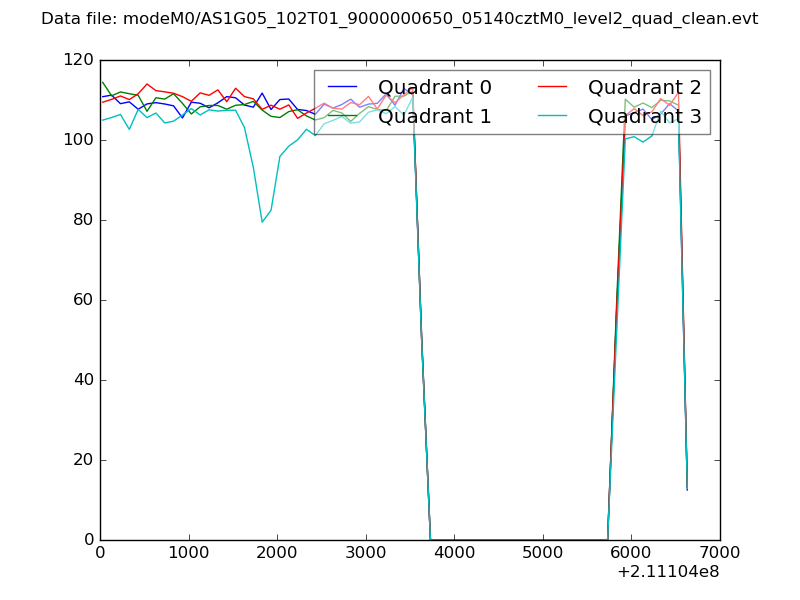
| Quadrant-wise count rates Data is divided into 100 sec bins |
 |
|
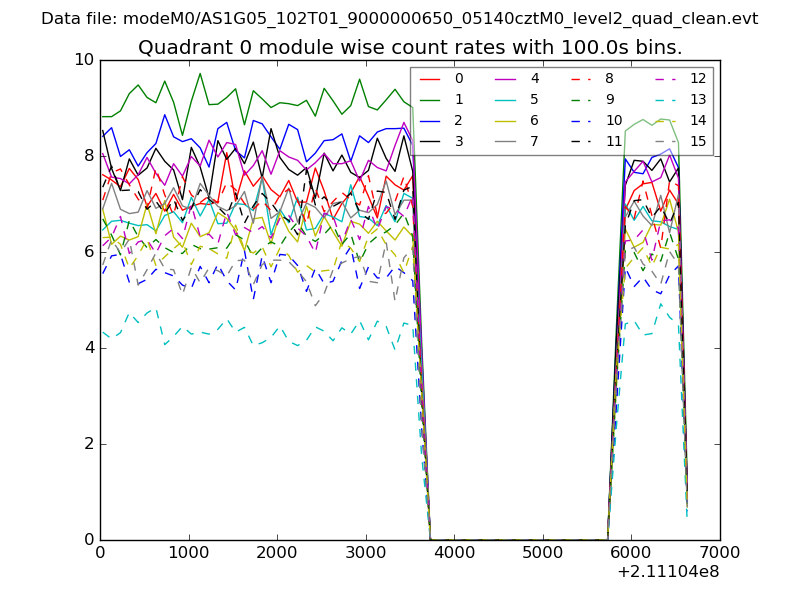
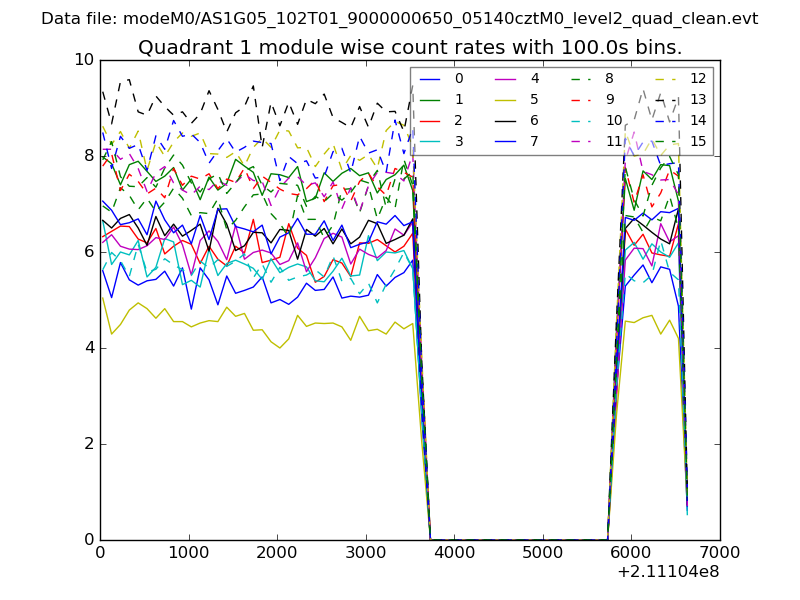
| Module-wise count rates for Quadrant A Data is divided into 100 sec bins |
 |
 |
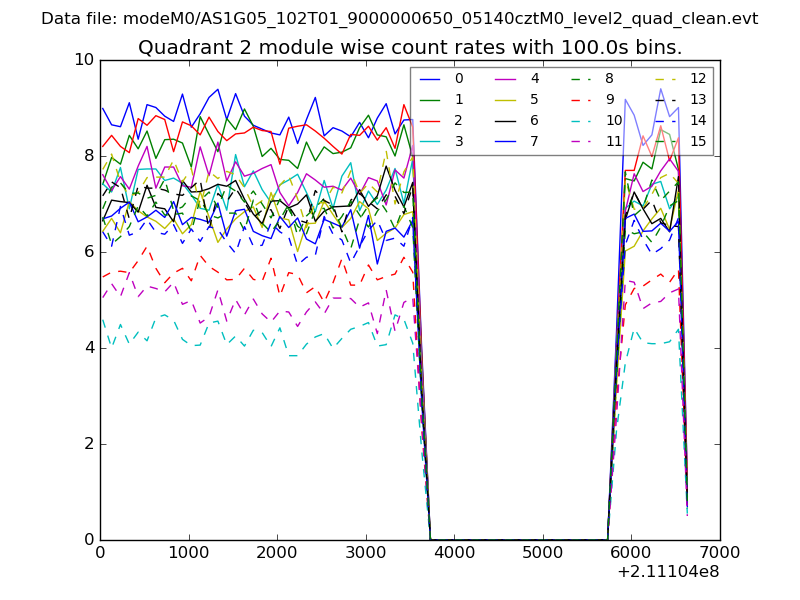
| Module-wise count rates for Quadrant B Data is divided into 100 sec bins |
 |
 |
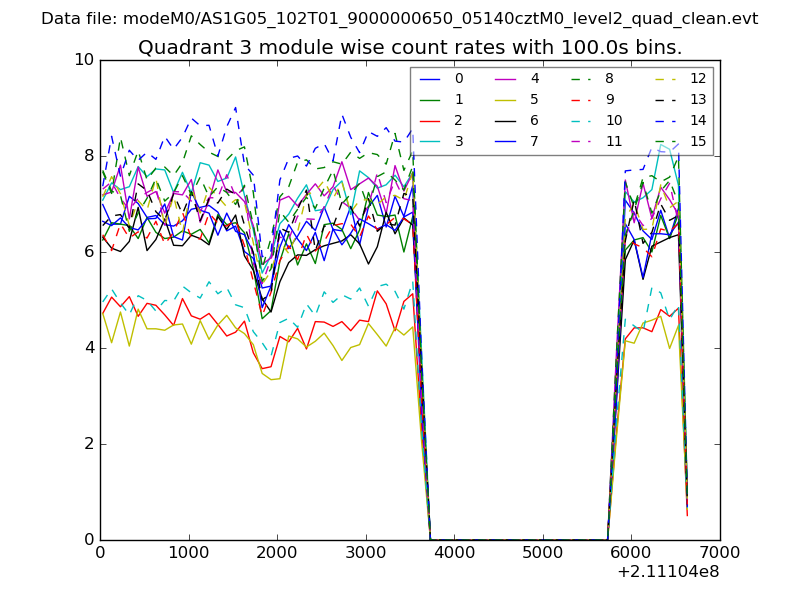
| Module-wise count rates for Quadrant C Data is divided into 100 sec bins |
 |
 |
| Module-wise count rates for Quadrant D Data is divided into 100 sec bins |
 |
 |
| Parameter | Plot |
|---|---|
| CZT HV Monitor | 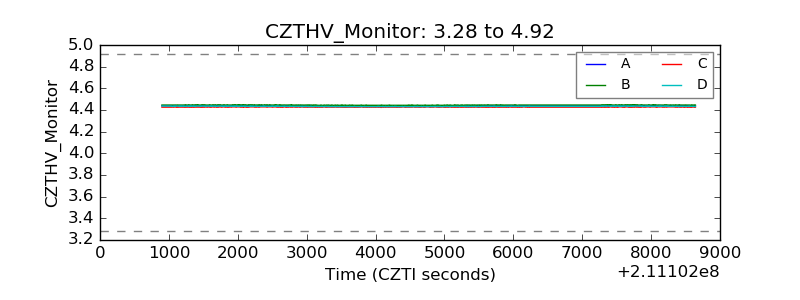 |
| D_VDD | 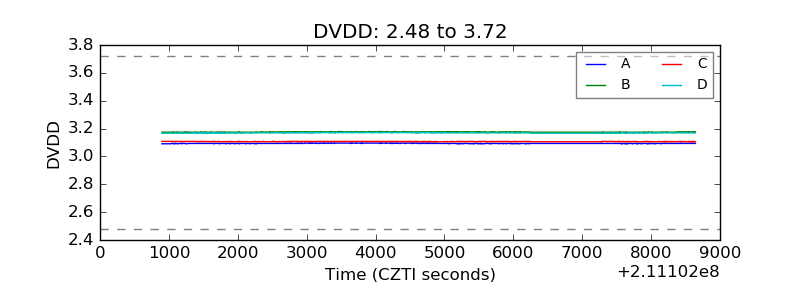 |
| Temperature 1 | 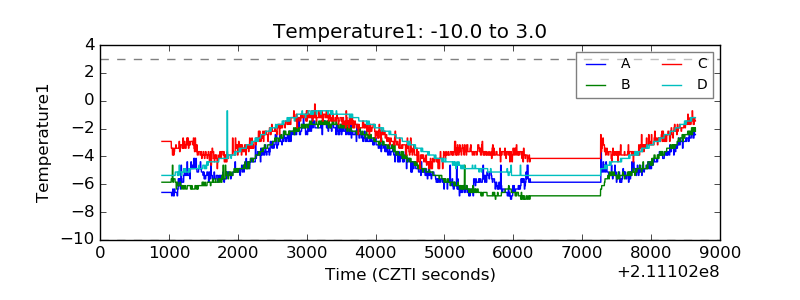 |
| Veto HV Monitor | 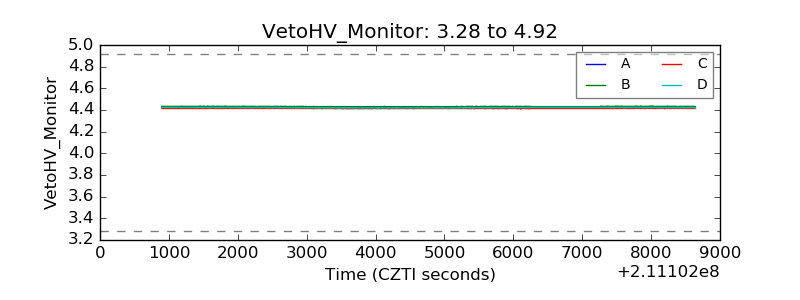 |
| Veto LLD | 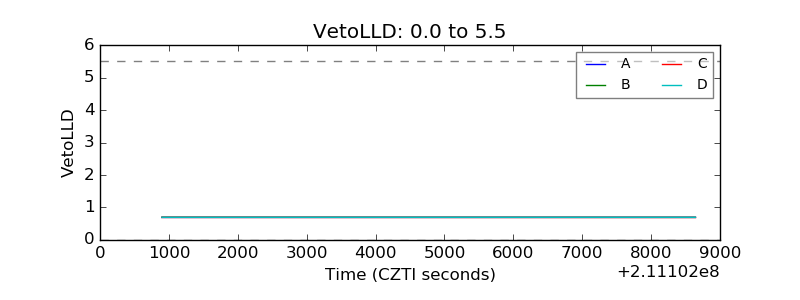 |
| Alpha Counter | 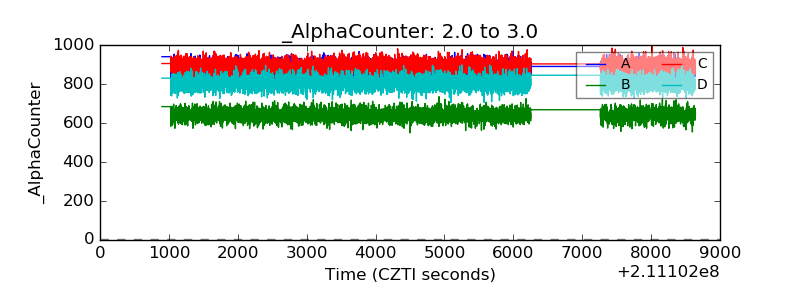 |
| _CPM_Rate | 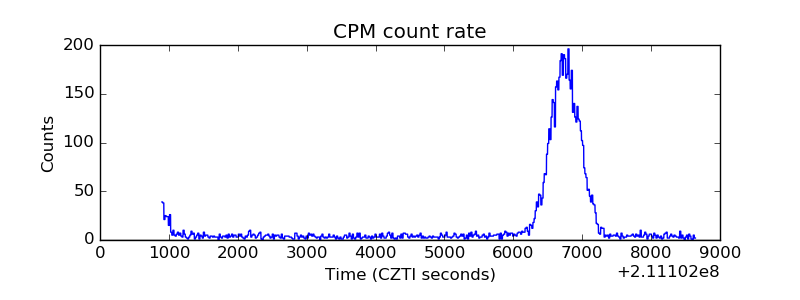 |
| CZT Counter | 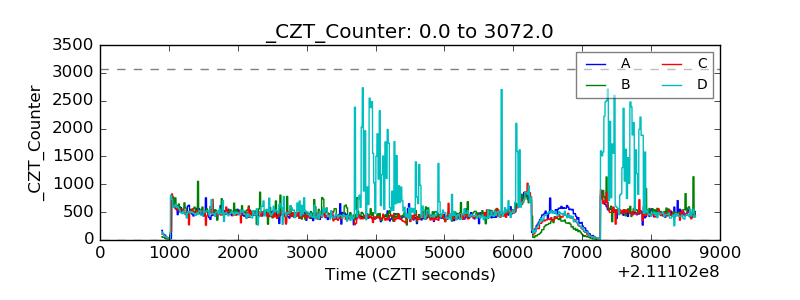 |
| +2.5 Volts monitor | 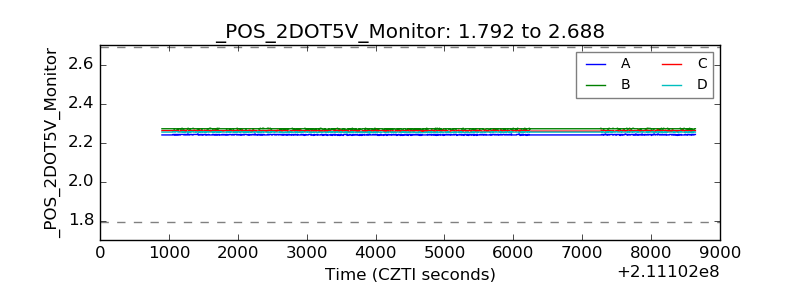 |
| +5 Volts monitor | 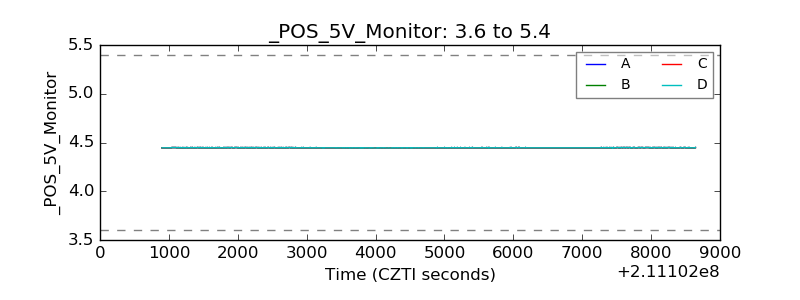 |
| _ROLL_ROT | 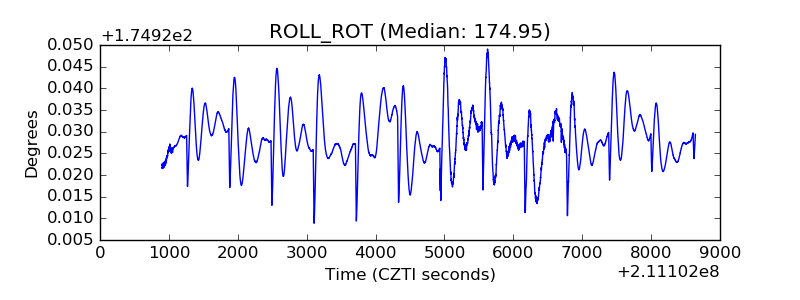 |
| _Roll_DEC | 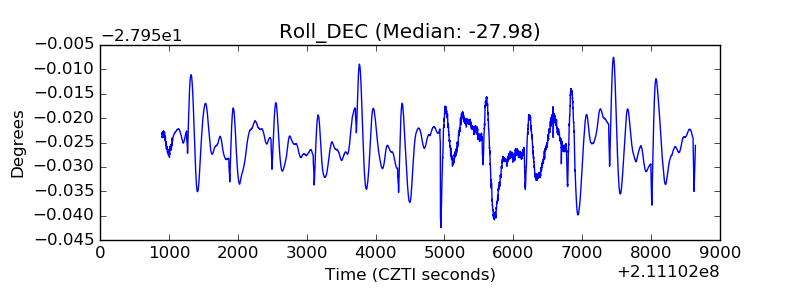 |
| _Roll_RA | 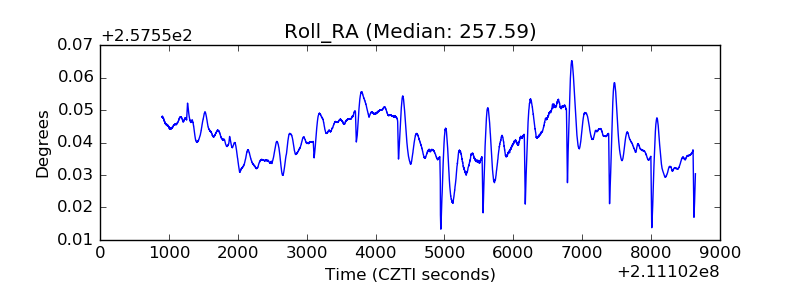 |
| Veto Counter | 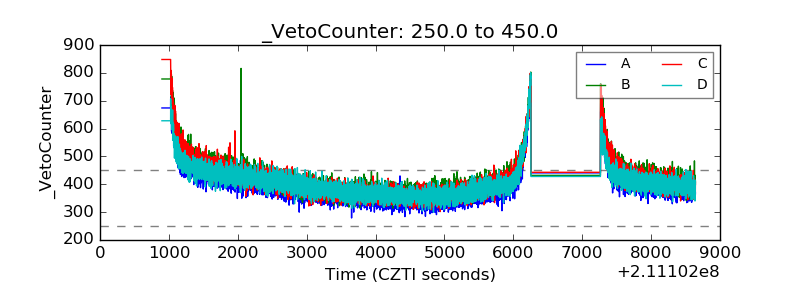 |