| Param | Original file | Final file |
|---|---|---|
| Filename | modeM0/AS1G05_102T01_9000000650_05142cztM0_level2.evt | modeM0/AS1G05_102T01_9000000650_05142cztM0_level2_quad_clean.evt |
| Size (bytes) | 519,324,480 | 90,423,360 |
| Size | 495.3 MB | 86.2 MB |
| Events in quadrant A | 3,592,606 | 556,859 |
| Events in quadrant B | 3,858,544 | 559,761 |
| Events in quadrant C | 3,422,053 | 561,416 |
| Events in quadrant D | 4,338,275 | 531,476 |
| Mode M0 | |||
|---|---|---|---|
| Quadrant | BADHDUFLAG | Total packets | Discarded packets |
| A | 0 | 15984 | 3 |
| B | 0 | 16445 | 2 |
| C | 0 | 15642 | 2 |
| D | 0 | 18360 | 2 |
| Mode M9 | |||
|---|---|---|---|
| Quadrant | BADHDUFLAG | Total packets | Discarded packets |
| A | 0 | 2 | 0 |
| B | 0 | 2 | 0 |
| C | 0 | 2 | 0 |
| D | 0 | 2 | 0 |
| Mode SS | |||
|---|---|---|---|
| Quadrant | BADHDUFLAG | Total packets | Discarded packets |
| A | 0 | 158 | 0 |
| B | 0 | 158 | 0 |
| C | 0 | 158 | 0 |
| D | 0 | 158 | 0 |
| Quadrant | Total seconds | Saturated seconds | Saturation percentage |
|---|---|---|---|
| A | 7594 | 105 | 1.382671% |
| B | 7594 | 102 | 1.343166% |
| C | 7594 | 50 | 0.658415% |
| D | 7594 | 225 | 2.962865% |
Noise dominated data is calculated using 1-second bins in cleaned event files. If a bin has >2000 counts, and if more than 50% of those come from <1% of pixels, then it is considered to be noise-dominated and hence unusable.
| Quadrant | # 1 sec bins | Bins with >0 counts | Bins with >2000 counts | High rate bins dominated by noise | Noise dominated (total time) | Noise dominated (detector-on time) | Marked lightcurve |
|---|---|---|---|---|---|---|---|
| A | 7884 | 7596 | 29 | 29 | 0.37% | 0.38% | 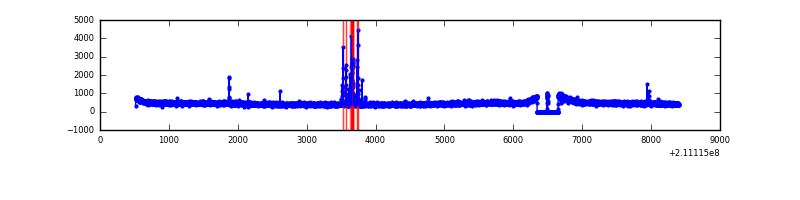 |
| B | 7884 | 7596 | 4 | 4 | 0.05% | 0.05% | 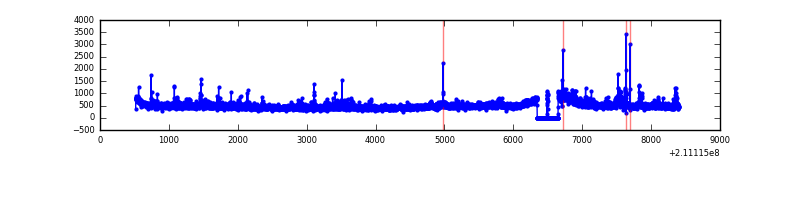 |
| C | 7884 | 7596 | 0 | 0 | 0.00% | 0.00% | 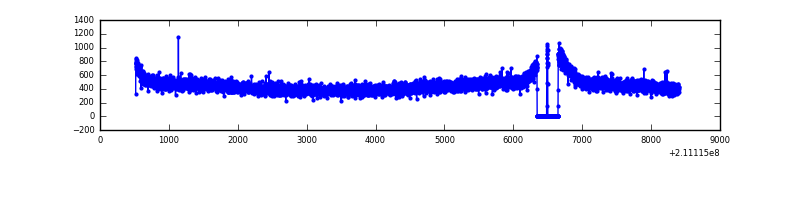 |
| D | 7884 | 7596 | 112 | 112 | 1.42% | 1.47% | 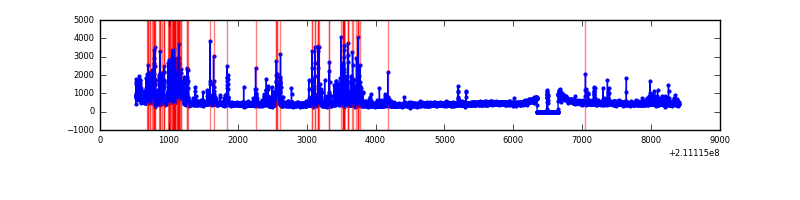 |
Top three noisy pixels from each quadrant. If the there are fewer than three noisy pixels in the level2.evt file, extra rows are filled as -1
| Pixel properties | Quadrant properties | ||||||
|---|---|---|---|---|---|---|---|
| Quadrant | DetID | PixID | Counts | Sigma | Mean | Median | Sigma |
| A | 0 | 50 | 124155 | 660.46 | 901 | 878 | 186.7 |
| A | 12 | 194 | 8966 | 43.33 | 901 | 878 | 186.7 |
| A | 0 | 226 | 8884 | 42.89 | 901 | 878 | 186.7 |
| B | 8 | 3 | 120219 | 678.76 | 906 | 885 | 175.8 |
| B | 15 | 204 | 87954 | 495.24 | 906 | 885 | 175.8 |
| B | 4 | 80 | 62858 | 352.49 | 906 | 885 | 175.8 |
| C | 1 | 16 | 9570 | 42.71 | 873 | 878 | 203.5 |
| C | 13 | 61 | 7001 | 30.09 | 873 | 878 | 203.5 |
| C | 14 | 67 | 3523 | 13.0 | 873 | 878 | 203.5 |
| D | 12 | 233 | 575959 | 2673.77 | 872 | 845 | 215.1 |
| D | 2 | 33 | 356111 | 1651.67 | 872 | 845 | 215.1 |
| D | 2 | 14 | 32962 | 149.32 | 872 | 845 | 215.1 |
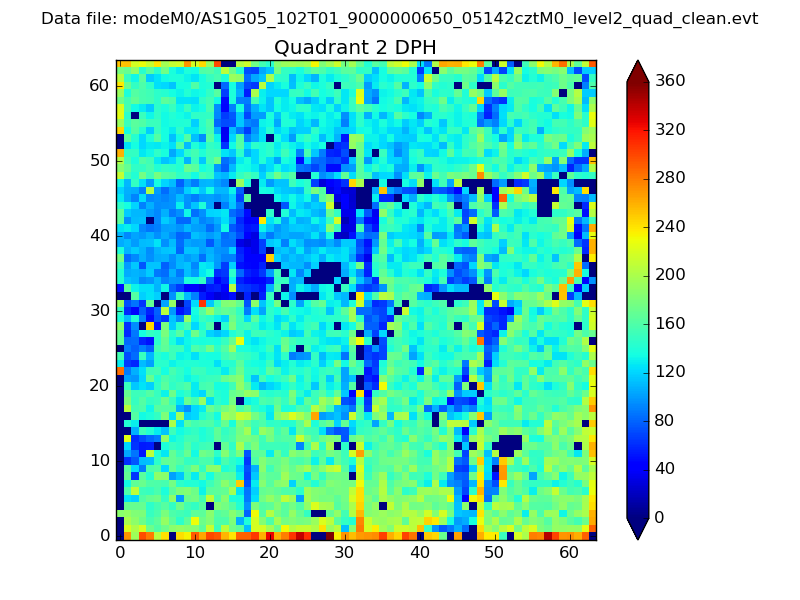
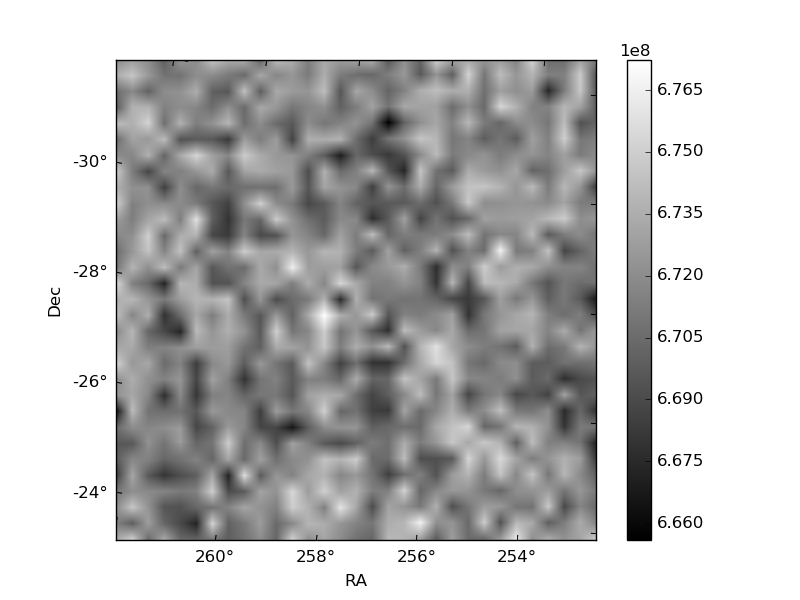
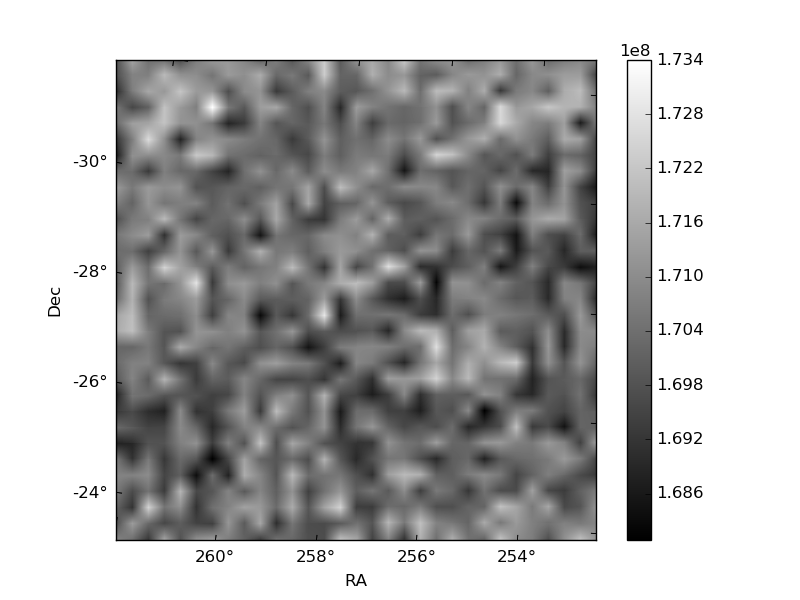
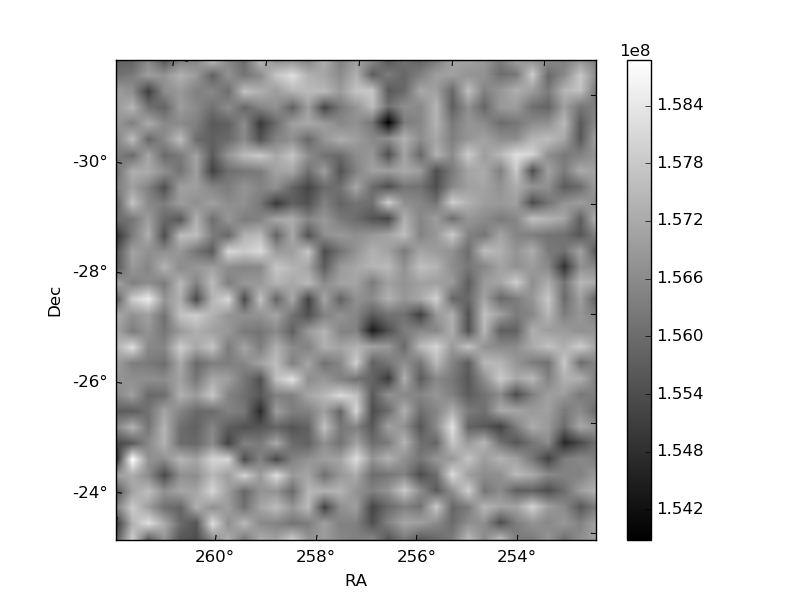
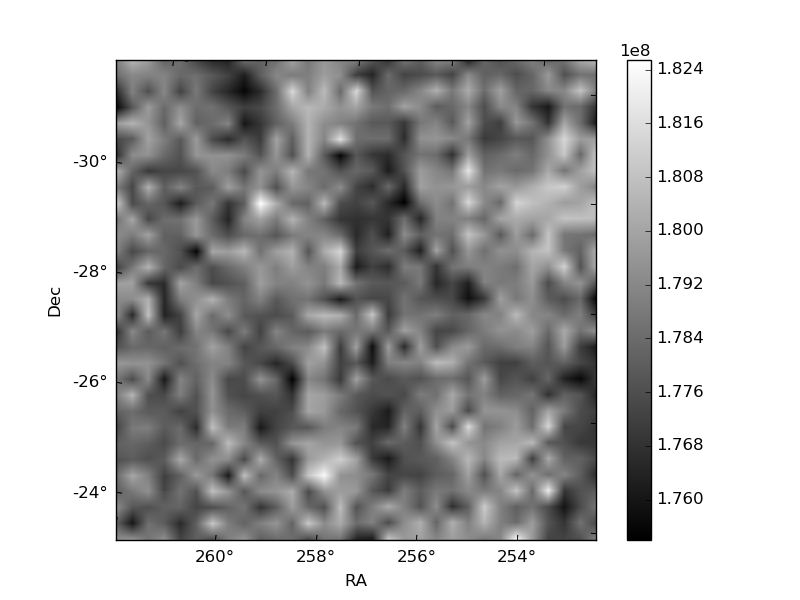
Histogram calculated using DETX and DETY for each event in the final _common_clean file
| Quadrant A | 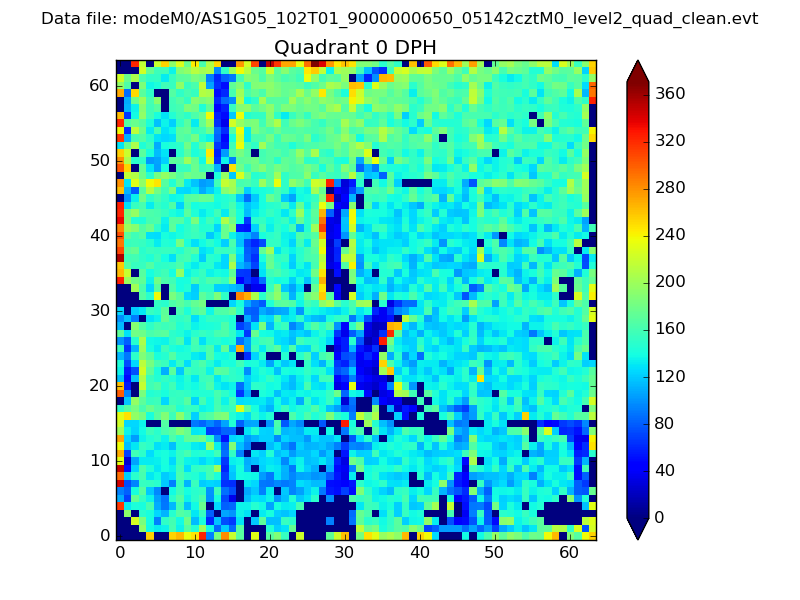 |
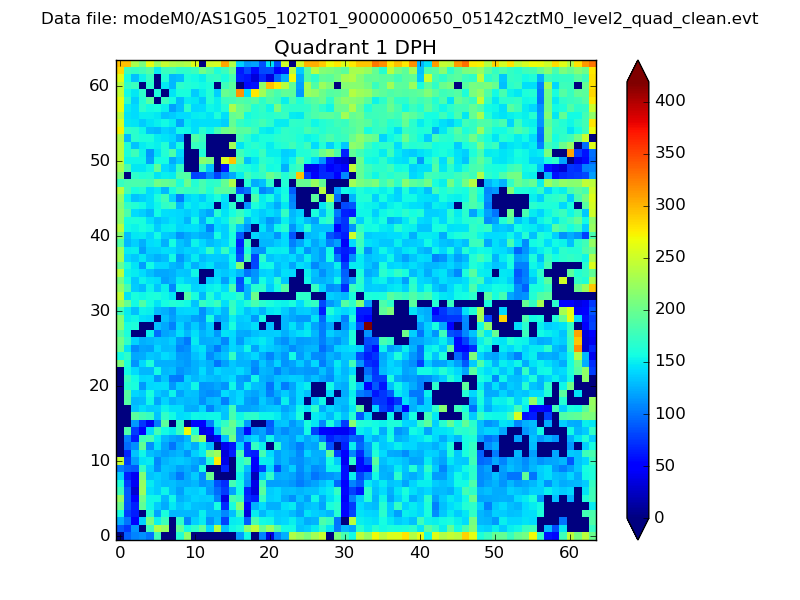 |
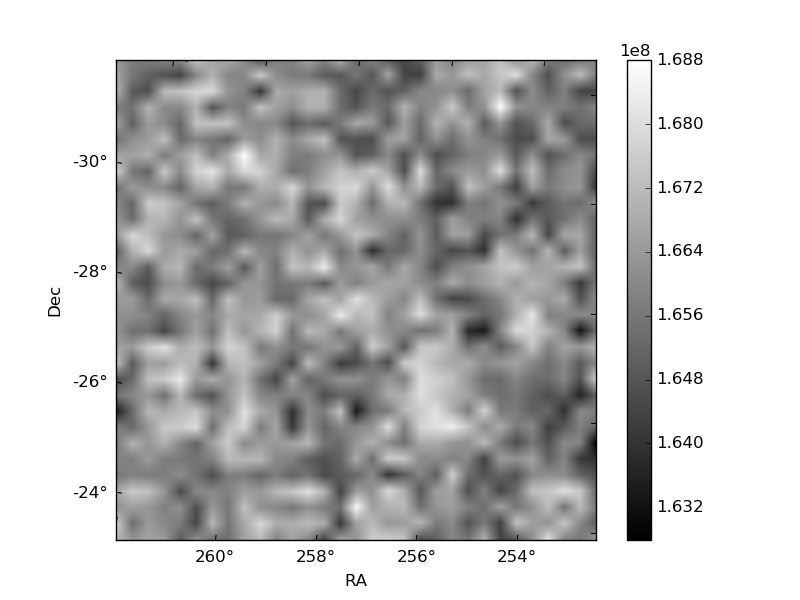
Quadrant B |
|---|---|---|---|
| Quadrant D | 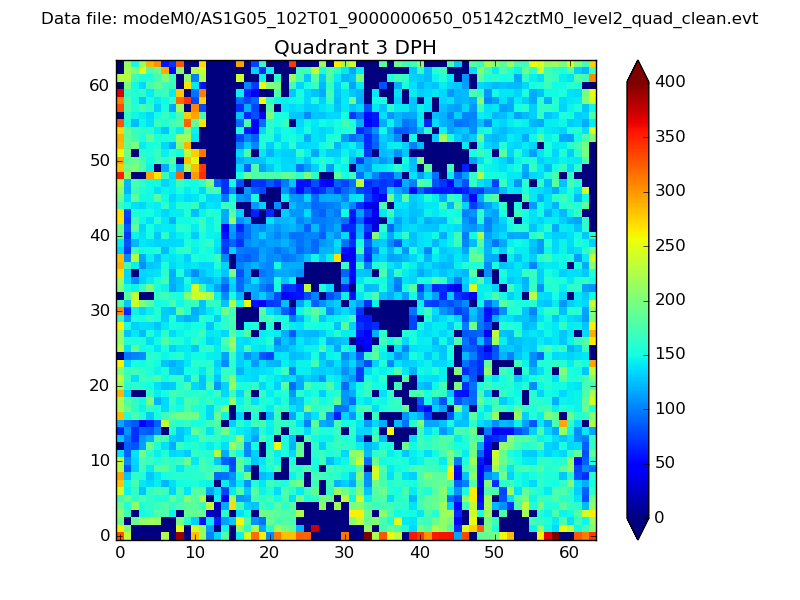 |
 |
Quadrant C |
| Plot type | Count rate plots | Images |
|---|---|---|
| Comparison with Poisson distribution Blue bars denote a histogram of data divided into 1 sec bins. Red curve is a Poisson curve with rate = median count rate of data. |
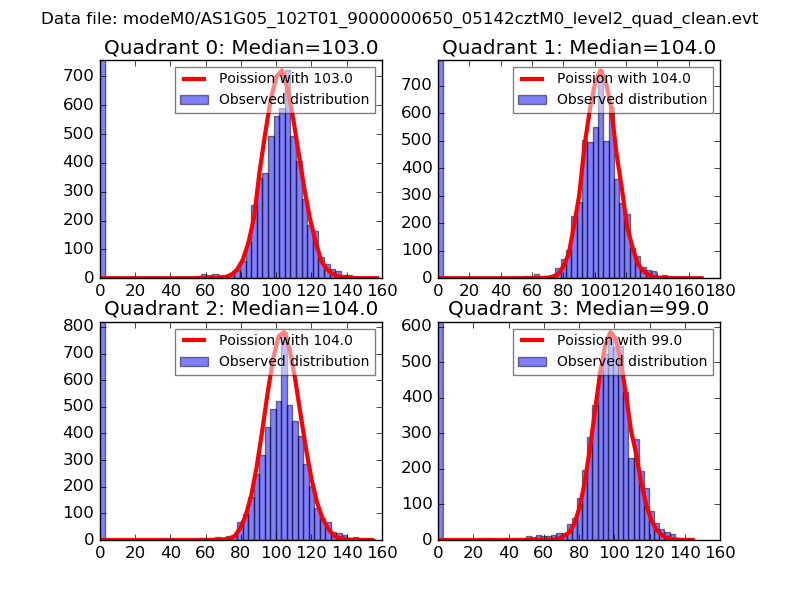 |
 |
| Quadrant-wise count rates Data is divided into 100 sec bins |
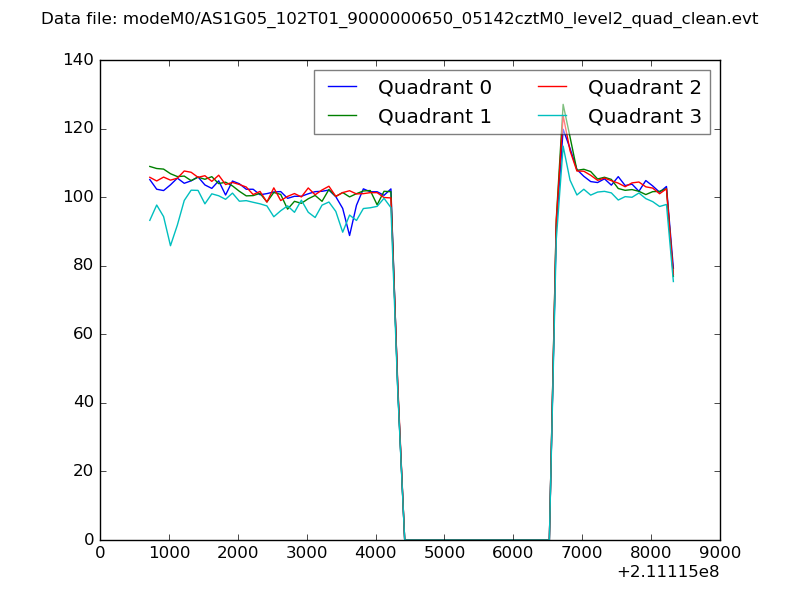 |
|
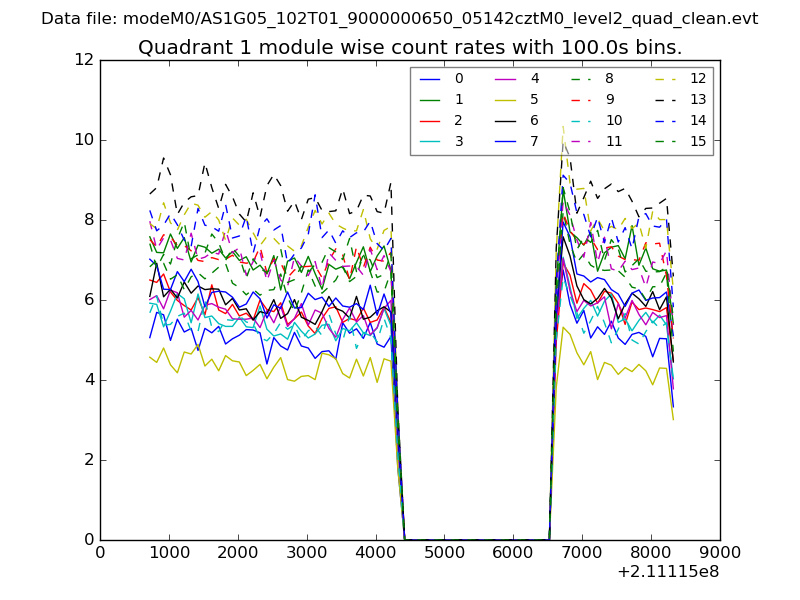
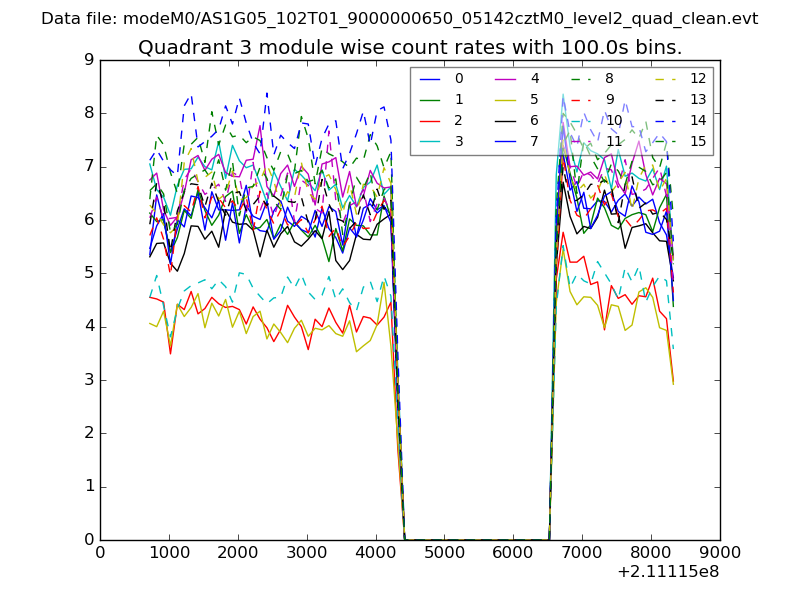
| Module-wise count rates for Quadrant A Data is divided into 100 sec bins |
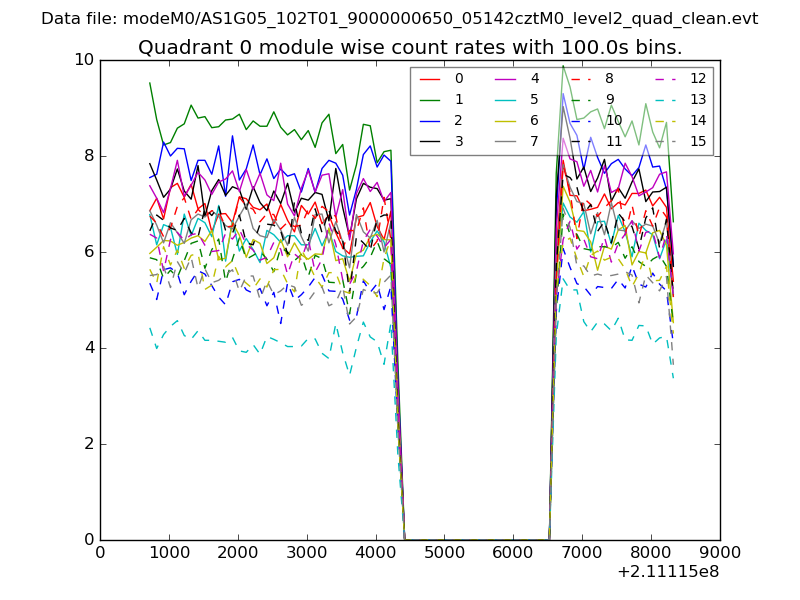 |
 |
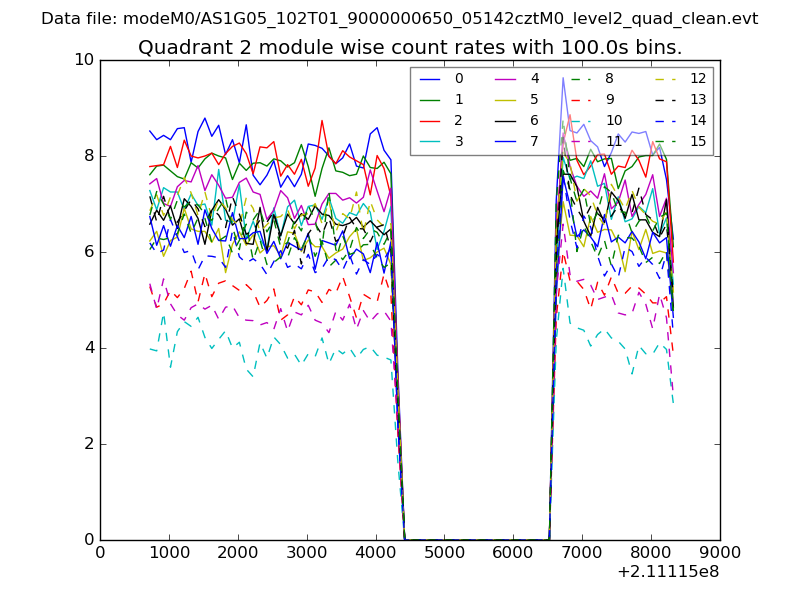
| Module-wise count rates for Quadrant B Data is divided into 100 sec bins |
 |
 |
| Module-wise count rates for Quadrant C Data is divided into 100 sec bins |
 |
 |
| Module-wise count rates for Quadrant D Data is divided into 100 sec bins |
 |
 |
| Parameter | Plot |
|---|---|
| CZT HV Monitor | 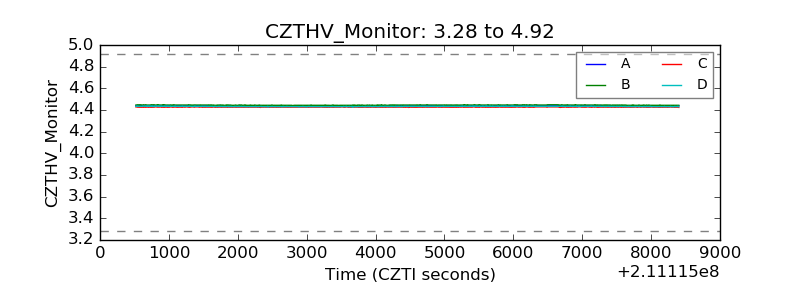 |
| D_VDD | 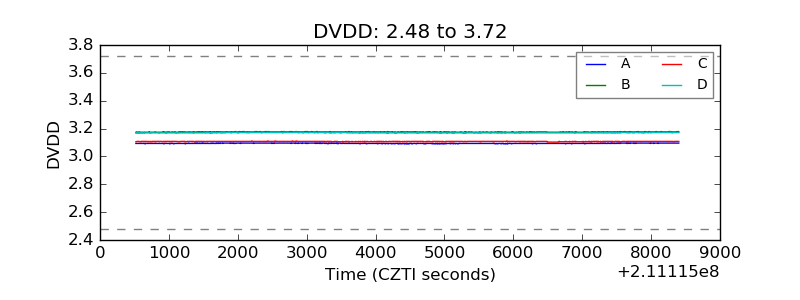 |
| Temperature 1 | 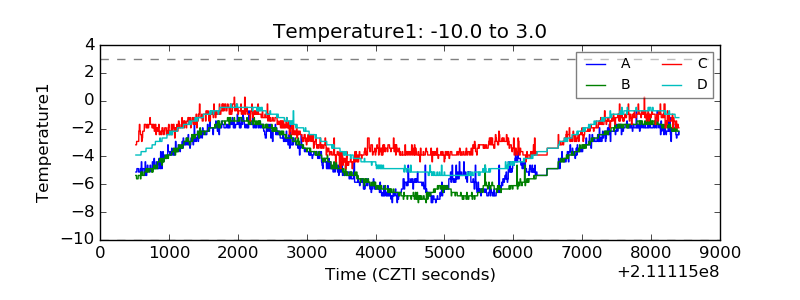 |
| Veto HV Monitor | 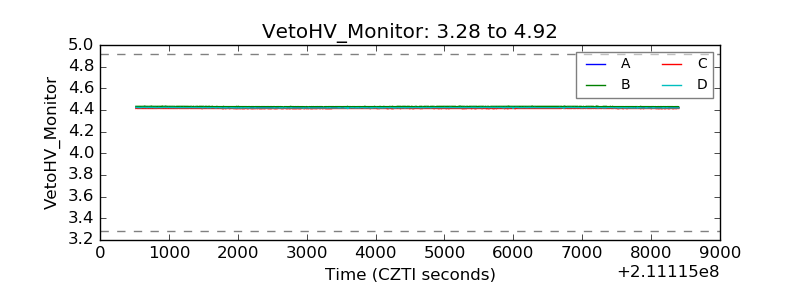 |
| Veto LLD | 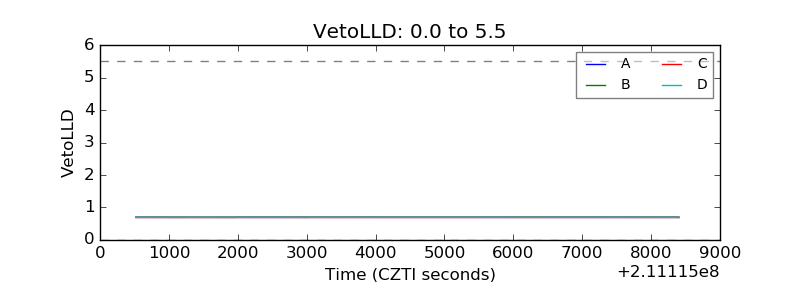 |
| Alpha Counter | 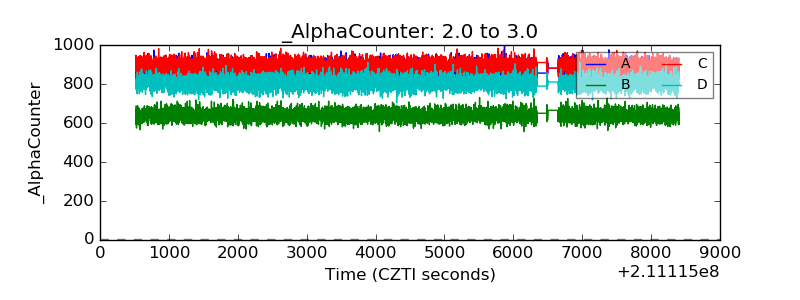 |
| _CPM_Rate | 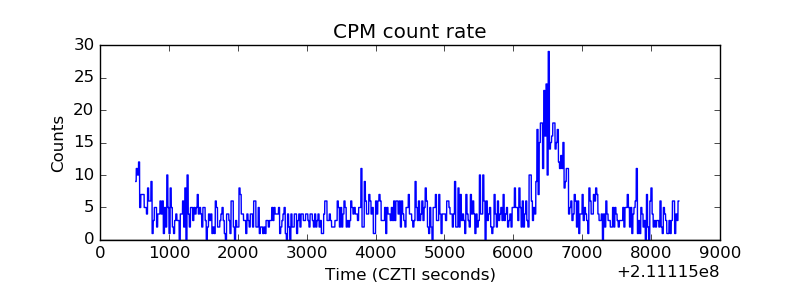 |
| CZT Counter | 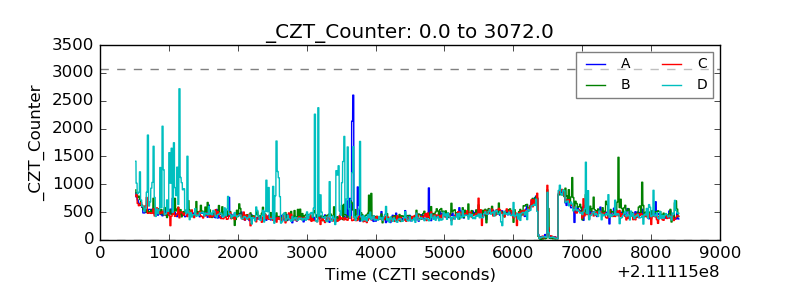 |
| +2.5 Volts monitor |  |
| +5 Volts monitor |  |
| _ROLL_ROT | 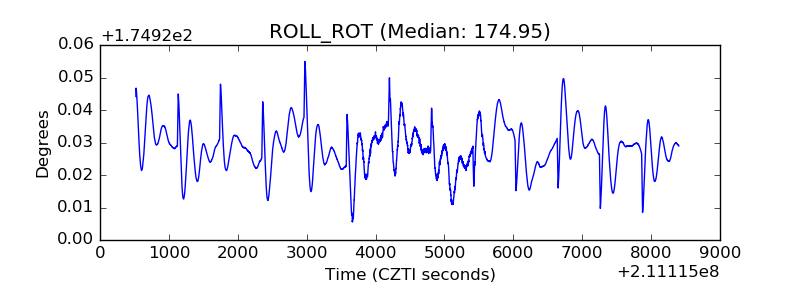 |
| _Roll_DEC | 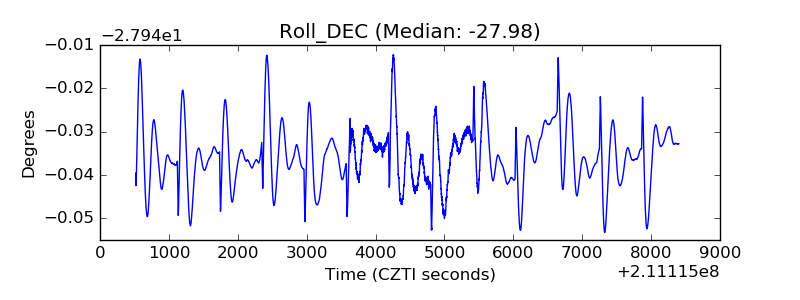 |
| _Roll_RA | 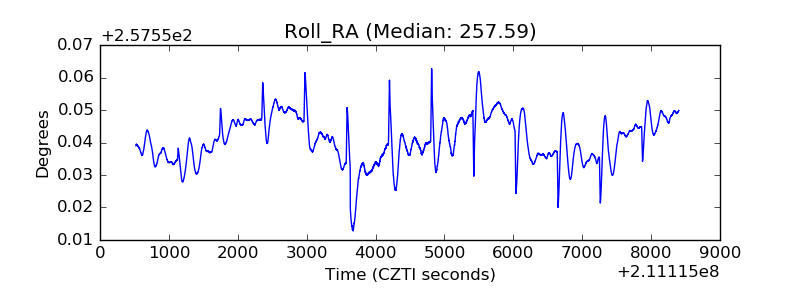 |
| Veto Counter | 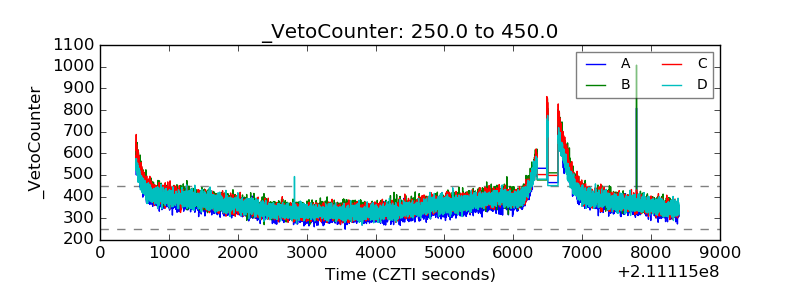 |