| Param | Original file | Final file |
|---|---|---|
| Filename | modeM0/AS1G05_102T01_9000000650_05143cztM0_level2.evt | modeM0/AS1G05_102T01_9000000650_05143cztM0_level2_quad_clean.evt |
| Size (bytes) | 527,993,280 | 85,930,560 |
| Size | 503.5 MB | 81.9 MB |
| Events in quadrant A | 3,584,591 | 527,534 |
| Events in quadrant B | 4,310,489 | 527,997 |
| Events in quadrant C | 3,288,252 | 531,022 |
| Events in quadrant D | 4,306,196 | 502,030 |
| Mode M0 | |||
|---|---|---|---|
| Quadrant | BADHDUFLAG | Total packets | Discarded packets |
| A | 0 | 15888 | 2 |
| B | 0 | 17682 | 1 |
| C | 0 | 15189 | 1 |
| D | 0 | 18016 | 1 |
| Mode M9 | |||
|---|---|---|---|
| Quadrant | BADHDUFLAG | Total packets | Discarded packets |
| A | 0 | 2 | 0 |
| B | 0 | 2 | 0 |
| C | 0 | 2 | 0 |
| D | 0 | 2 | 0 |
| Mode SS | |||
|---|---|---|---|
| Quadrant | BADHDUFLAG | Total packets | Discarded packets |
| A | 0 | 152 | 0 |
| B | 0 | 152 | 0 |
| C | 0 | 152 | 0 |
| D | 0 | 152 | 0 |
| Quadrant | Total seconds | Saturated seconds | Saturation percentage |
|---|---|---|---|
| A | 7373 | 181 | 2.454903% |
| B | 7373 | 182 | 2.468466% |
| C | 7373 | 43 | 0.583209% |
| D | 7373 | 235 | 3.187305% |
Noise dominated data is calculated using 1-second bins in cleaned event files. If a bin has >2000 counts, and if more than 50% of those come from <1% of pixels, then it is considered to be noise-dominated and hence unusable.
| Quadrant | # 1 sec bins | Bins with >0 counts | Bins with >2000 counts | High rate bins dominated by noise | Noise dominated (total time) | Noise dominated (detector-on time) | Marked lightcurve |
|---|---|---|---|---|---|---|---|
| A | 7538 | 7375 | 27 | 27 | 0.36% | 0.37% | 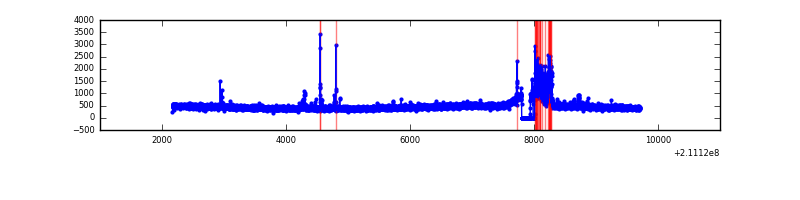 |
| B | 7538 | 7375 | 52 | 52 | 0.69% | 0.71% | 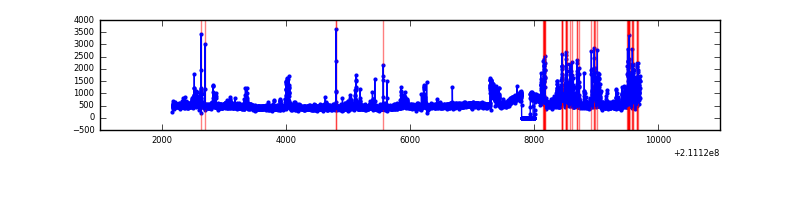 |
| C | 7538 | 7375 | 0 | 0 | 0.00% | 0.00% | 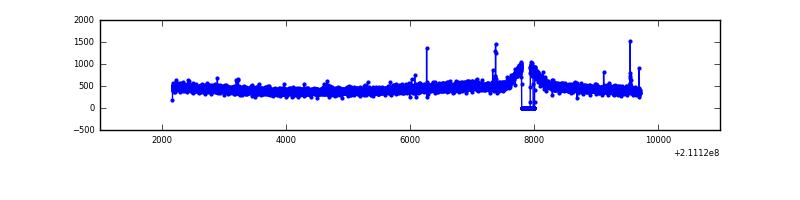 |
| D | 7538 | 7375 | 187 | 187 | 2.48% | 2.54% | 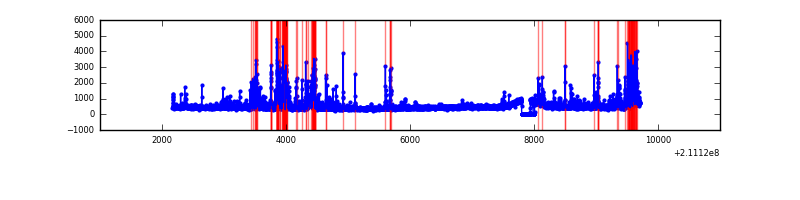 |
Top three noisy pixels from each quadrant. If the there are fewer than three noisy pixels in the level2.evt file, extra rows are filled as -1
| Pixel properties | Quadrant properties | ||||||
|---|---|---|---|---|---|---|---|
| Quadrant | DetID | PixID | Counts | Sigma | Mean | Median | Sigma |
| A | 0 | 247 | 197315 | 1090.51 | 862 | 843 | 180.2 |
| A | 0 | 50 | 46287 | 252.24 | 862 | 843 | 180.2 |
| A | 0 | 226 | 26025 | 139.77 | 862 | 843 | 180.2 |
| B | 8 | 3 | 598150 | 3551.23 | 868 | 848 | 168.2 |
| B | 15 | 204 | 116053 | 684.95 | 868 | 848 | 168.2 |
| B | 5 | 200 | 97820 | 576.54 | 868 | 848 | 168.2 |
| C | 12 | 4 | 13695 | 65.72 | 835 | 840 | 195.6 |
| C | 13 | 61 | 6858 | 30.77 | 835 | 840 | 195.6 |
| C | 1 | 16 | 6505 | 28.96 | 835 | 840 | 195.6 |
| D | 2 | 33 | 690182 | 3377.12 | 832 | 808 | 204.1 |
| D | 2 | 221 | 133372 | 649.41 | 832 | 808 | 204.1 |
| D | 12 | 233 | 108028 | 525.25 | 832 | 808 | 204.1 |
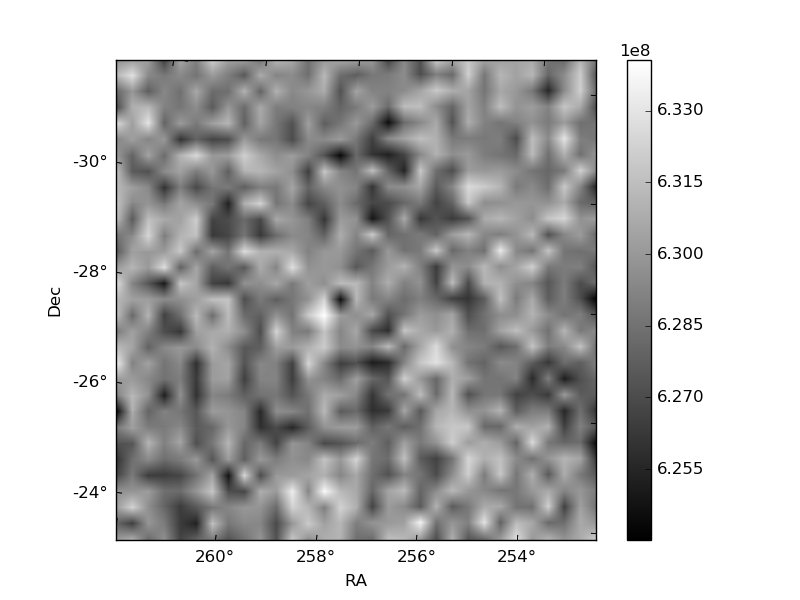
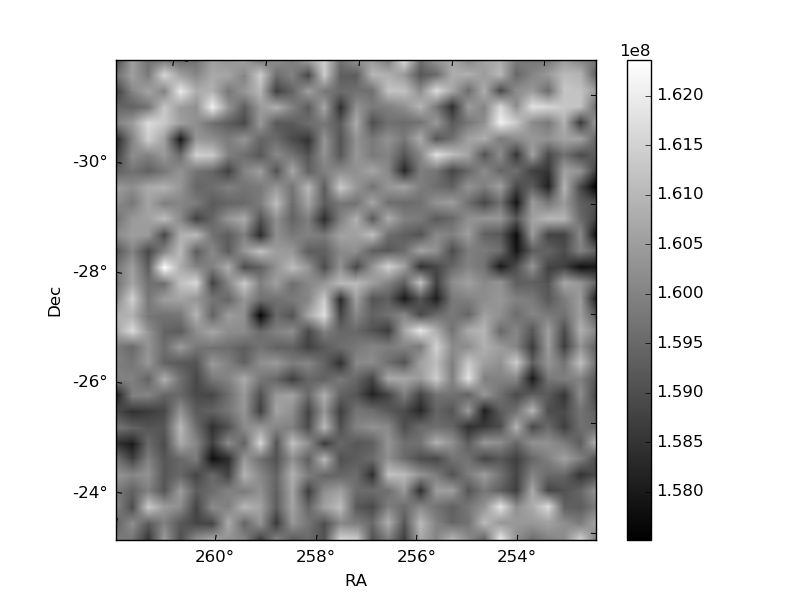
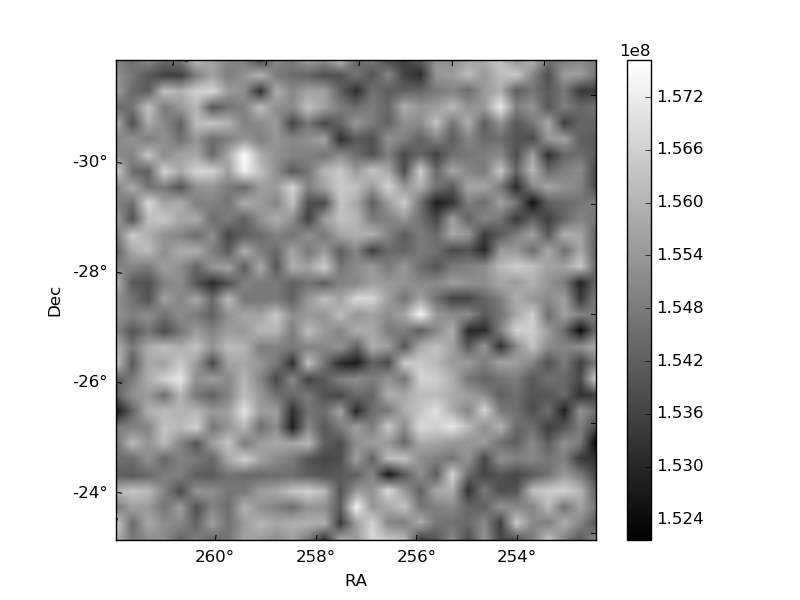
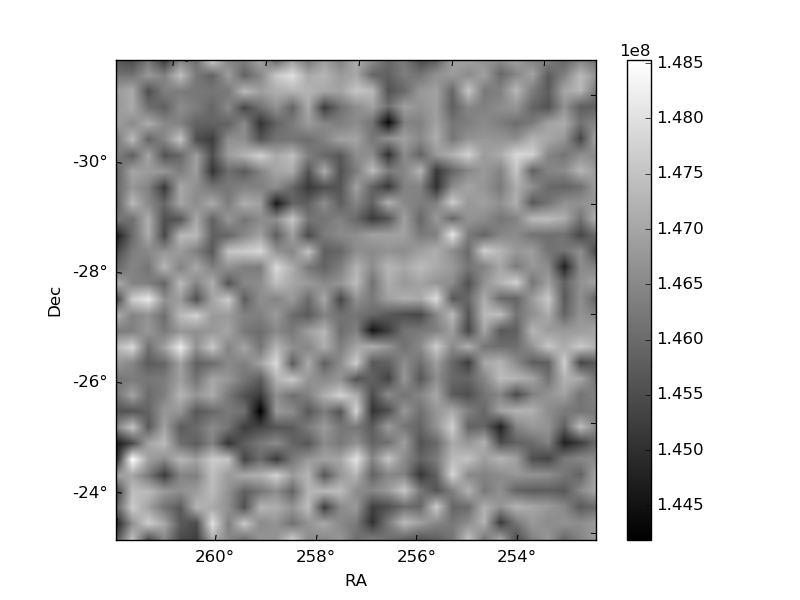
Histogram calculated using DETX and DETY for each event in the final _common_clean file
| Quadrant A | 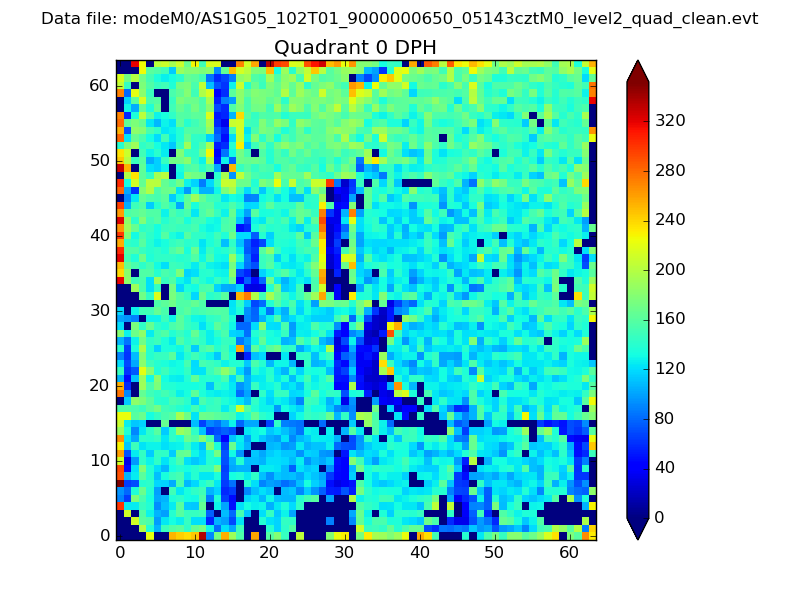 |
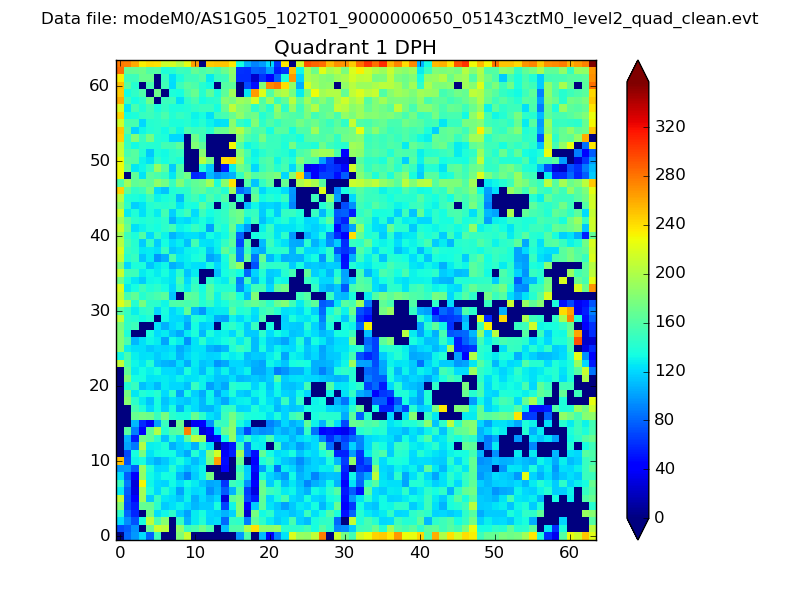 |
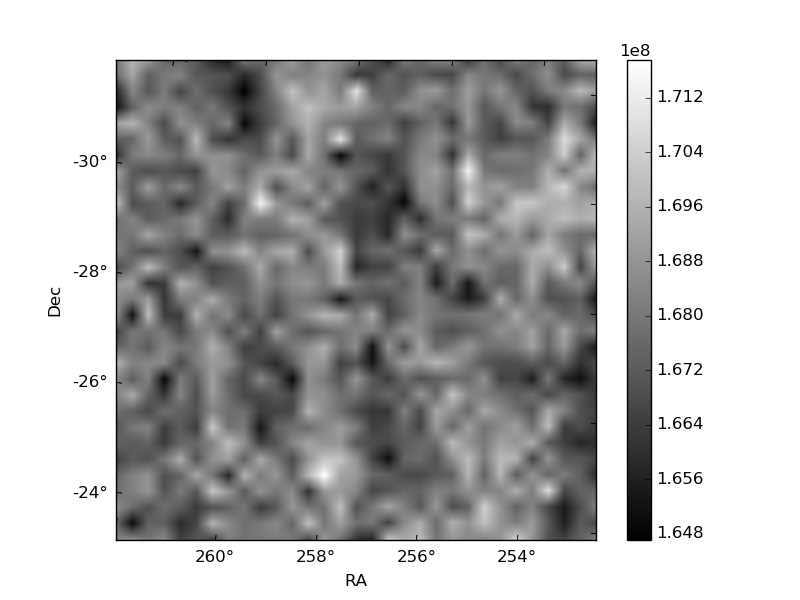
Quadrant B |
|---|---|---|---|
| Quadrant D | 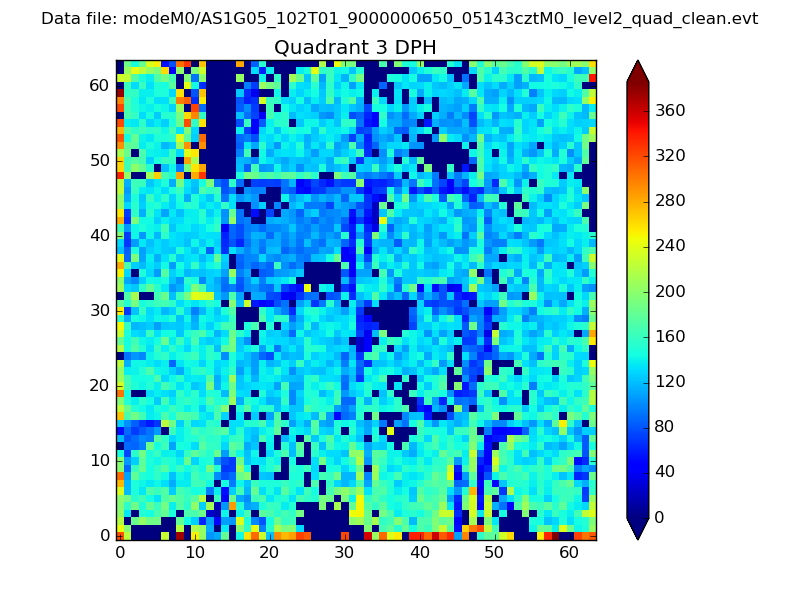 |
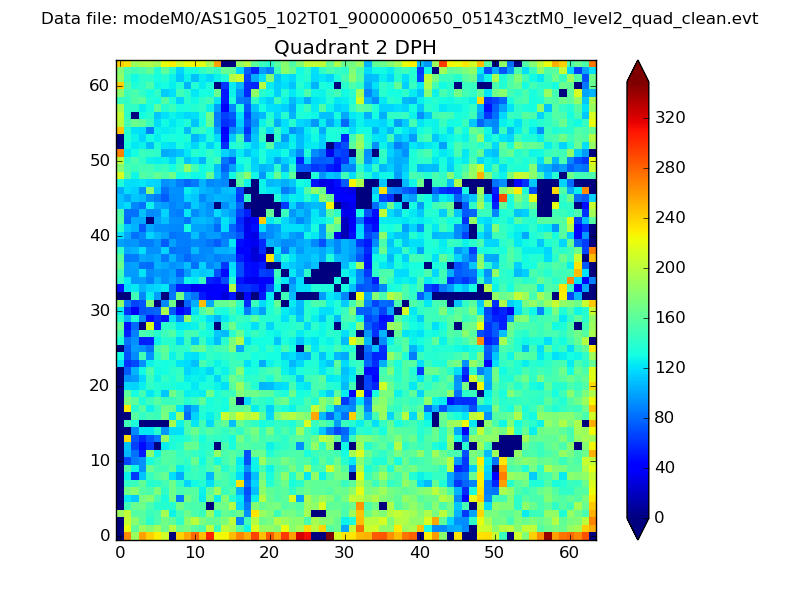 |
Quadrant C |
| Plot type | Count rate plots | Images |
|---|---|---|
| Comparison with Poisson distribution Blue bars denote a histogram of data divided into 1 sec bins. Red curve is a Poisson curve with rate = median count rate of data. |
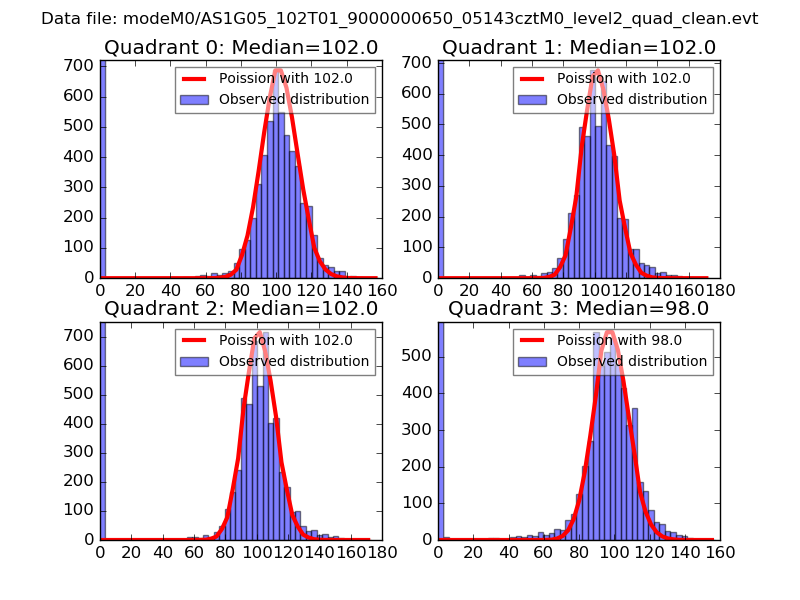 |
 |
| Quadrant-wise count rates Data is divided into 100 sec bins |
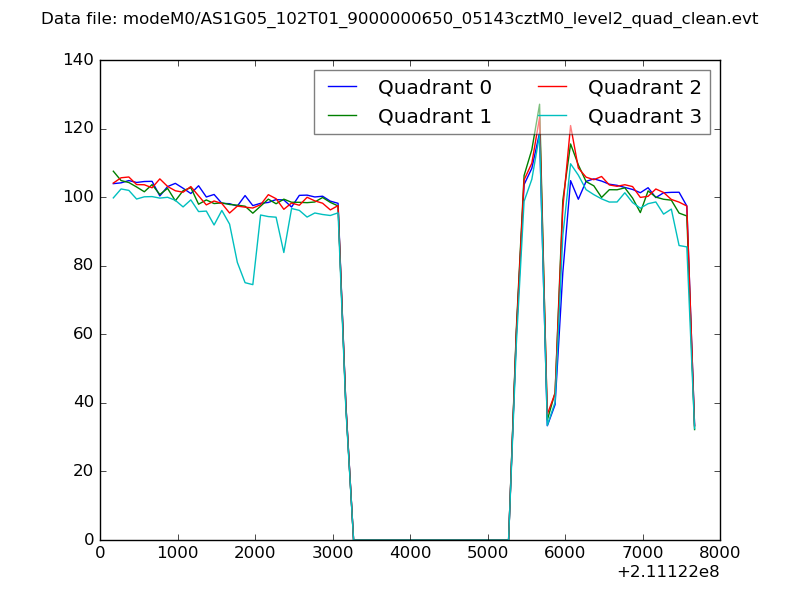 |
|
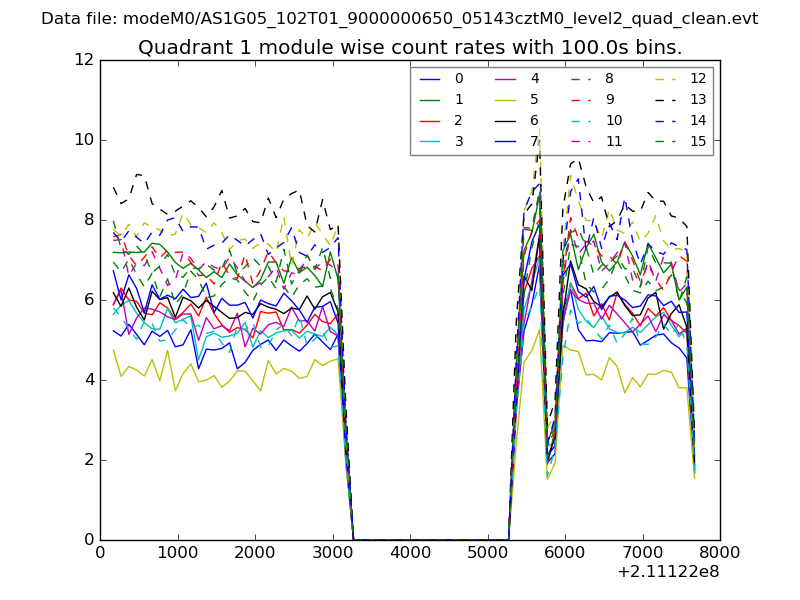
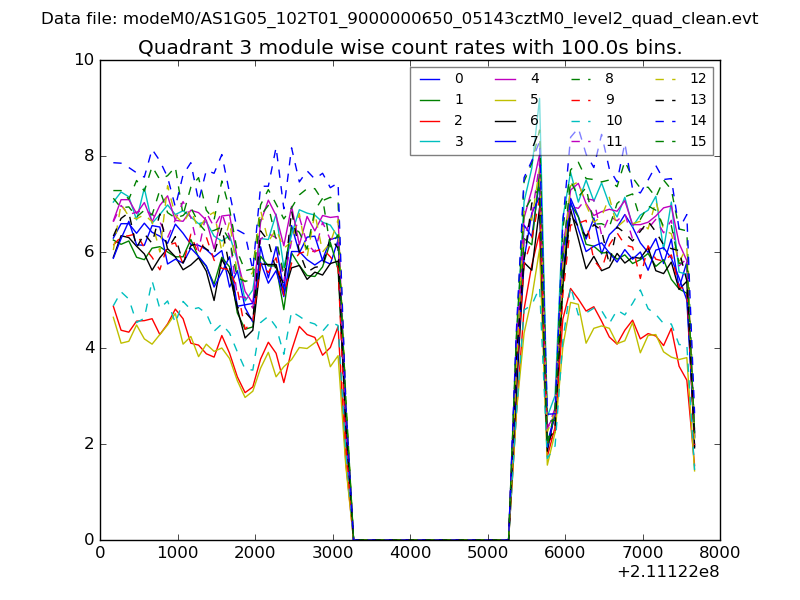
| Module-wise count rates for Quadrant A Data is divided into 100 sec bins |
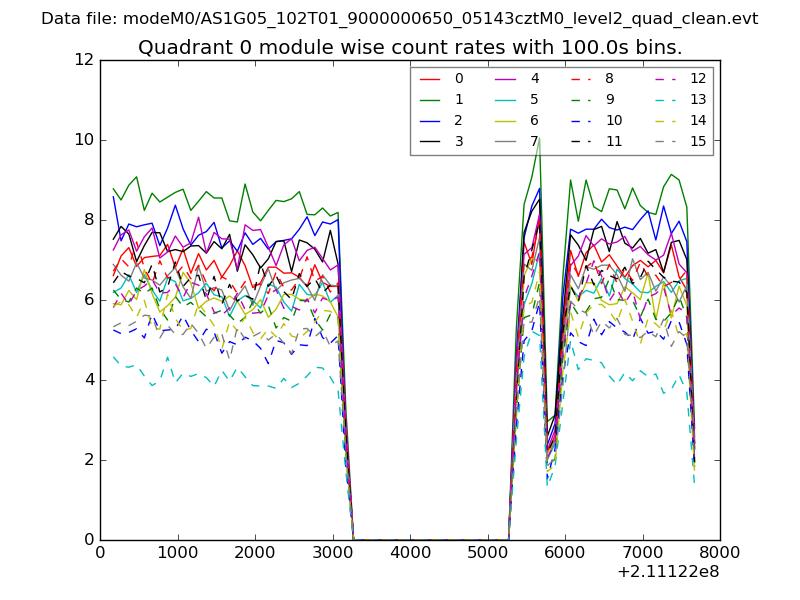 |
 |
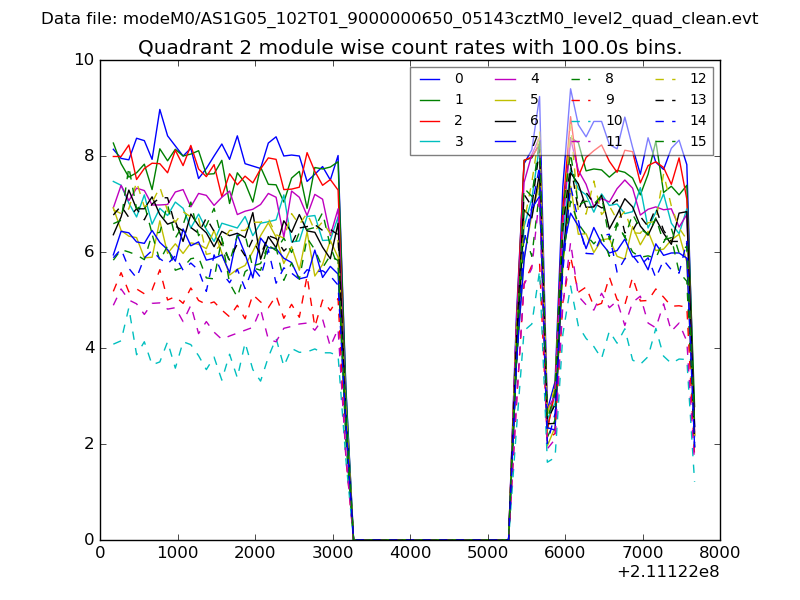
| Module-wise count rates for Quadrant B Data is divided into 100 sec bins |
 |
 |
| Module-wise count rates for Quadrant C Data is divided into 100 sec bins |
 |
 |
| Module-wise count rates for Quadrant D Data is divided into 100 sec bins |
 |
 |
| Parameter | Plot |
|---|---|
| CZT HV Monitor | 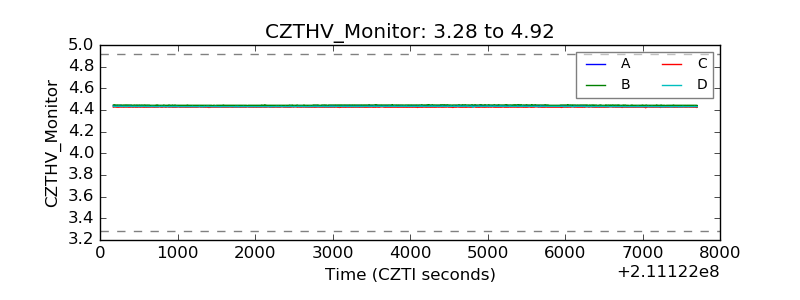 |
| D_VDD | 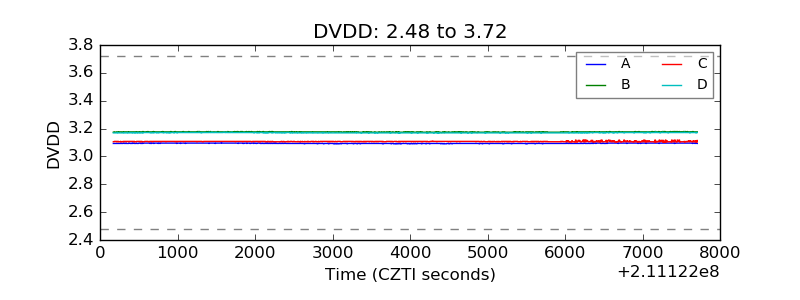 |
| Temperature 1 | 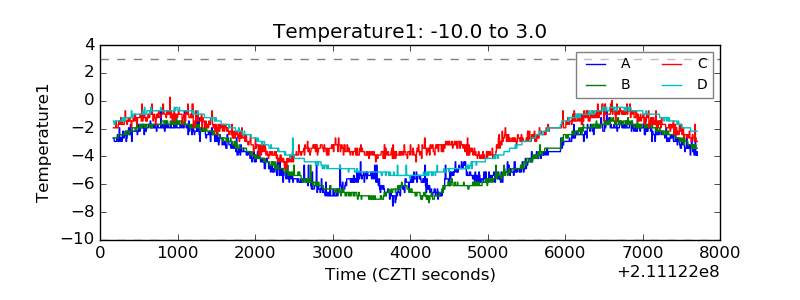 |
| Veto HV Monitor | 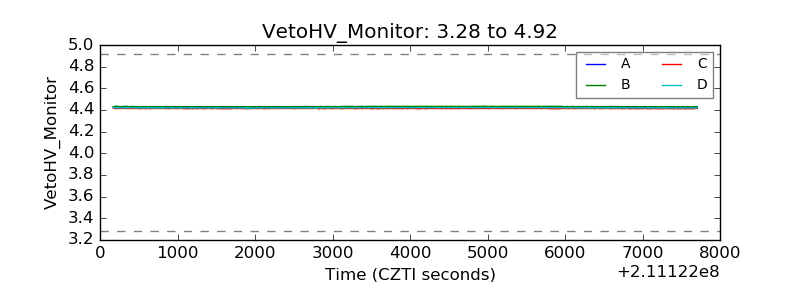 |
| Veto LLD | 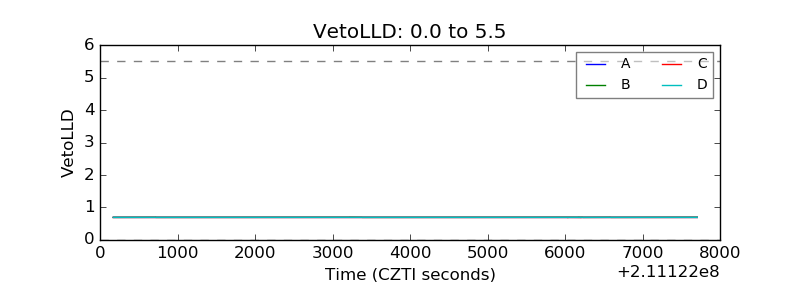 |
| Alpha Counter | 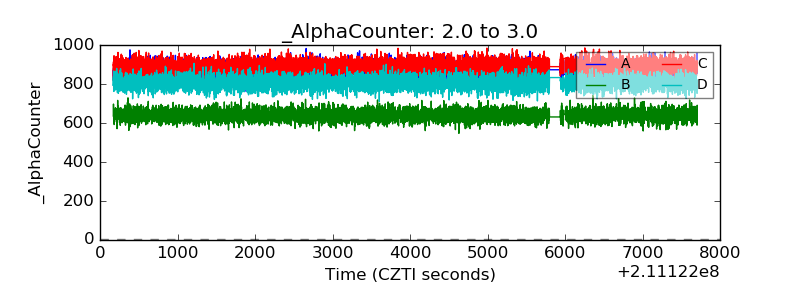 |
| _CPM_Rate | 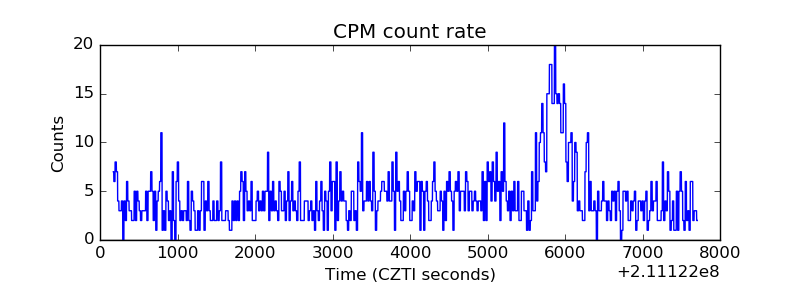 |
| CZT Counter | 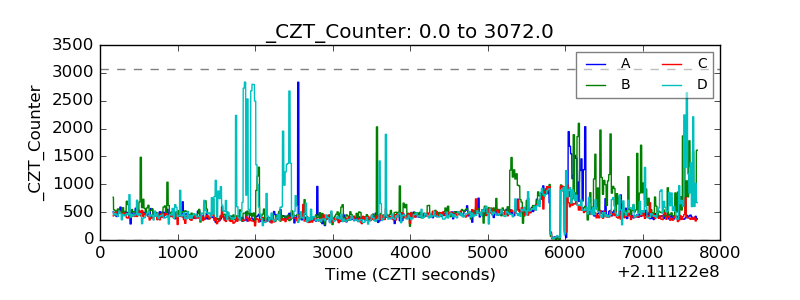 |
| +2.5 Volts monitor | 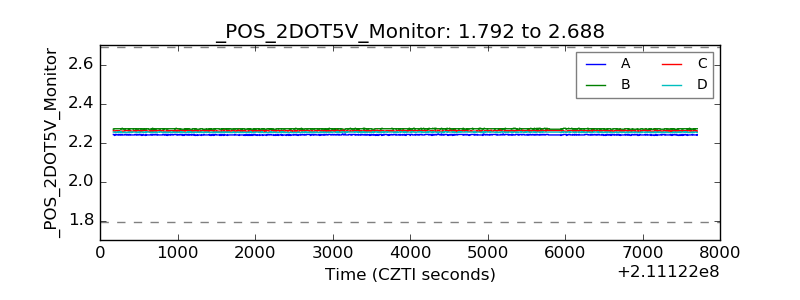 |
| +5 Volts monitor | 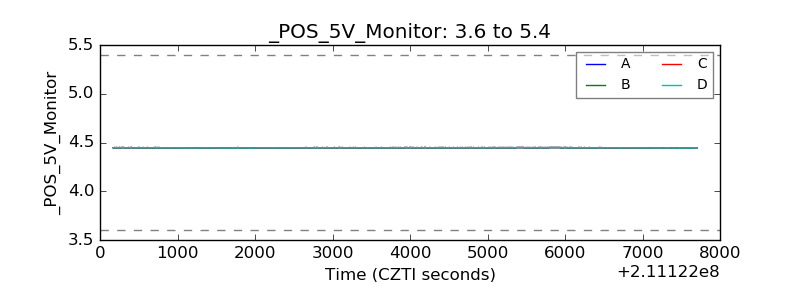 |
| _ROLL_ROT | 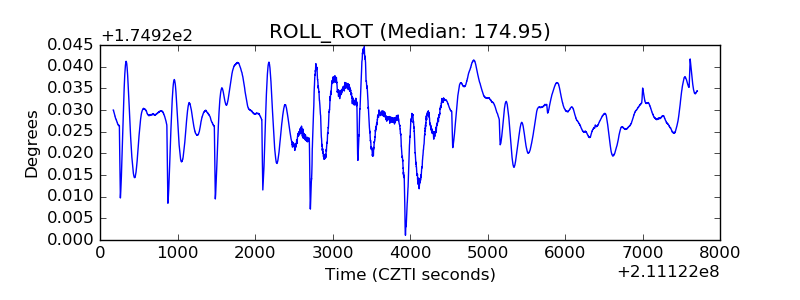 |
| _Roll_DEC | 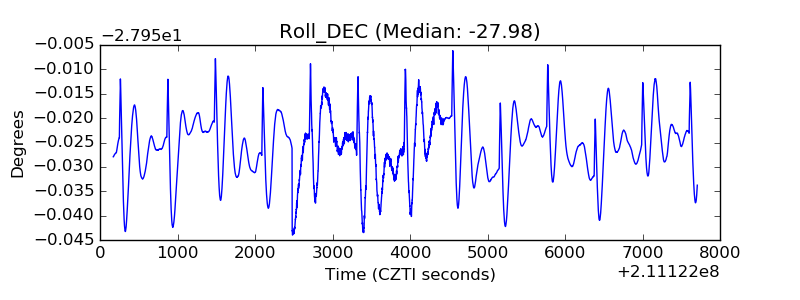 |
| _Roll_RA | 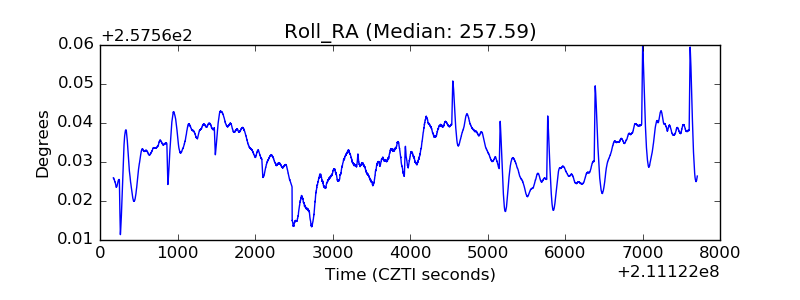 |
| Veto Counter | 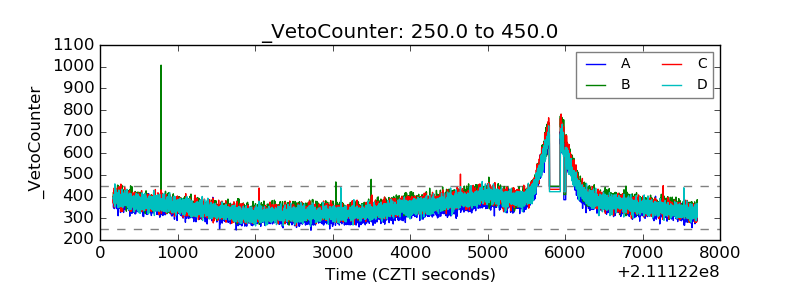 |