| Param | Original file | Final file |
|---|---|---|
| Filename | modeM0/AS1G05_102T01_9000000650_05144cztM0_level2.evt | modeM0/AS1G05_102T01_9000000650_05144cztM0_level2_quad_clean.evt |
| Size (bytes) | 394,643,520 | 57,343,680 |
| Size | 376.4 MB | 54.7 MB |
| Events in quadrant A | 2,506,973 | 343,221 |
| Events in quadrant B | 3,238,019 | 339,934 |
| Events in quadrant C | 2,449,765 | 341,523 |
| Events in quadrant D | 3,379,008 | 322,541 |
| Mode M0 | |||
|---|---|---|---|
| Quadrant | BADHDUFLAG | Total packets | Discarded packets |
| A | 0 | 11453 | 2 |
| B | 0 | 13142 | 1 |
| C | 0 | 11361 | 1 |
| D | 0 | 13983 | 7 |
| Mode M9 | |||
|---|---|---|---|
| Quadrant | BADHDUFLAG | Total packets | Discarded packets |
| A | 0 | 4 | 0 |
| B | 0 | 4 | 0 |
| C | 0 | 4 | 0 |
| D | 0 | 4 | 0 |
| Mode SS | |||
|---|---|---|---|
| Quadrant | BADHDUFLAG | Total packets | Discarded packets |
| A | 0 | 112 | 0 |
| B | 0 | 112 | 0 |
| C | 0 | 112 | 0 |
| D | 0 | 112 | 0 |
| Quadrant | Total seconds | Saturated seconds | Saturation percentage |
|---|---|---|---|
| A | 5560 | 23 | 0.413669% |
| B | 5560 | 63 | 1.133094% |
| C | 5560 | 20 | 0.359712% |
| D | 5559 | 159 | 2.860227% |
Noise dominated data is calculated using 1-second bins in cleaned event files. If a bin has >2000 counts, and if more than 50% of those come from <1% of pixels, then it is considered to be noise-dominated and hence unusable.
| Quadrant | # 1 sec bins | Bins with >0 counts | Bins with >2000 counts | High rate bins dominated by noise | Noise dominated (total time) | Noise dominated (detector-on time) | Marked lightcurve |
|---|---|---|---|---|---|---|---|
| A | 5950 | 5561 | 0 | 0 | 0.00% | 0.00% | 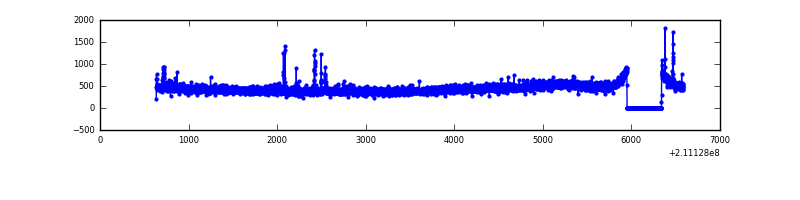 |
| B | 5950 | 5561 | 40 | 40 | 0.67% | 0.72% | 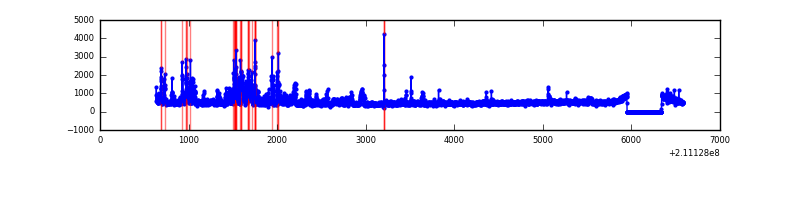 |
| C | 5950 | 5561 | 0 | 0 | 0.00% | 0.00% | 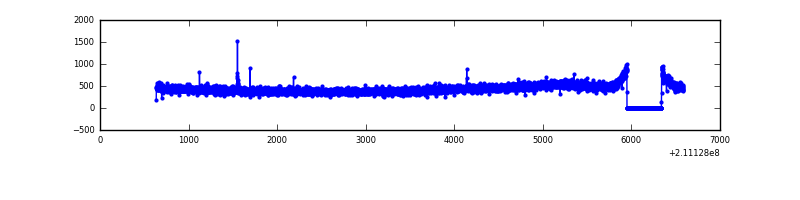 |
| D | 5950 | 5561 | 154 | 154 | 2.59% | 2.77% | 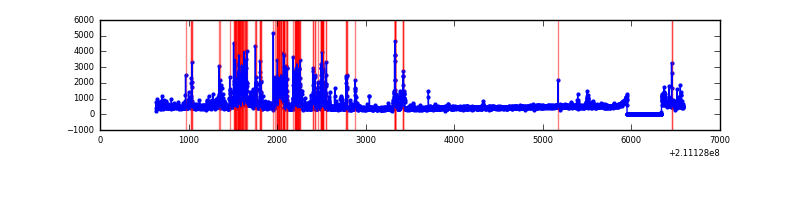 |
Top three noisy pixels from each quadrant. If the there are fewer than three noisy pixels in the level2.evt file, extra rows are filled as -1
| Pixel properties | Quadrant properties | ||||||
|---|---|---|---|---|---|---|---|
| Quadrant | DetID | PixID | Counts | Sigma | Mean | Median | Sigma |
| A | 0 | 50 | 39949 | 295.69 | 640 | 625 | 133.0 |
| A | 0 | 226 | 6362 | 43.14 | 640 | 625 | 133.0 |
| A | 12 | 194 | 6333 | 42.92 | 640 | 625 | 133.0 |
| B | 8 | 3 | 536529 | 4321.04 | 643 | 627 | 124.0 |
| B | 15 | 204 | 134747 | 1081.43 | 643 | 627 | 124.0 |
| B | 0 | 219 | 25105 | 197.37 | 643 | 627 | 124.0 |
| C | 8 | 128 | 14147 | 93.08 | 618 | 620 | 145.3 |
| C | 8 | 112 | 6846 | 42.84 | 618 | 620 | 145.3 |
| C | 8 | 144 | 5372 | 32.7 | 618 | 620 | 145.3 |
| D | 2 | 33 | 651572 | 4315.22 | 612 | 594 | 150.9 |
| D | 2 | 136 | 187287 | 1237.56 | 612 | 594 | 150.9 |
| D | 2 | 221 | 63676 | 418.16 | 612 | 594 | 150.9 |
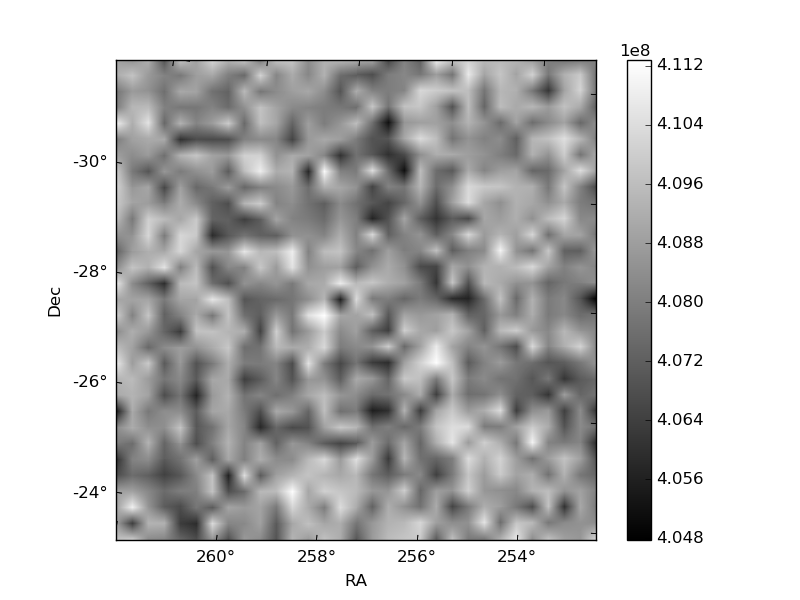
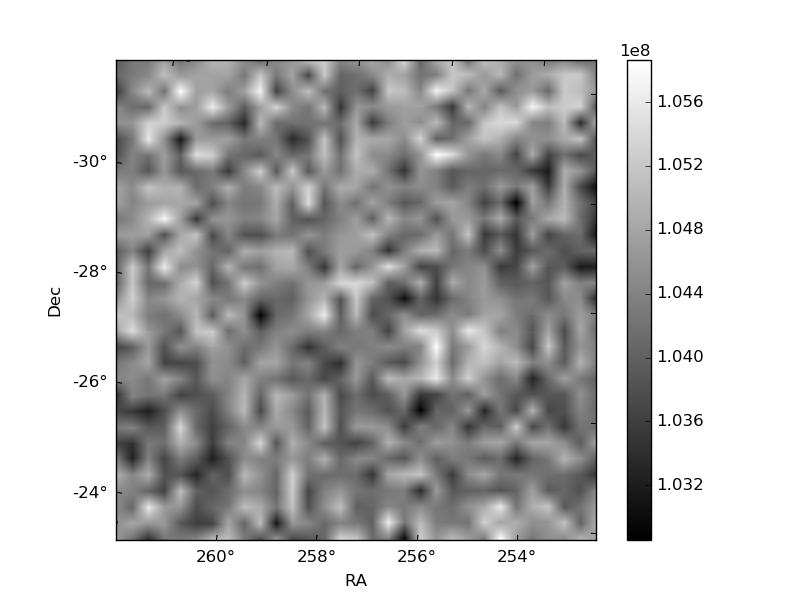
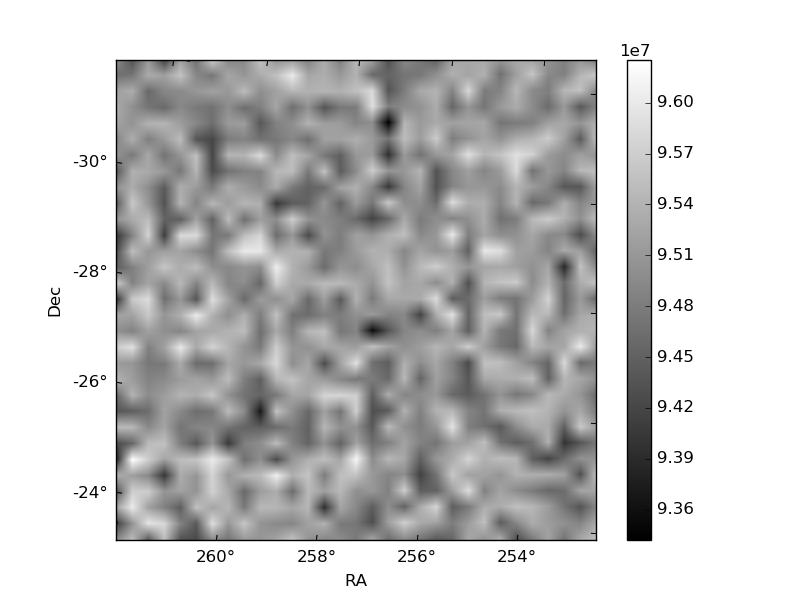
Histogram calculated using DETX and DETY for each event in the final _common_clean file
| Quadrant A | 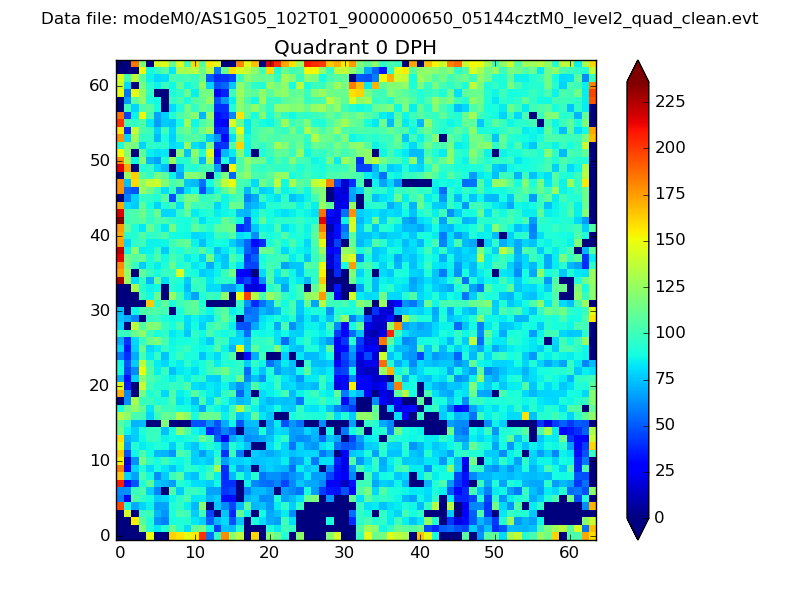 |
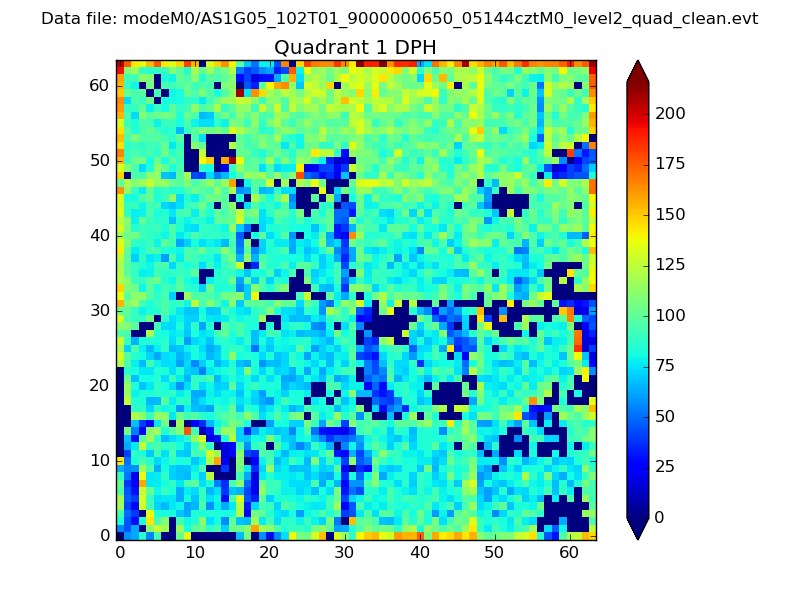 |
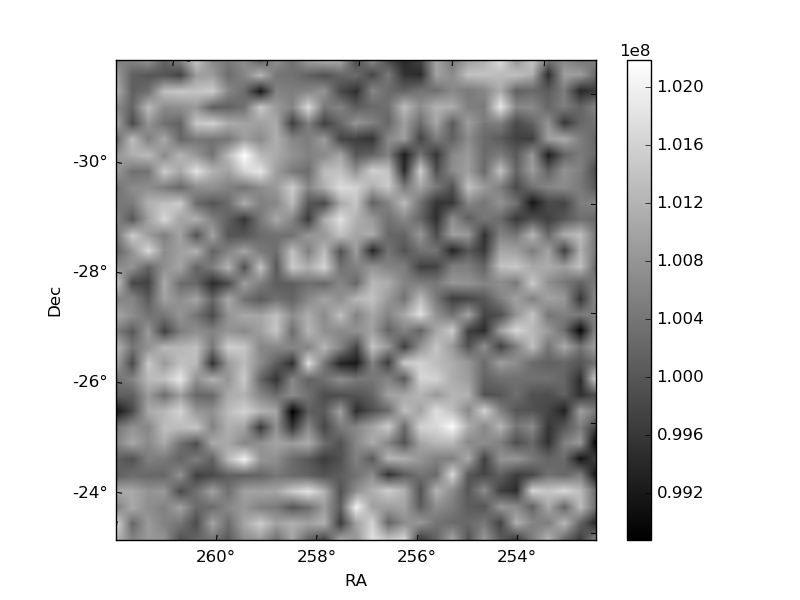
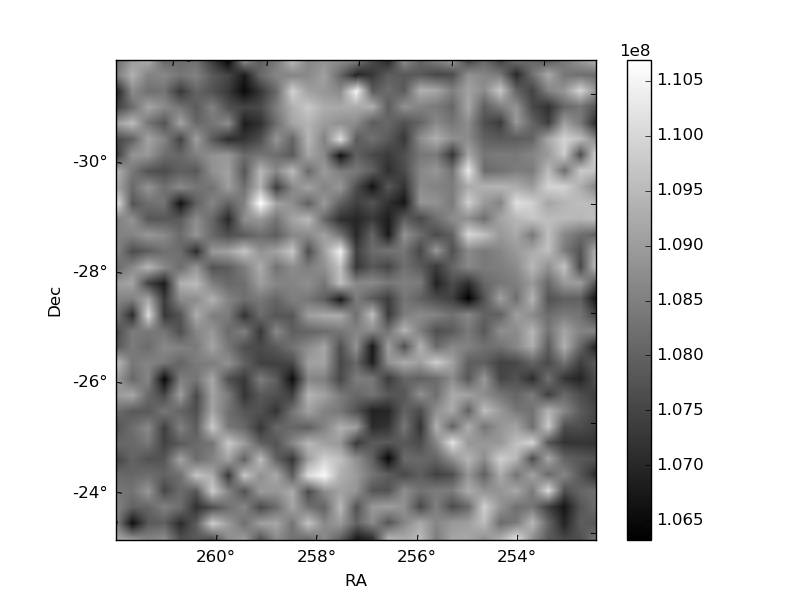
Quadrant B |
|---|---|---|---|
| Quadrant D | 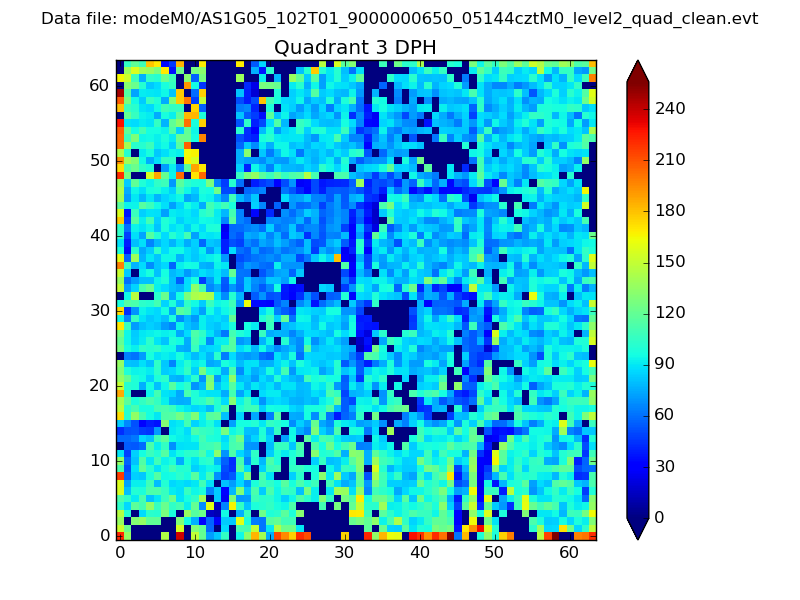 |
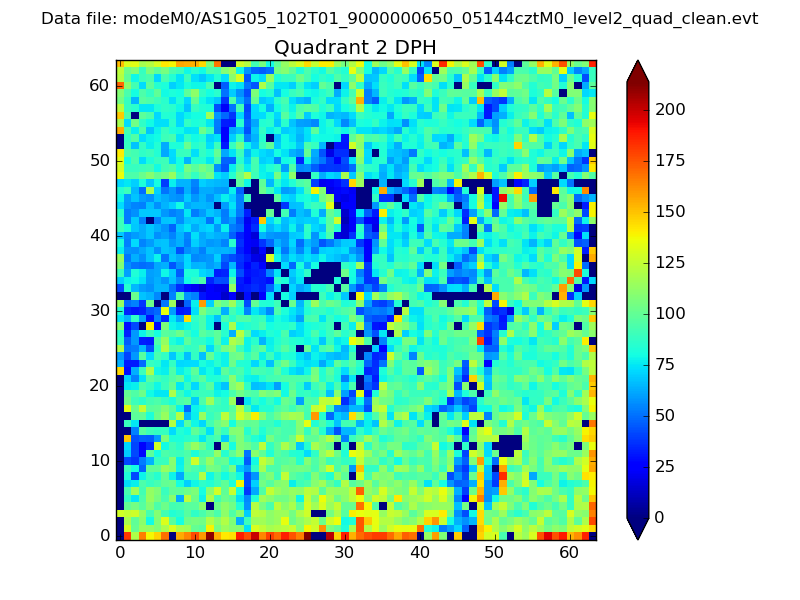 |
Quadrant C |
| Plot type | Count rate plots | Images |
|---|---|---|
| Comparison with Poisson distribution Blue bars denote a histogram of data divided into 1 sec bins. Red curve is a Poisson curve with rate = median count rate of data. |
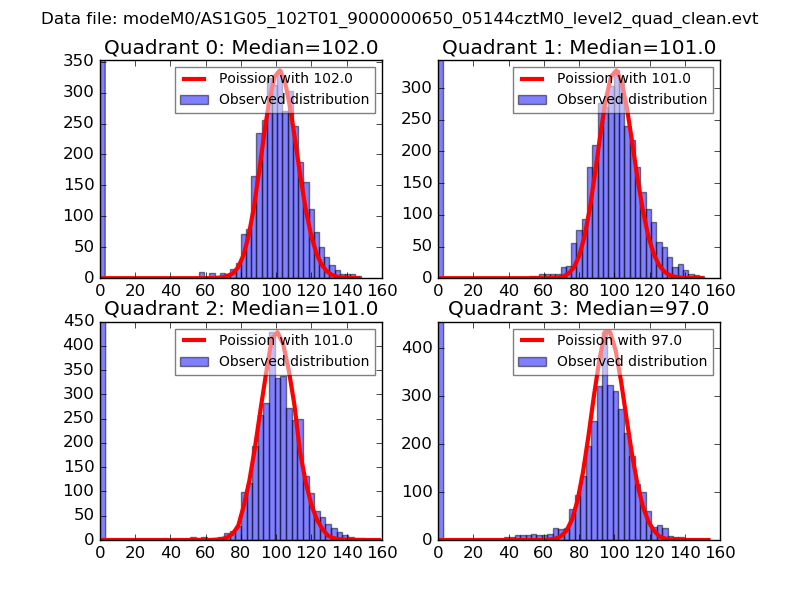 |
 |
| Quadrant-wise count rates Data is divided into 100 sec bins |
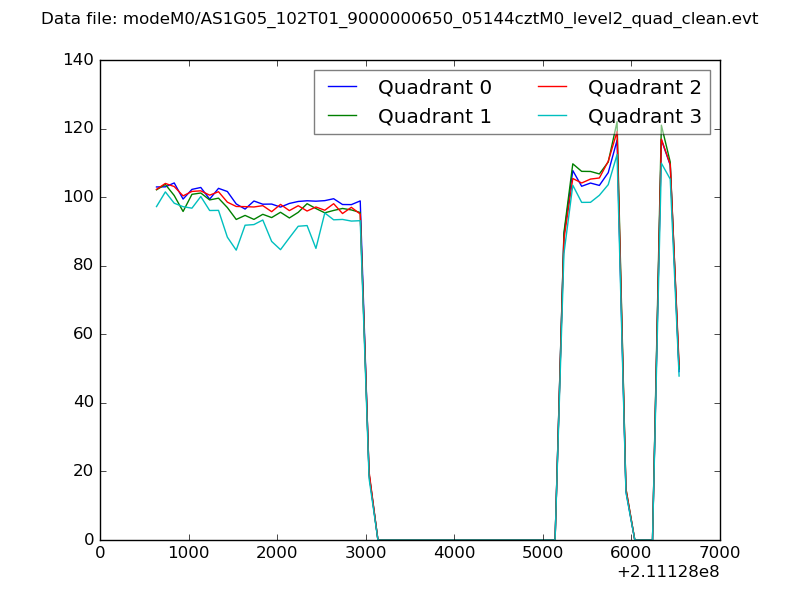 |
|
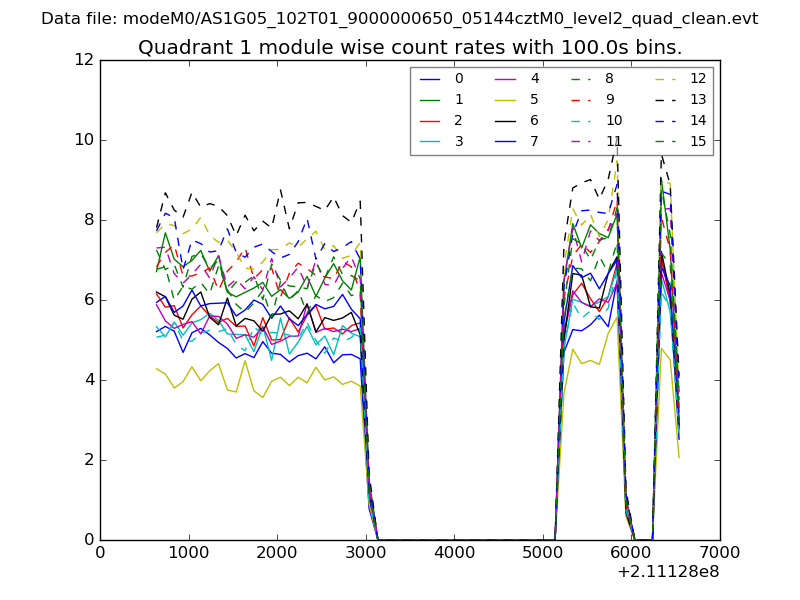
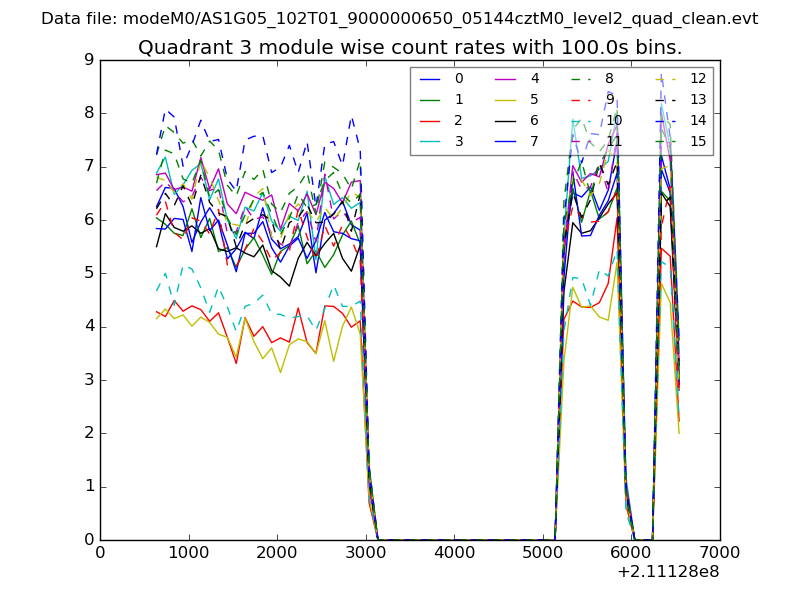
| Module-wise count rates for Quadrant A Data is divided into 100 sec bins |
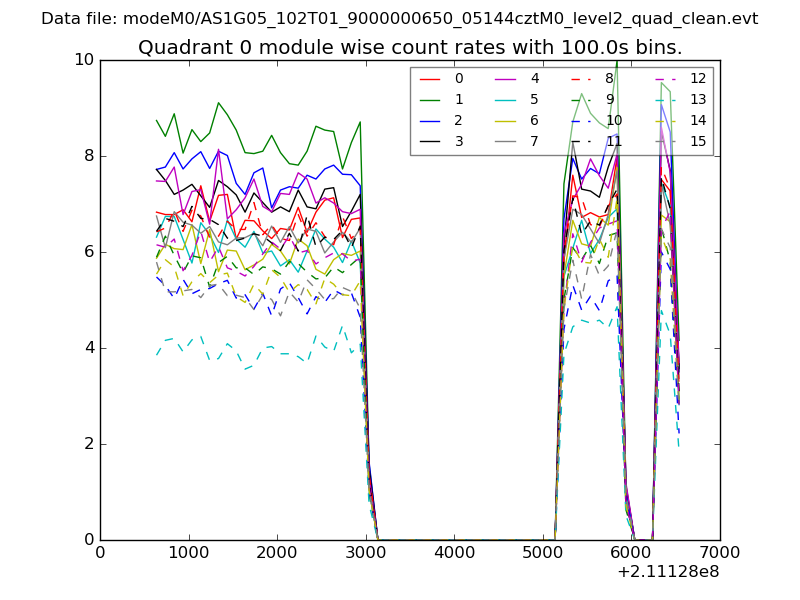 |
 |
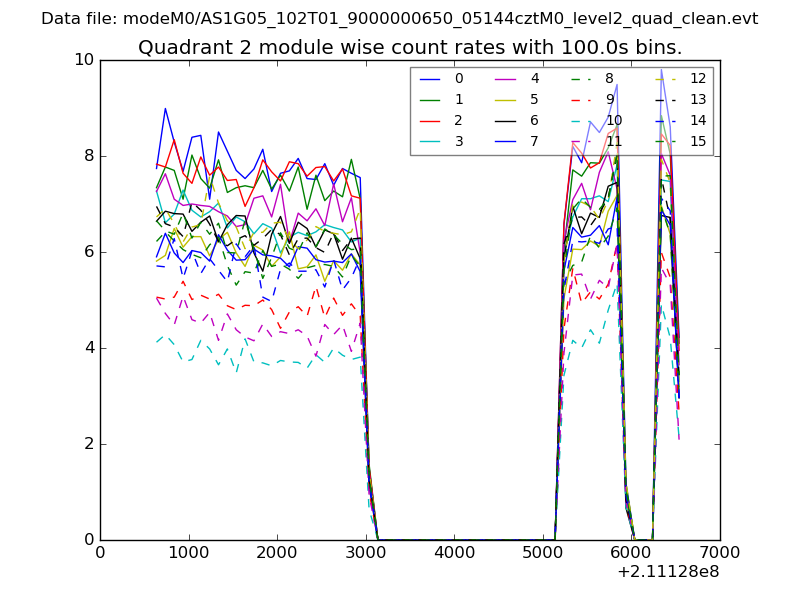
| Module-wise count rates for Quadrant B Data is divided into 100 sec bins |
 |
 |
| Module-wise count rates for Quadrant C Data is divided into 100 sec bins |
 |
 |
| Module-wise count rates for Quadrant D Data is divided into 100 sec bins |
 |
 |
| Parameter | Plot |
|---|---|
| CZT HV Monitor | 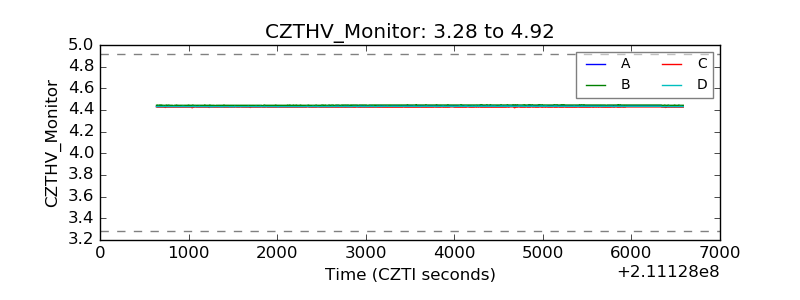 |
| D_VDD | 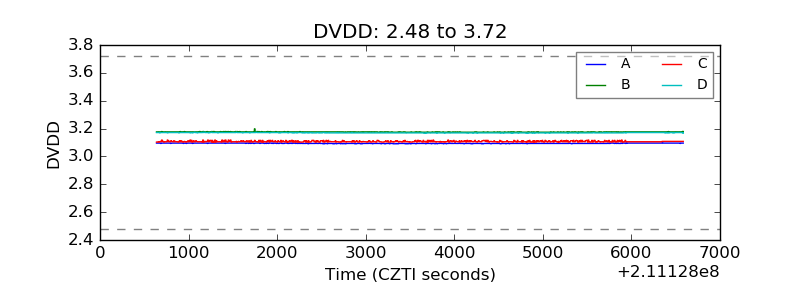 |
| Temperature 1 | 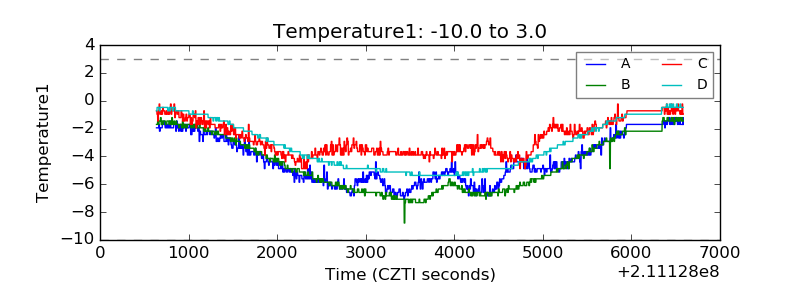 |
| Veto HV Monitor | 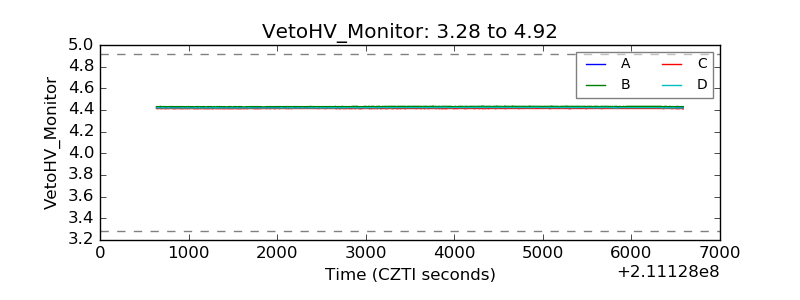 |
| Veto LLD | 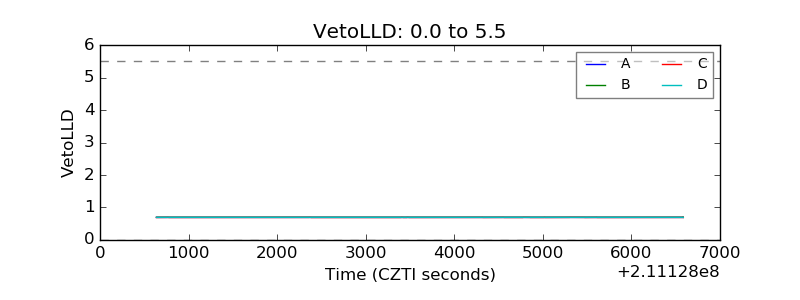 |
| Alpha Counter | 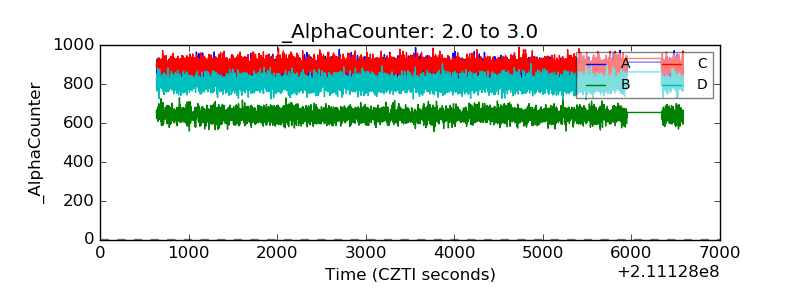 |
| _CPM_Rate | 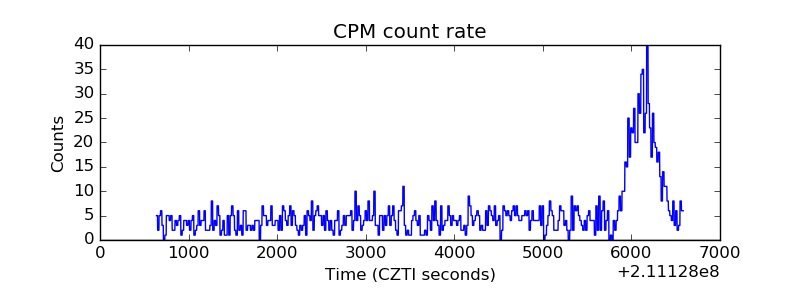 |
| CZT Counter | 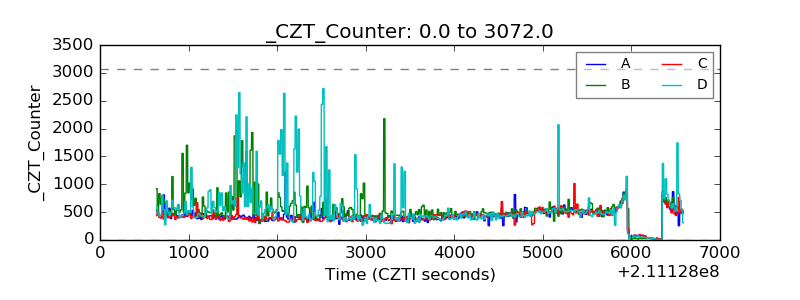 |
| +2.5 Volts monitor |  |
| +5 Volts monitor | 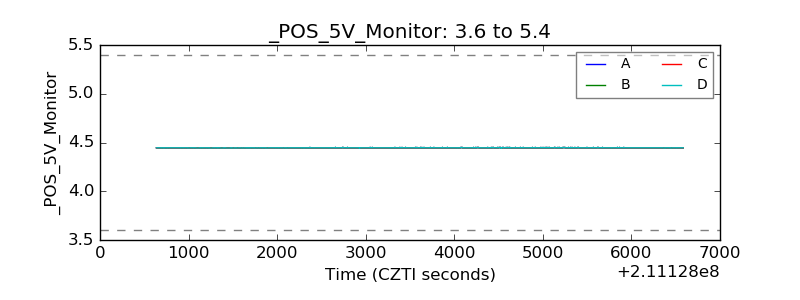 |
| _ROLL_ROT | 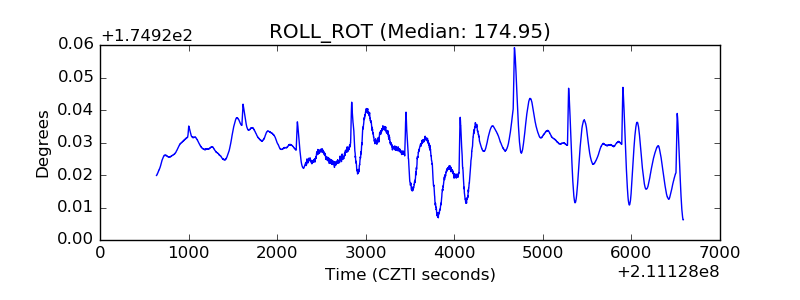 |
| _Roll_DEC | 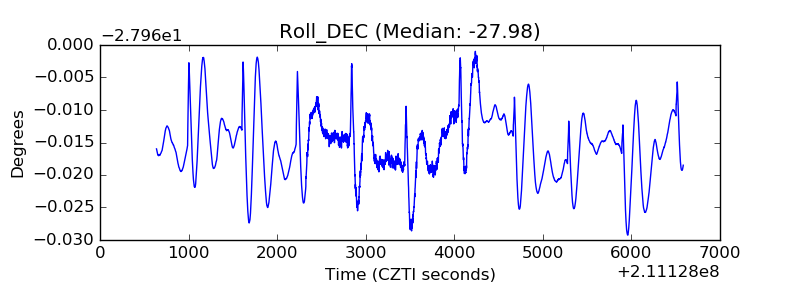 |
| _Roll_RA | 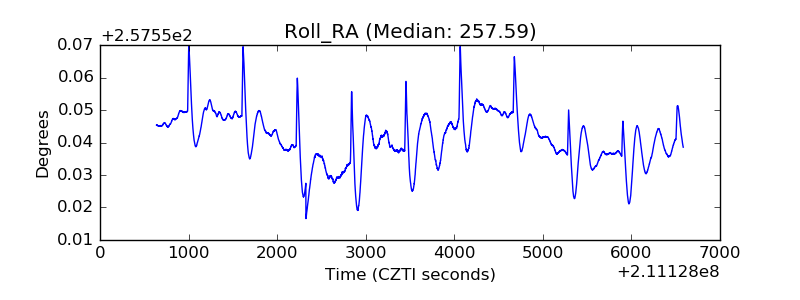 |
| Veto Counter | 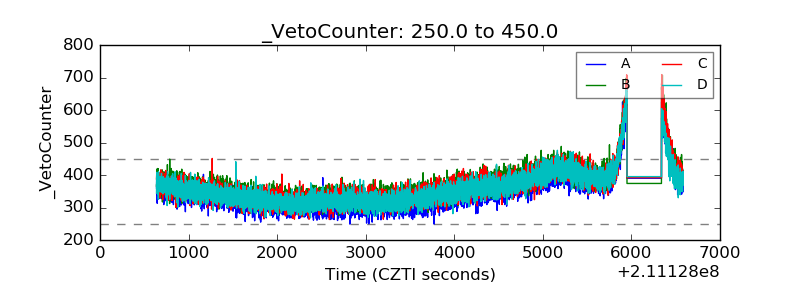 |