| Param | Original file | Final file |
|---|---|---|
| Filename | modeM0/AS1G05_102T01_9000000650_05148cztM0_level2.evt | modeM0/AS1G05_102T01_9000000650_05148cztM0_level2_quad_clean.evt |
| Size (bytes) | 428,780,160 | 69,079,680 |
| Size | 408.9 MB | 65.9 MB |
| Events in quadrant A | 3,014,713 | 412,952 |
| Events in quadrant B | 3,160,232 | 416,272 |
| Events in quadrant C | 2,947,368 | 411,533 |
| Events in quadrant D | 3,411,932 | 388,162 |
| Mode M0 | |||
|---|---|---|---|
| Quadrant | BADHDUFLAG | Total packets | Discarded packets |
| A | 0 | 13603 | 3 |
| B | 0 | 13810 | 2 |
| C | 0 | 13495 | 2 |
| D | 0 | 15100 | 2 |
| Mode M9 | |||
|---|---|---|---|
| Quadrant | BADHDUFLAG | Total packets | Discarded packets |
| A | 0 | 16 | 0 |
| B | 0 | 16 | 0 |
| C | 0 | 16 | 0 |
| D | 0 | 17 | 0 |
| Mode SS | |||
|---|---|---|---|
| Quadrant | BADHDUFLAG | Total packets | Discarded packets |
| A | 0 | 136 | 0 |
| B | 0 | 136 | 0 |
| C | 0 | 136 | 0 |
| D | 0 | 136 | 0 |
| Quadrant | Total seconds | Saturated seconds | Saturation percentage |
|---|---|---|---|
| A | 6631 | 34 | 0.512743% |
| B | 6631 | 29 | 0.437340% |
| C | 6631 | 11 | 0.165887% |
| D | 6631 | 155 | 2.337506% |
Noise dominated data is calculated using 1-second bins in cleaned event files. If a bin has >2000 counts, and if more than 50% of those come from <1% of pixels, then it is considered to be noise-dominated and hence unusable.
| Quadrant | # 1 sec bins | Bins with >0 counts | Bins with >2000 counts | High rate bins dominated by noise | Noise dominated (total time) | Noise dominated (detector-on time) | Marked lightcurve |
|---|---|---|---|---|---|---|---|
| A | 7666 | 6632 | 26 | 26 | 0.34% | 0.39% | 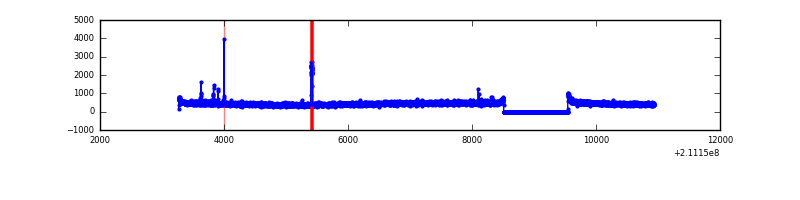 |
| B | 7666 | 6632 | 3 | 3 | 0.04% | 0.05% | 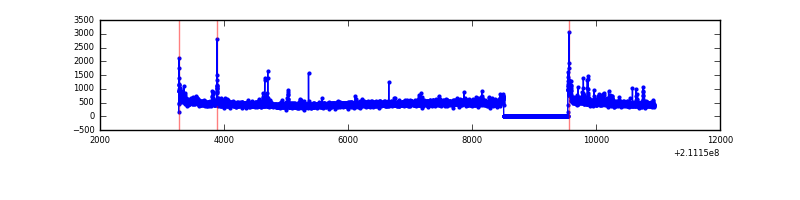 |
| C | 7666 | 6632 | 0 | 0 | 0.00% | 0.00% | 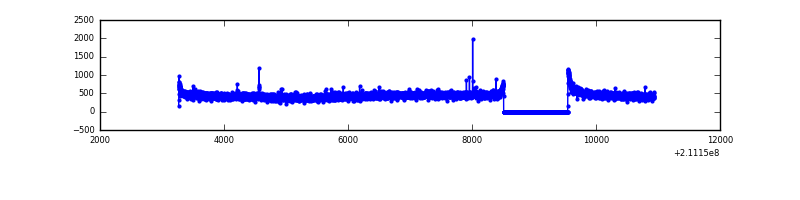 |
| D | 7666 | 6632 | 104 | 104 | 1.36% | 1.57% | 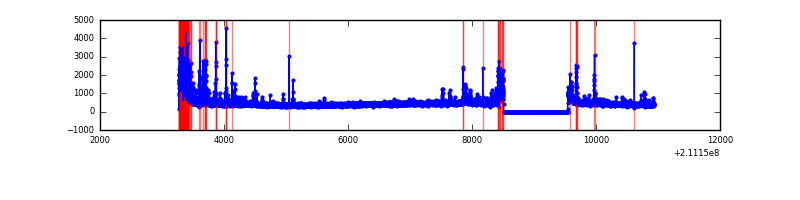 |
Top three noisy pixels from each quadrant. If the there are fewer than three noisy pixels in the level2.evt file, extra rows are filled as -1
| Pixel properties | Quadrant properties | ||||||
|---|---|---|---|---|---|---|---|
| Quadrant | DetID | PixID | Counts | Sigma | Mean | Median | Sigma |
| A | 0 | 247 | 48587 | 303.84 | 760 | 742 | 157.5 |
| A | 0 | 50 | 26146 | 161.33 | 760 | 742 | 157.5 |
| A | 0 | 226 | 11760 | 69.97 | 760 | 742 | 157.5 |
| B | 4 | 80 | 33185 | 218.56 | 775 | 755 | 148.4 |
| B | 15 | 204 | 29949 | 196.75 | 775 | 755 | 148.4 |
| B | 0 | 219 | 29367 | 192.83 | 775 | 755 | 148.4 |
| C | 1 | 16 | 50380 | 287.07 | 740 | 745 | 172.9 |
| C | 13 | 61 | 6140 | 31.2 | 740 | 745 | 172.9 |
| C | 12 | 4 | 3850 | 17.96 | 740 | 745 | 172.9 |
| D | 2 | 33 | 366709 | 2023.64 | 729 | 708 | 180.9 |
| D | 12 | 233 | 107967 | 593.04 | 729 | 708 | 180.9 |
| D | 2 | 136 | 63325 | 346.21 | 729 | 708 | 180.9 |
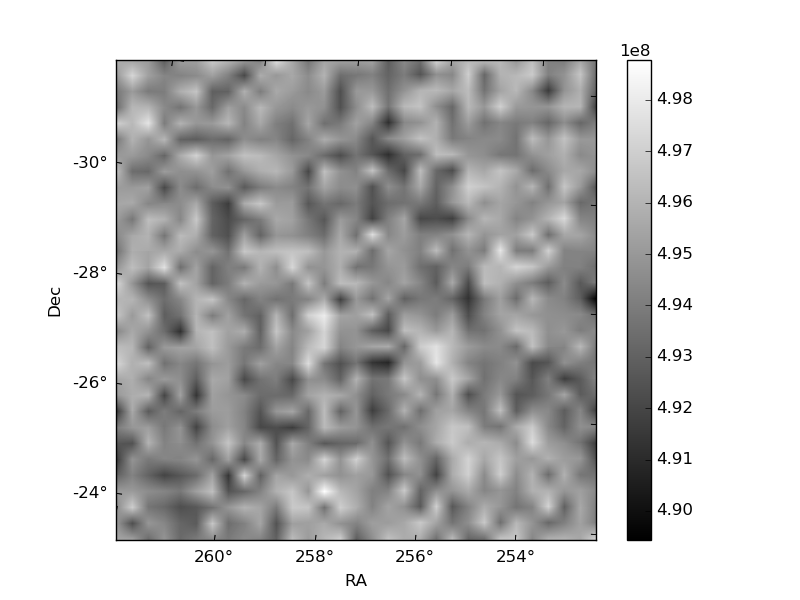
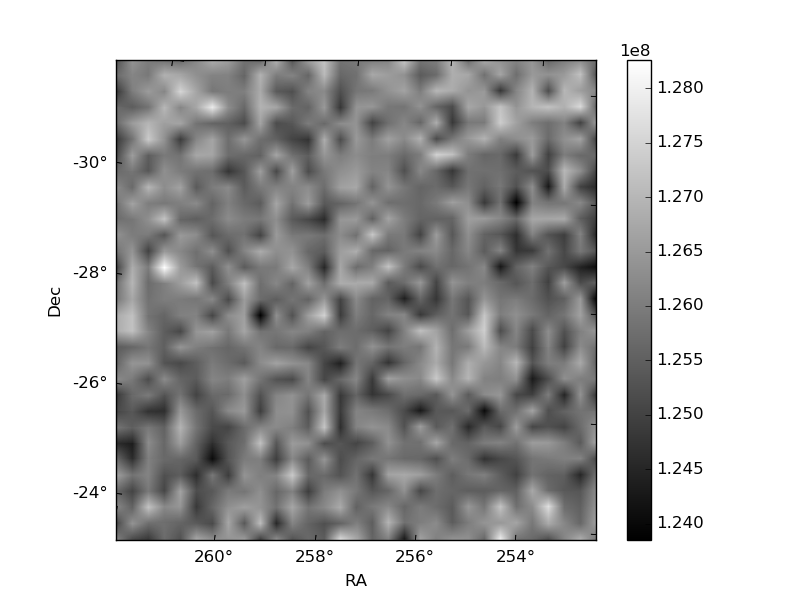
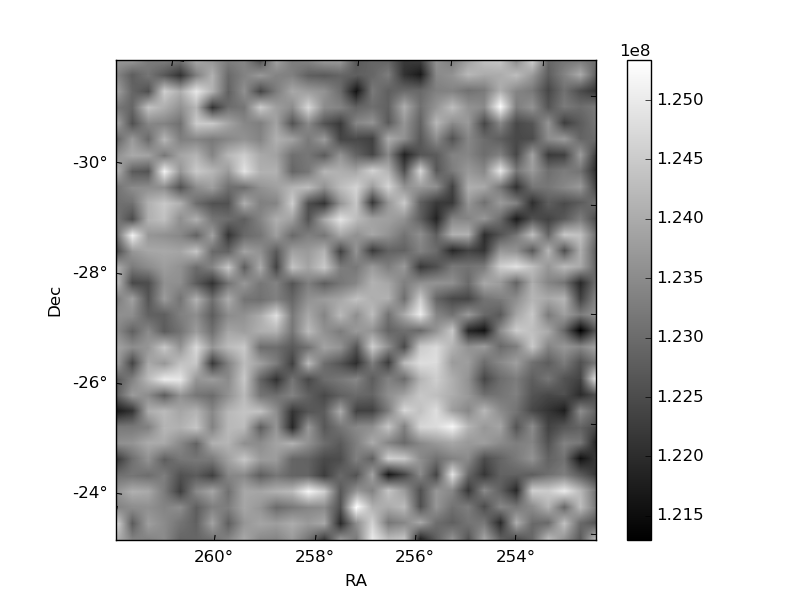
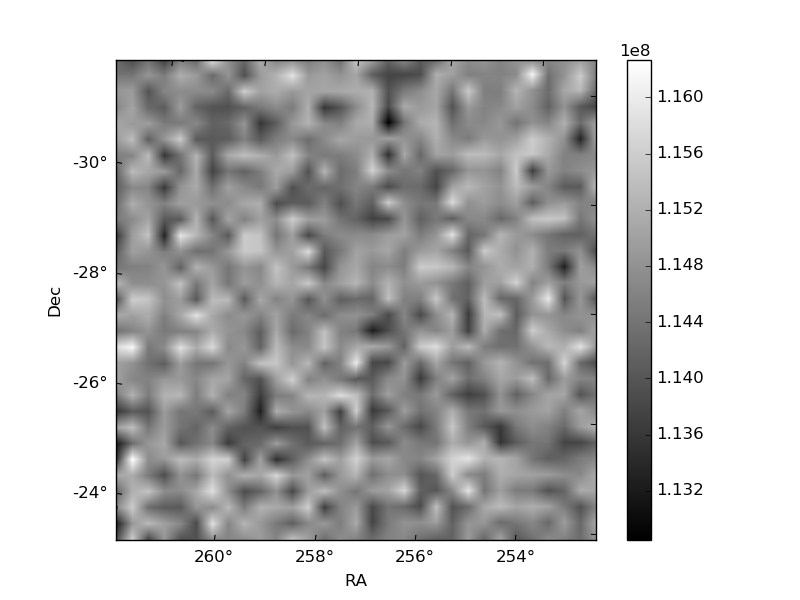
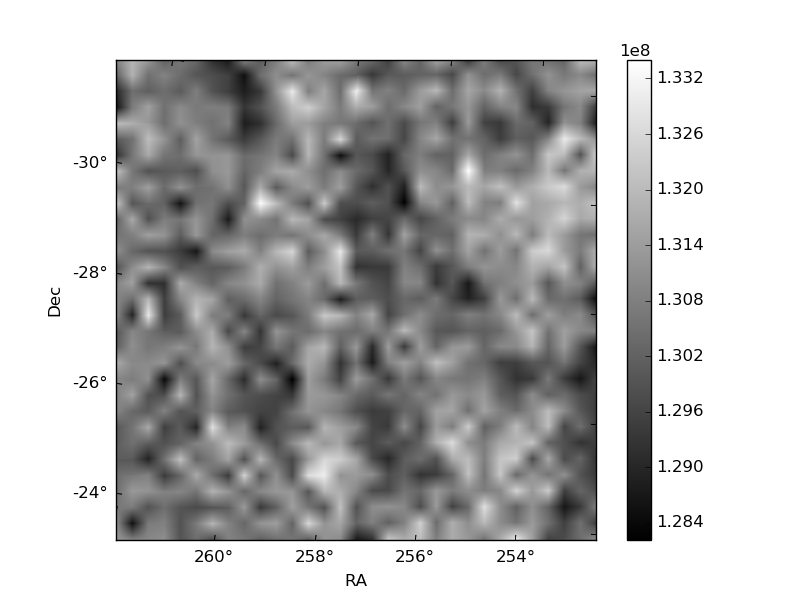
Histogram calculated using DETX and DETY for each event in the final _common_clean file
| Quadrant A | 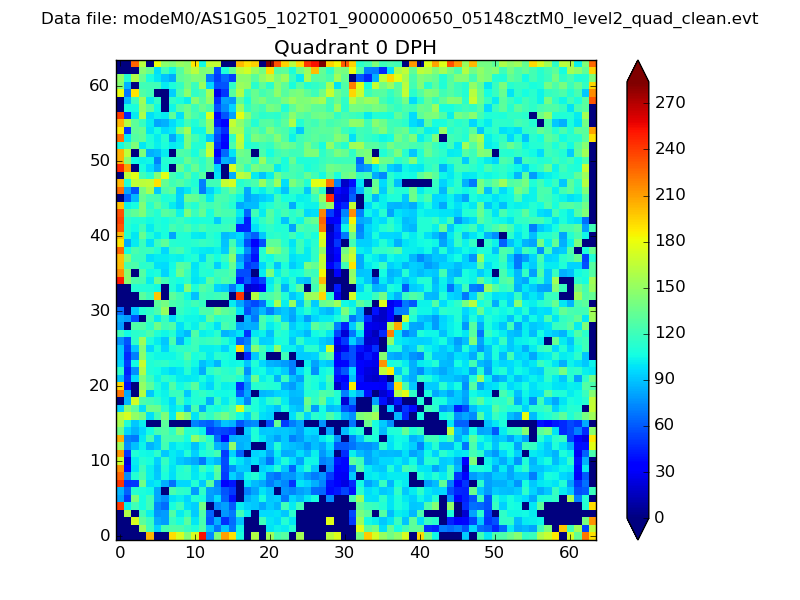 |
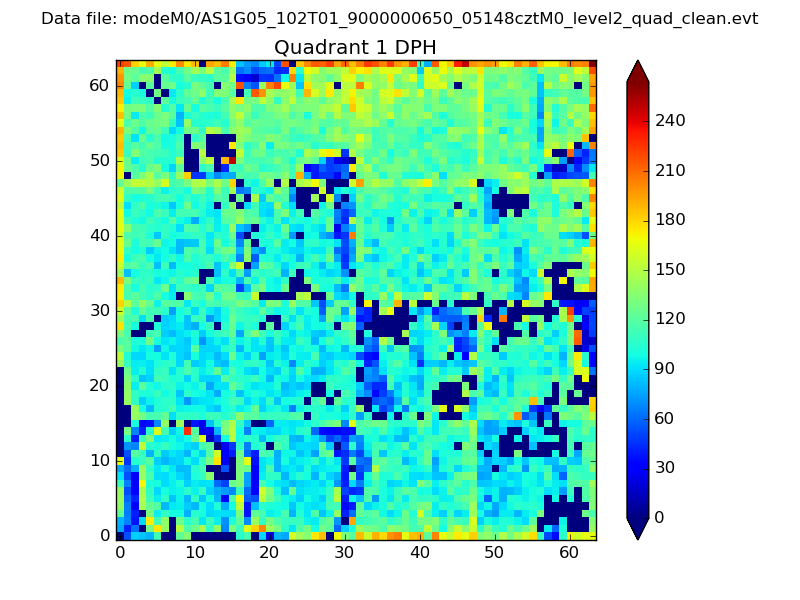 |
Quadrant B |
|---|---|---|---|
| Quadrant D | 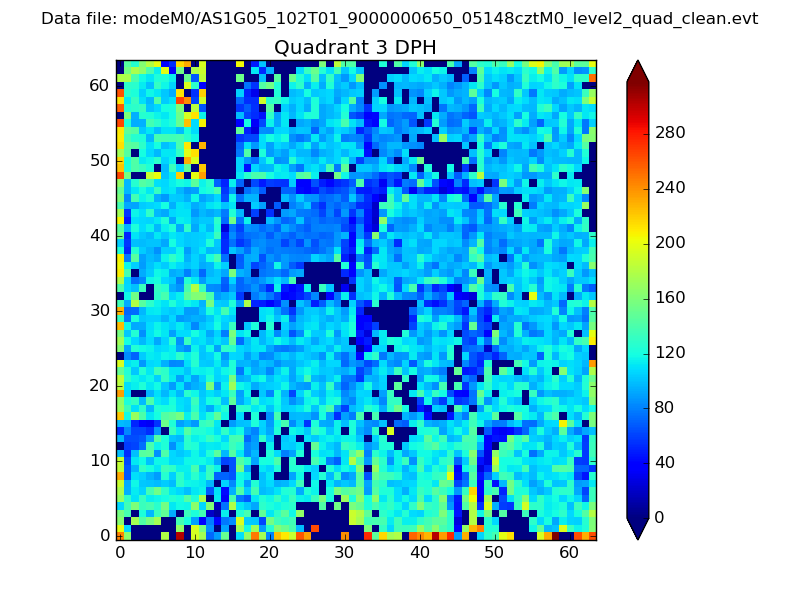 |
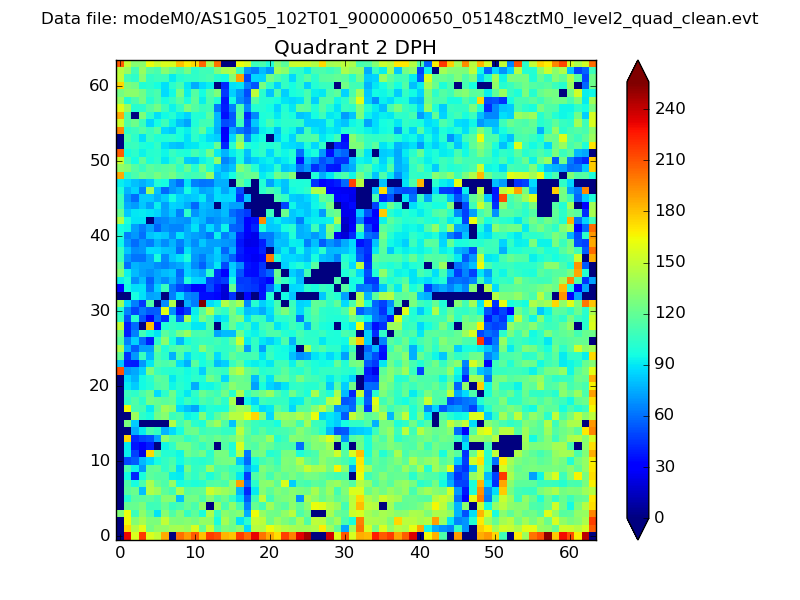 |
Quadrant C |
| Plot type | Count rate plots | Images |
|---|---|---|
| Comparison with Poisson distribution Blue bars denote a histogram of data divided into 1 sec bins. Red curve is a Poisson curve with rate = median count rate of data. |
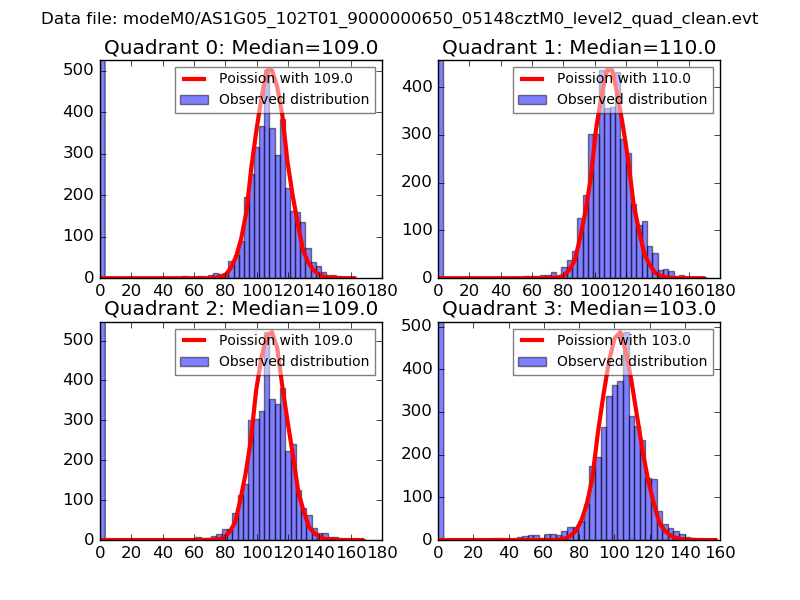 |
 |
| Quadrant-wise count rates Data is divided into 100 sec bins |
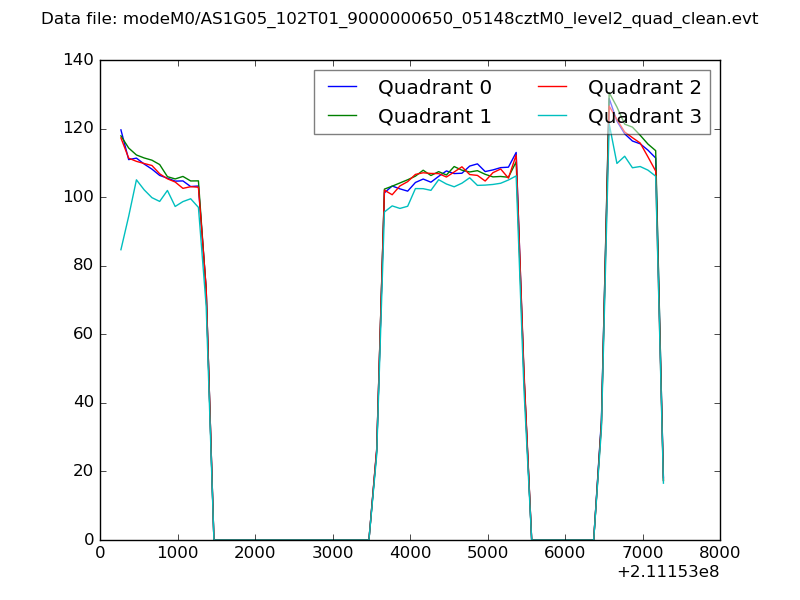 |
|
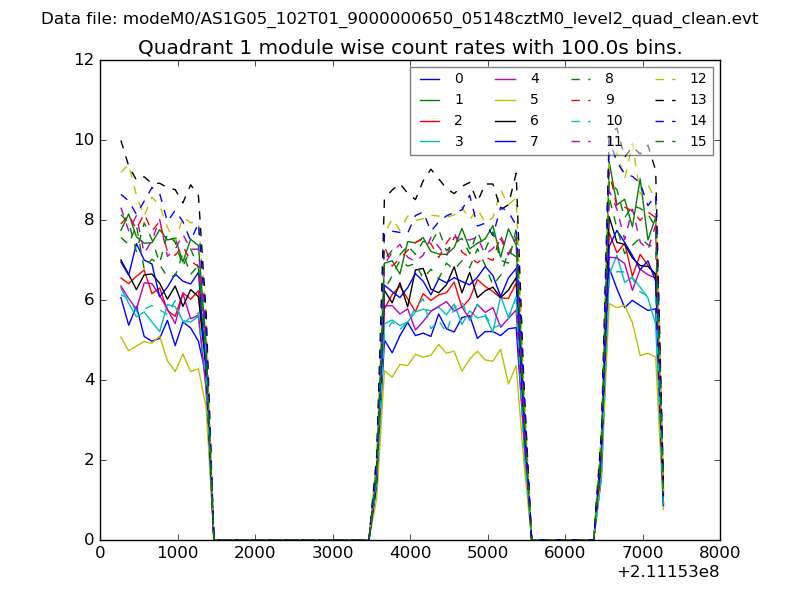
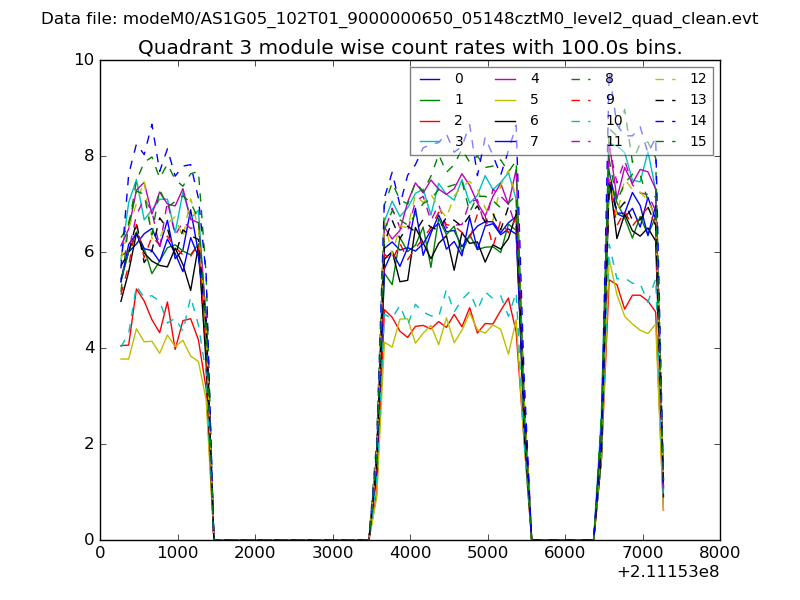
| Module-wise count rates for Quadrant A Data is divided into 100 sec bins |
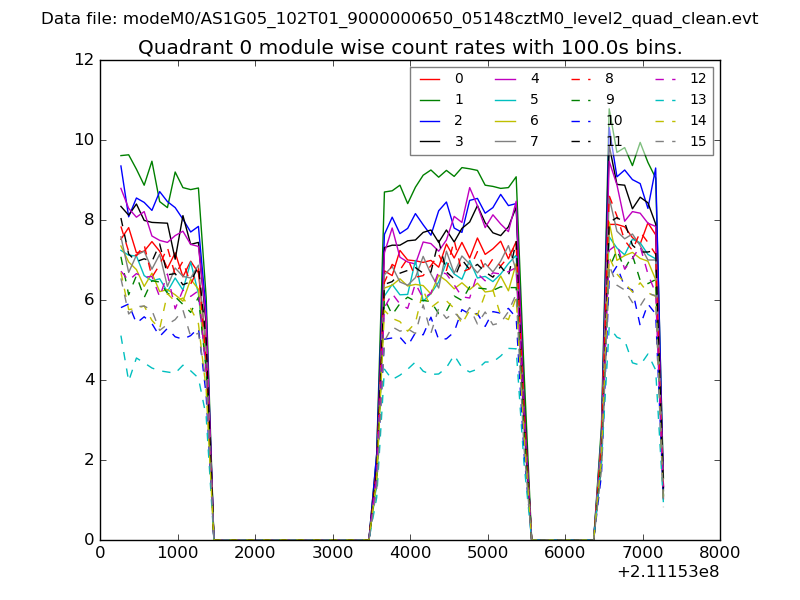 |
 |
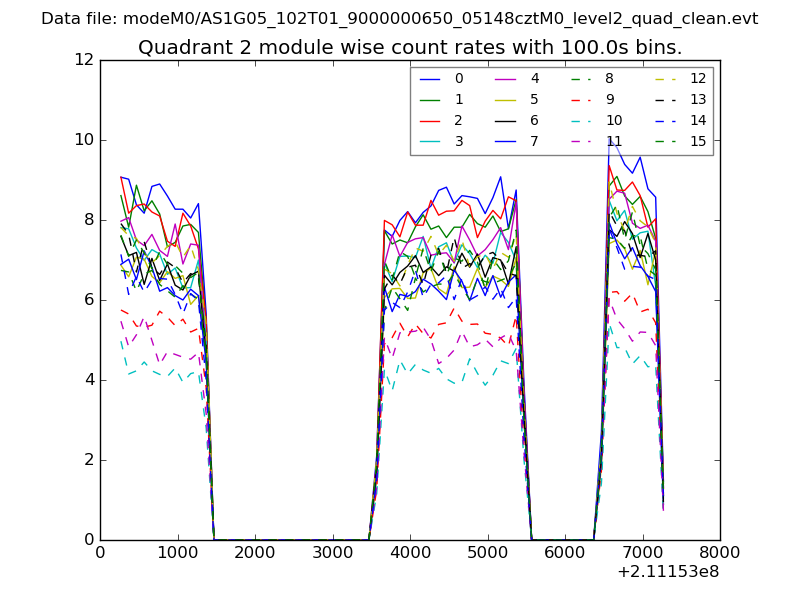
| Module-wise count rates for Quadrant B Data is divided into 100 sec bins |
 |
 |
| Module-wise count rates for Quadrant C Data is divided into 100 sec bins |
 |
 |
| Module-wise count rates for Quadrant D Data is divided into 100 sec bins |
 |
 |
| Parameter | Plot |
|---|---|
| CZT HV Monitor | 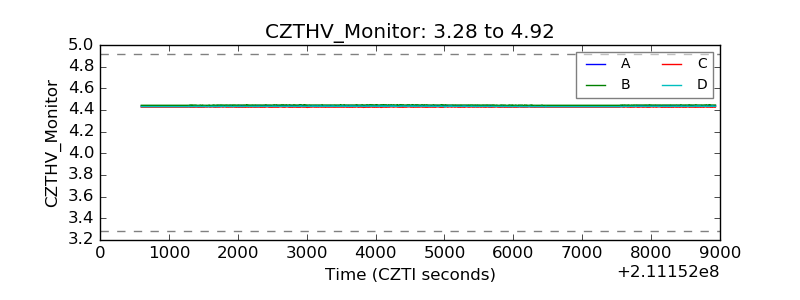 |
| D_VDD | 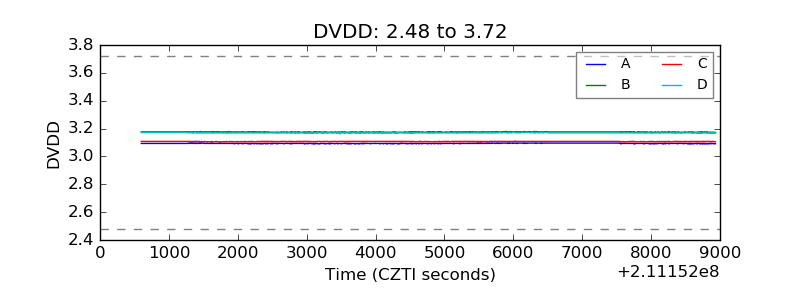 |
| Temperature 1 |  |
| Veto HV Monitor | 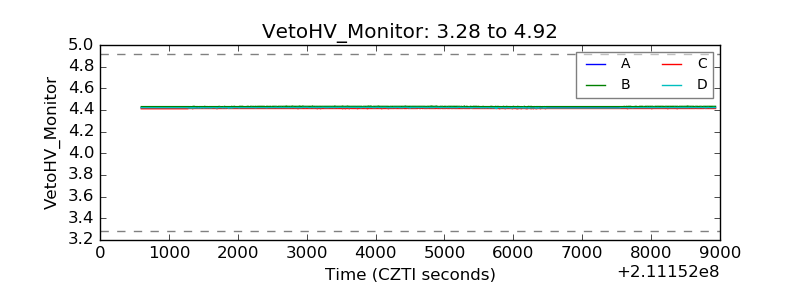 |
| Veto LLD | 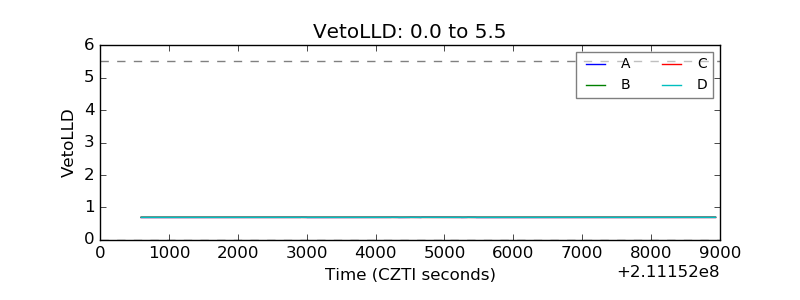 |
| Alpha Counter | 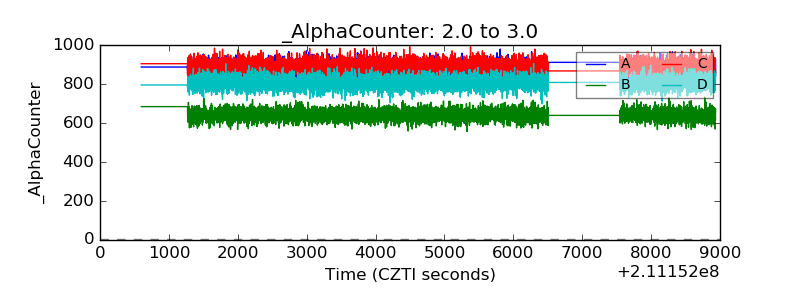 |
| _CPM_Rate | 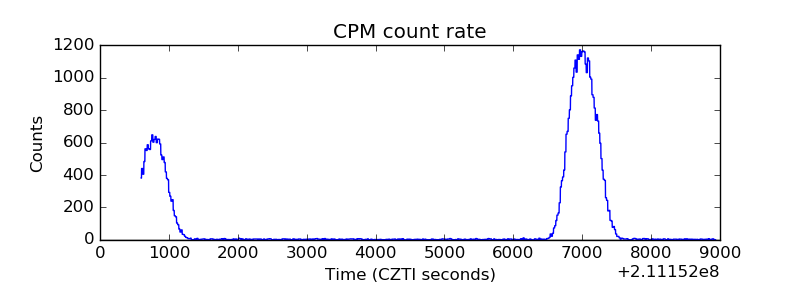 |
| CZT Counter | 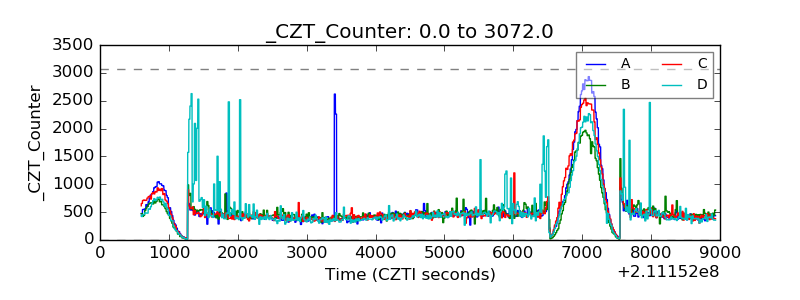 |
| +2.5 Volts monitor |  |
| +5 Volts monitor | 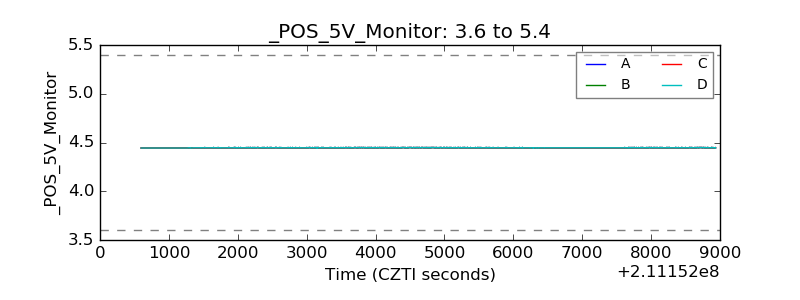 |
| _ROLL_ROT | 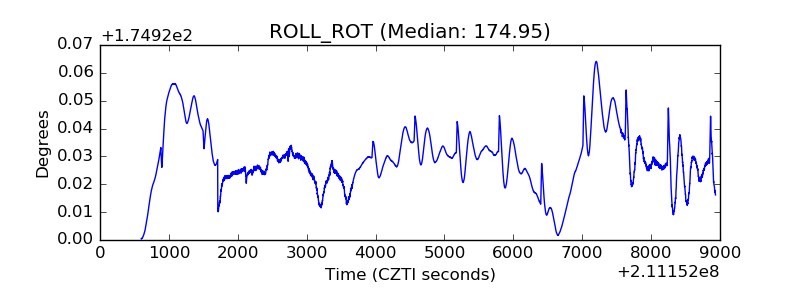 |
| _Roll_DEC | 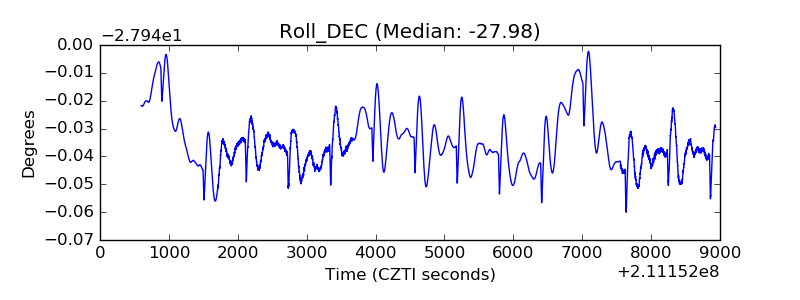 |
| _Roll_RA | 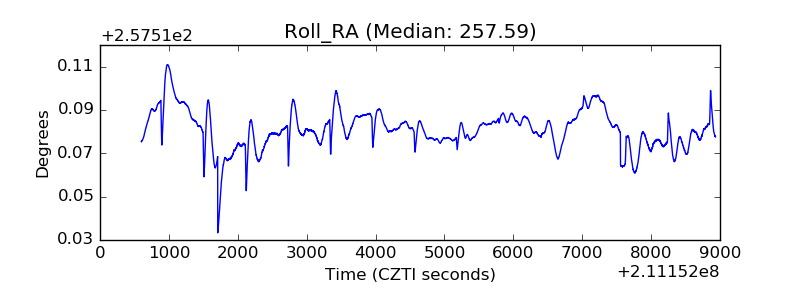 |
| Veto Counter | 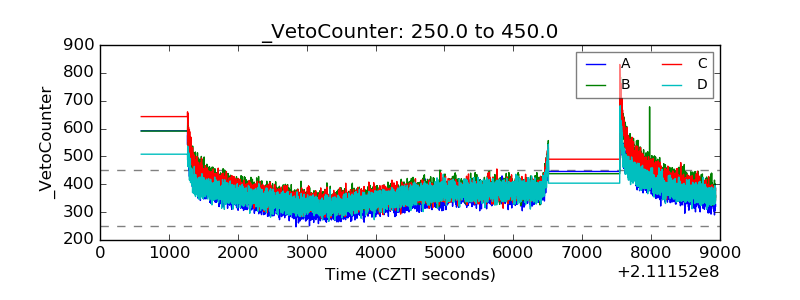 |