| Param | Original file | Final file |
|---|---|---|
| Filename | modeM0/AS1G05_102T01_9000000650_05150cztM0_level2.evt | modeM0/AS1G05_102T01_9000000650_05150cztM0_level2_quad_clean.evt |
| Size (bytes) | 439,300,800 | 64,823,040 |
| Size | 418.9 MB | 61.8 MB |
| Events in quadrant A | 3,103,512 | 377,038 |
| Events in quadrant B | 3,365,861 | 379,251 |
| Events in quadrant C | 3,133,399 | 377,051 |
| Events in quadrant D | 3,241,379 | 357,560 |
| Mode M0 | |||
|---|---|---|---|
| Quadrant | BADHDUFLAG | Total packets | Discarded packets |
| A | 0 | 13840 | 3 |
| B | 0 | 14358 | 2 |
| C | 0 | 13957 | 2 |
| D | 0 | 14619 | 2 |
| Mode M9 | |||
|---|---|---|---|
| Quadrant | BADHDUFLAG | Total packets | Discarded packets |
| A | 0 | 22 | 0 |
| B | 0 | 22 | 0 |
| C | 0 | 22 | 0 |
| D | 0 | 22 | 0 |
| Mode SS | |||
|---|---|---|---|
| Quadrant | BADHDUFLAG | Total packets | Discarded packets |
| A | 0 | 138 | 0 |
| B | 0 | 138 | 0 |
| C | 0 | 138 | 0 |
| D | 0 | 138 | 0 |
| Quadrant | Total seconds | Saturated seconds | Saturation percentage |
|---|---|---|---|
| A | 6771 | 19 | 0.280608% |
| B | 6771 | 43 | 0.635061% |
| C | 6771 | 28 | 0.413528% |
| D | 6771 | 68 | 1.004283% |
Noise dominated data is calculated using 1-second bins in cleaned event files. If a bin has >2000 counts, and if more than 50% of those come from <1% of pixels, then it is considered to be noise-dominated and hence unusable.
| Quadrant | # 1 sec bins | Bins with >0 counts | Bins with >2000 counts | High rate bins dominated by noise | Noise dominated (total time) | Noise dominated (detector-on time) | Marked lightcurve |
|---|---|---|---|---|---|---|---|
| A | 8946 | 6773 | 0 | 0 | 0.00% | 0.00% | 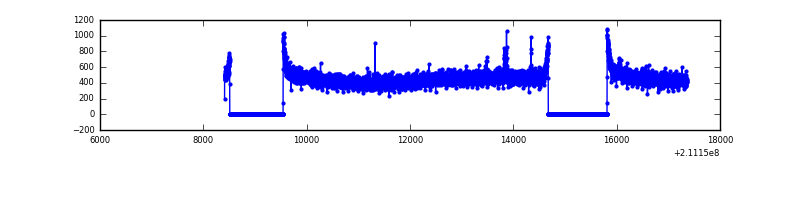 |
| B | 8946 | 6773 | 1 | 1 | 0.01% | 0.01% | 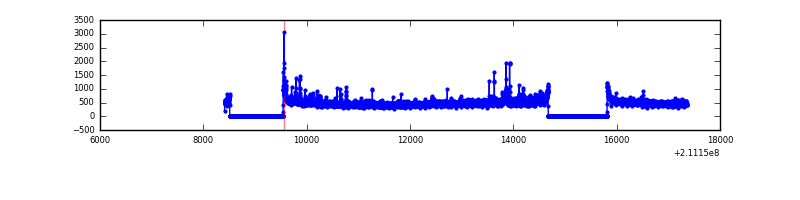 |
| C | 8946 | 6773 | 0 | 0 | 0.00% | 0.00% | 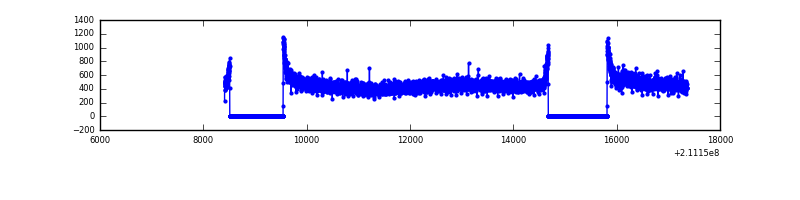 |
| D | 8946 | 6773 | 19 | 19 | 0.21% | 0.28% | 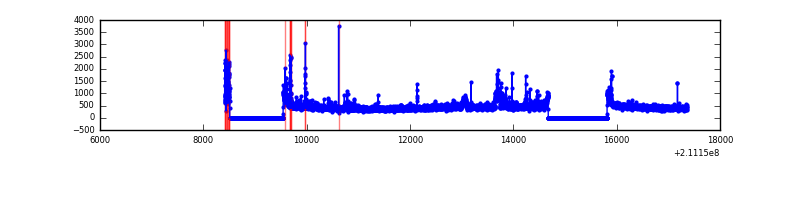 |
Top three noisy pixels from each quadrant. If the there are fewer than three noisy pixels in the level2.evt file, extra rows are filled as -1
| Pixel properties | Quadrant properties | ||||||
|---|---|---|---|---|---|---|---|
| Quadrant | DetID | PixID | Counts | Sigma | Mean | Median | Sigma |
| A | 0 | 50 | 16515 | 95.16 | 802 | 786 | 165.3 |
| A | 0 | 226 | 7911 | 43.11 | 802 | 786 | 165.3 |
| A | 12 | 194 | 7844 | 42.7 | 802 | 786 | 165.3 |
| B | 8 | 3 | 98866 | 630.64 | 817 | 799 | 155.5 |
| B | 15 | 204 | 27290 | 170.36 | 817 | 799 | 155.5 |
| B | 4 | 80 | 26688 | 166.48 | 817 | 799 | 155.5 |
| C | 1 | 16 | 79762 | 435.38 | 782 | 788 | 181.4 |
| C | 13 | 61 | 6235 | 30.03 | 782 | 788 | 181.4 |
| C | 3 | 202 | 1944 | 6.37 | 782 | 788 | 181.4 |
| D | 2 | 33 | 109767 | 573.27 | 773 | 749 | 190.2 |
| D | 12 | 110 | 104314 | 544.59 | 773 | 749 | 190.2 |
| D | 2 | 136 | 36881 | 190.0 | 773 | 749 | 190.2 |
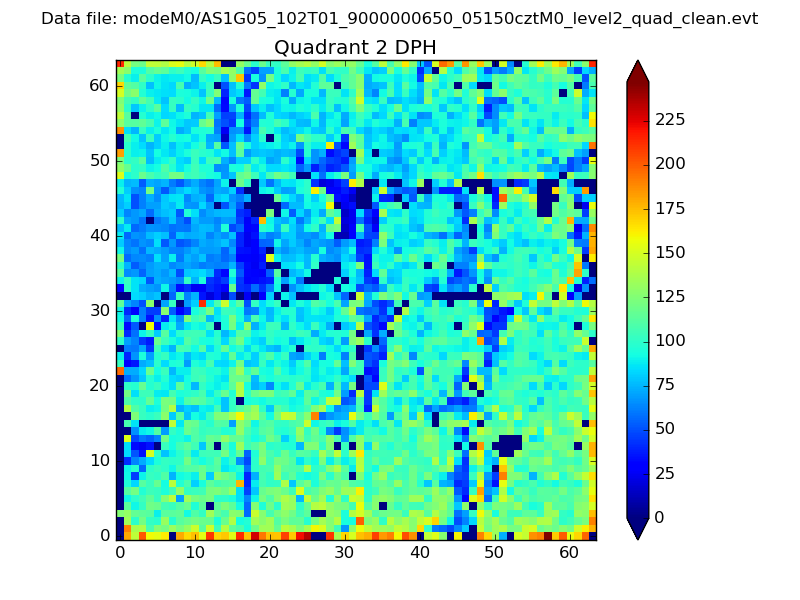
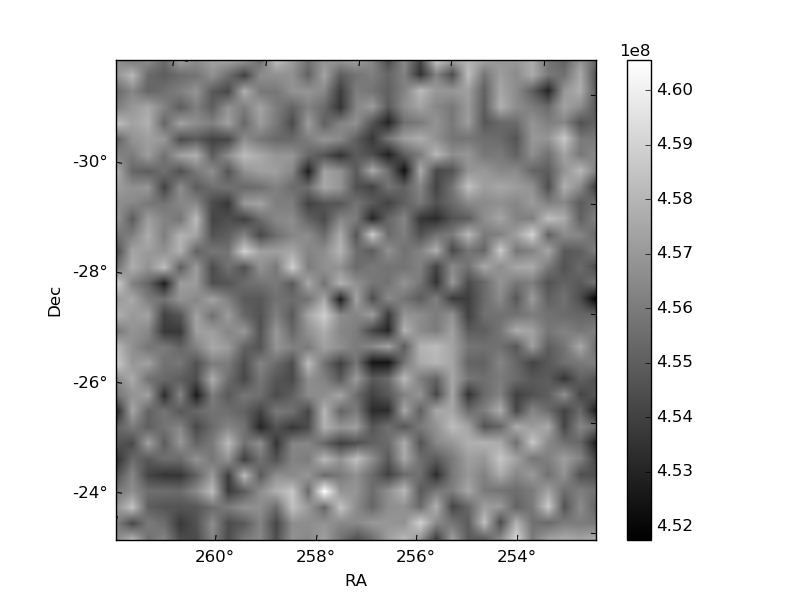
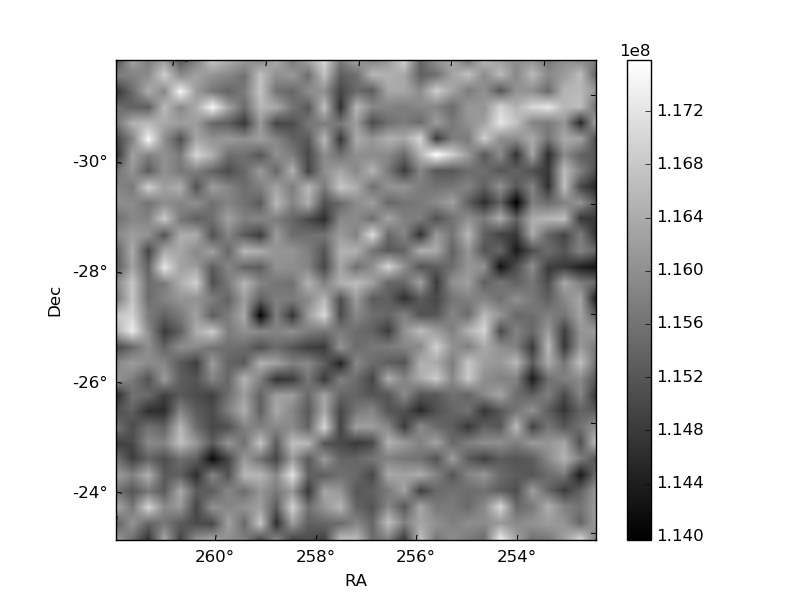
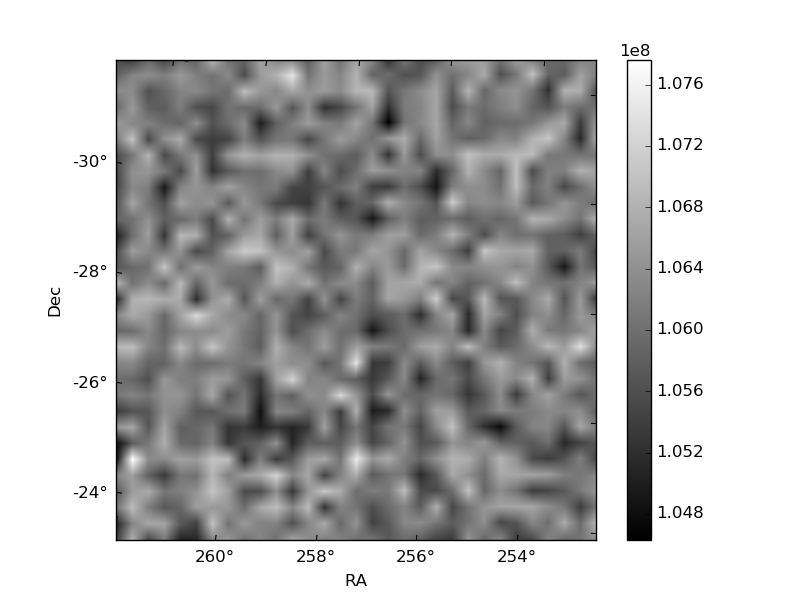
Histogram calculated using DETX and DETY for each event in the final _common_clean file
| Quadrant A | 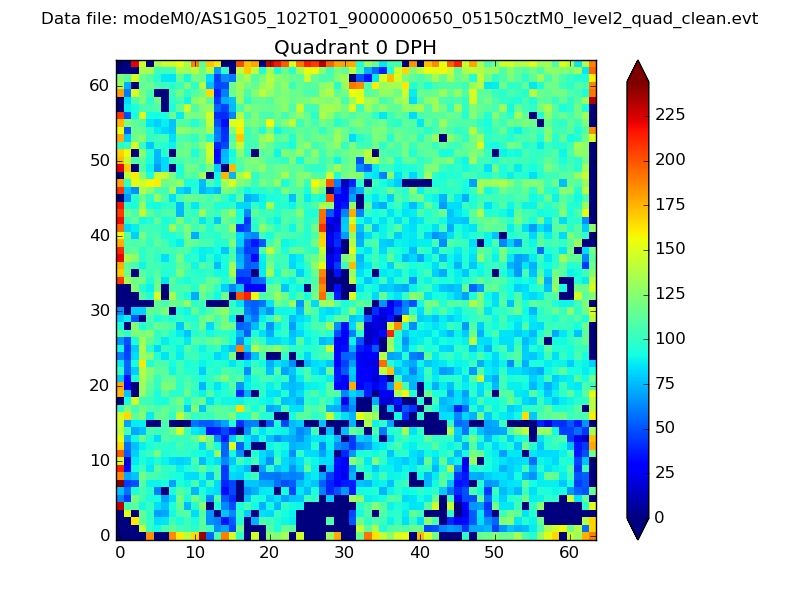 |
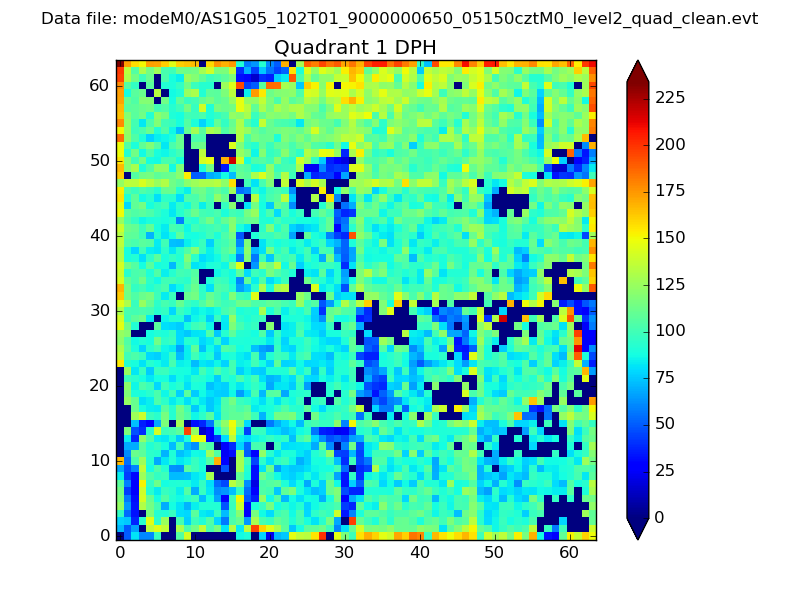 |
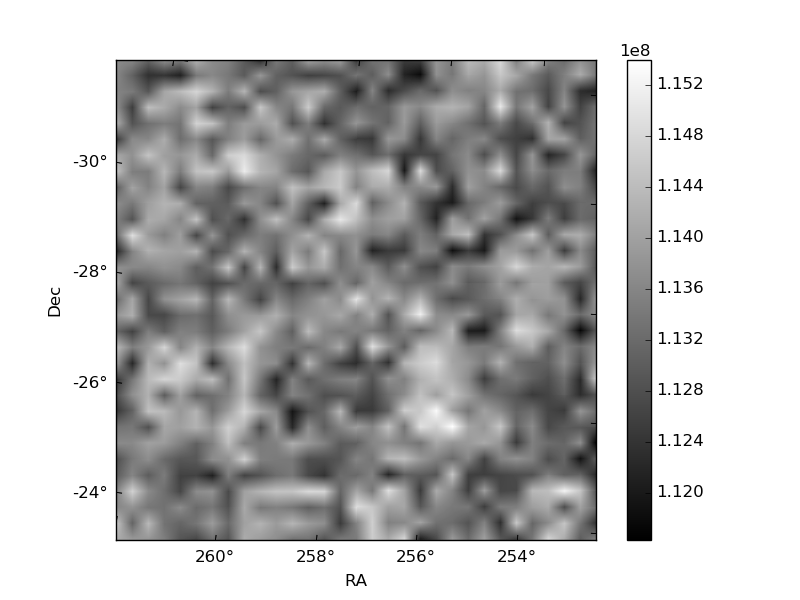
Quadrant B |
|---|---|---|---|
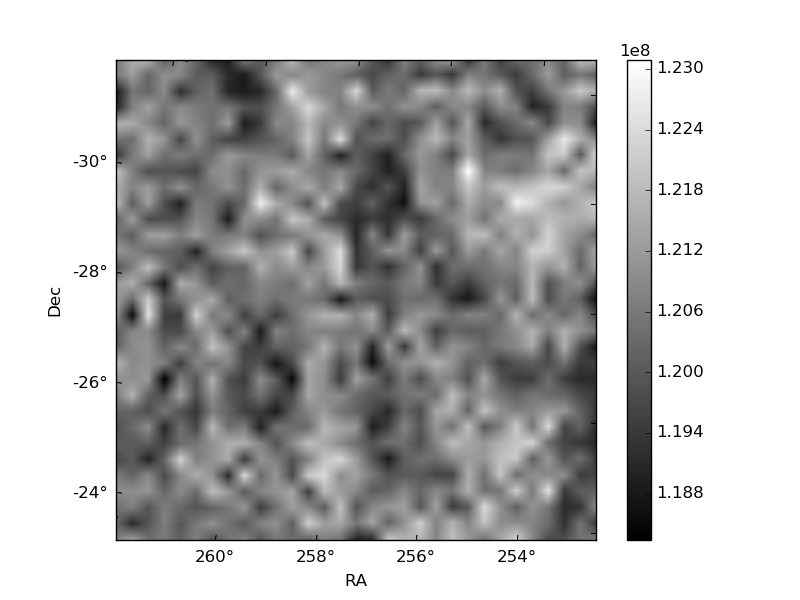
| Quadrant D | 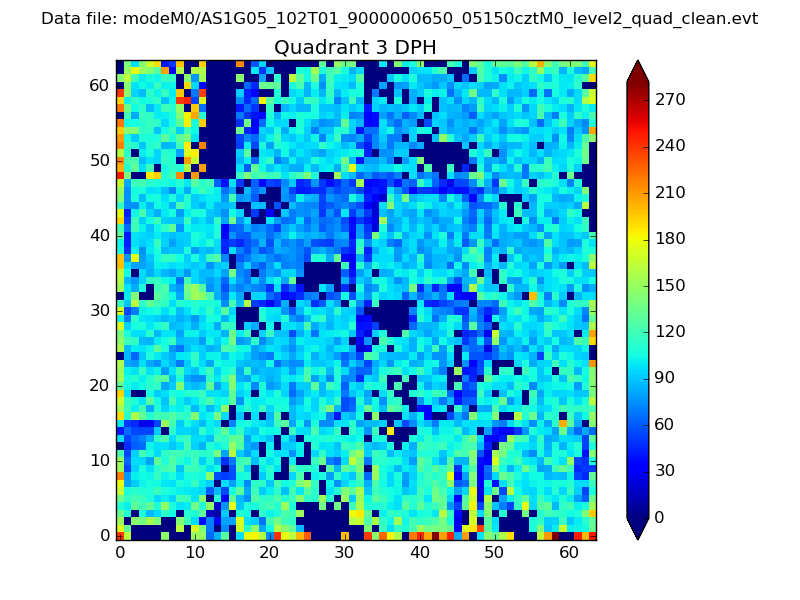 |
 |
Quadrant C |
| Plot type | Count rate plots | Images |
|---|---|---|
| Comparison with Poisson distribution Blue bars denote a histogram of data divided into 1 sec bins. Red curve is a Poisson curve with rate = median count rate of data. |
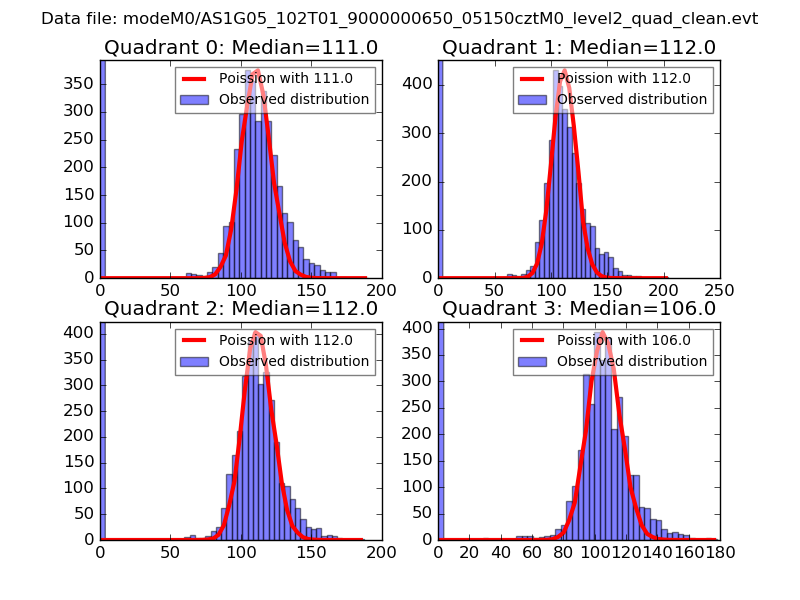 |
 |
| Quadrant-wise count rates Data is divided into 100 sec bins |
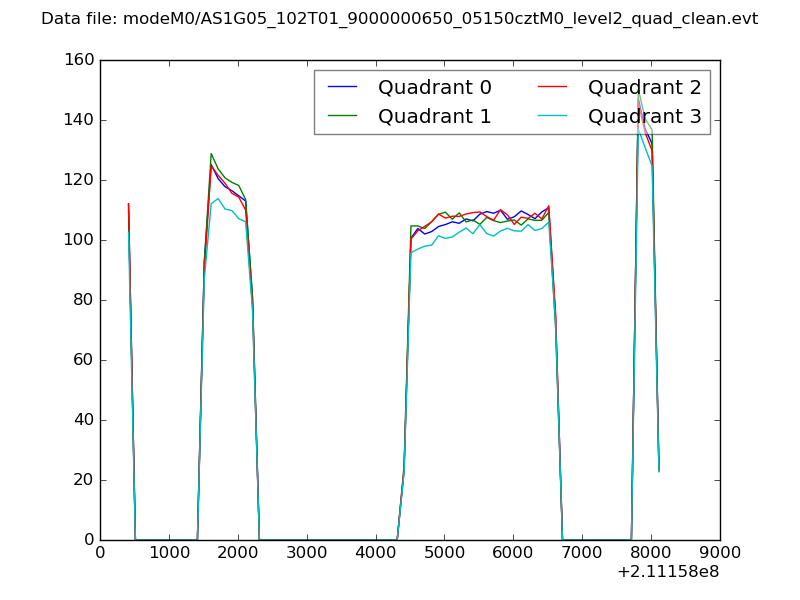 |
|
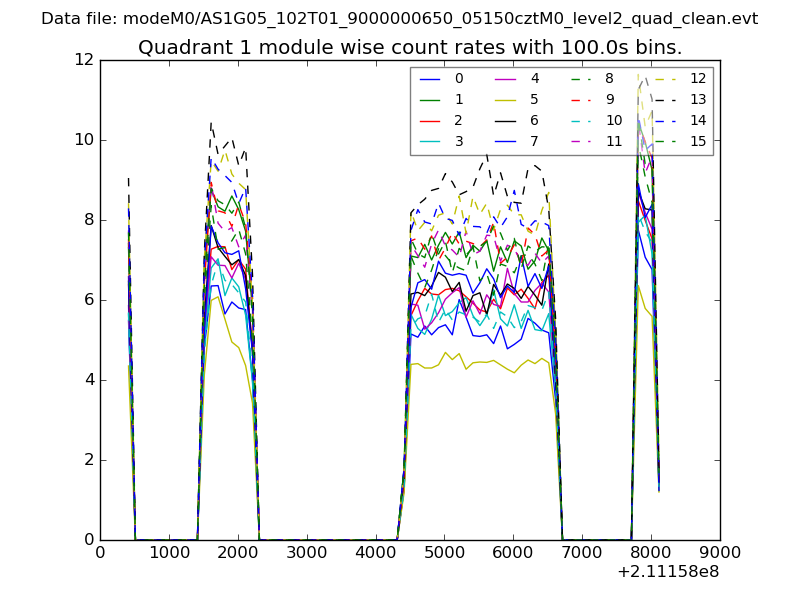
| Module-wise count rates for Quadrant A Data is divided into 100 sec bins |
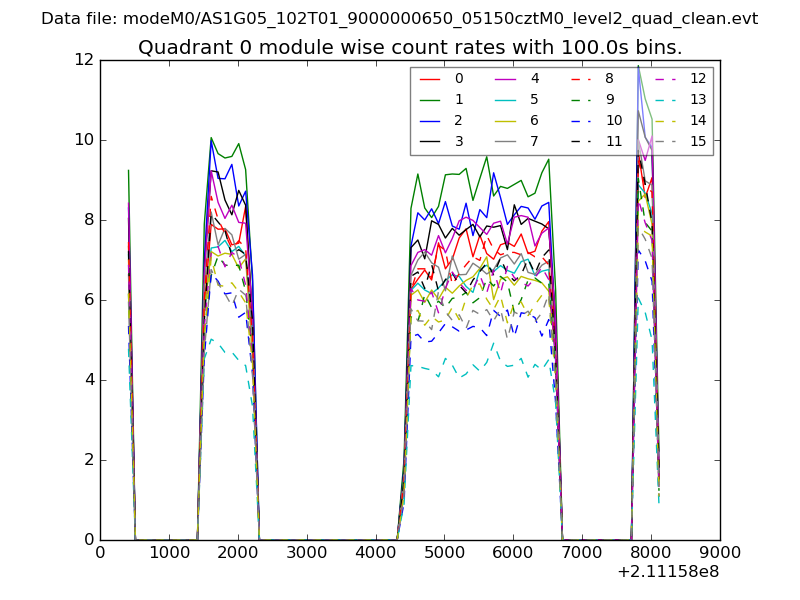 |
 |
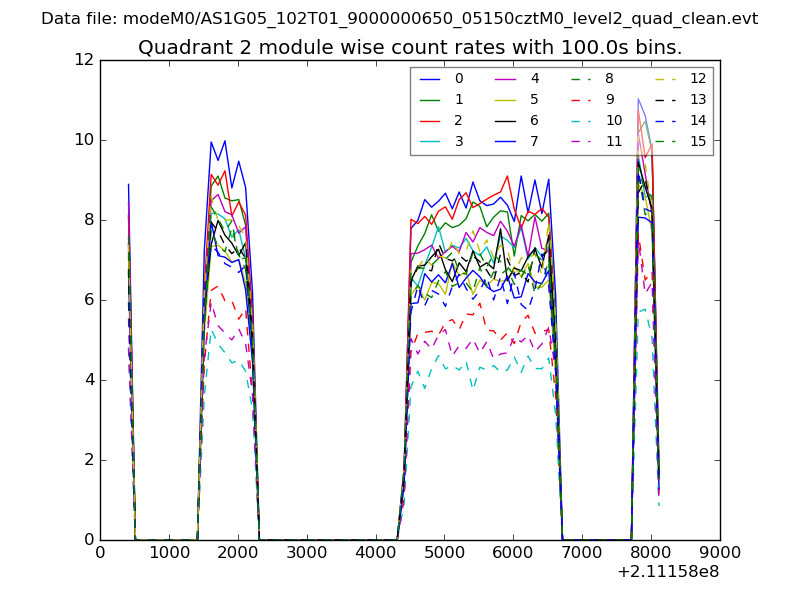
| Module-wise count rates for Quadrant B Data is divided into 100 sec bins |
 |
 |
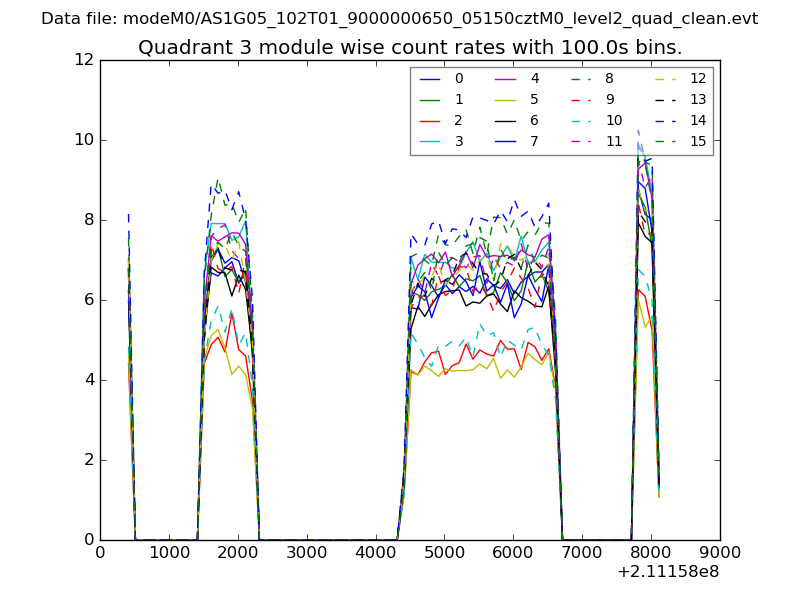
| Module-wise count rates for Quadrant C Data is divided into 100 sec bins |
 |
 |
| Module-wise count rates for Quadrant D Data is divided into 100 sec bins |
 |
 |
| Parameter | Plot |
|---|---|
| CZT HV Monitor |  |
| D_VDD | 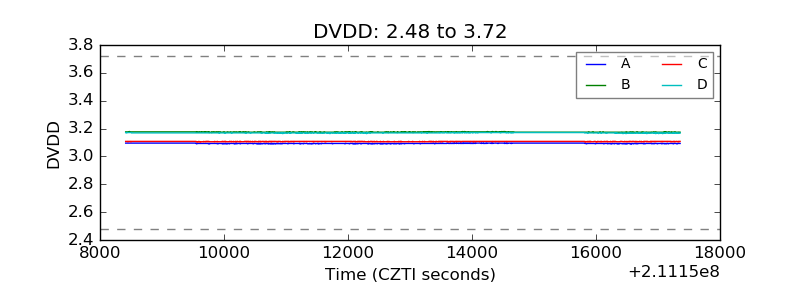 |
| Temperature 1 | 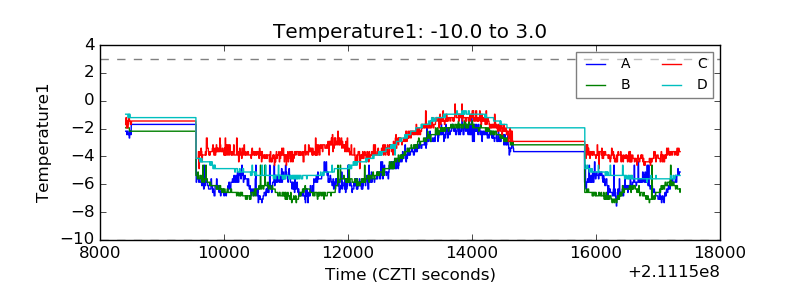 |
| Veto HV Monitor | 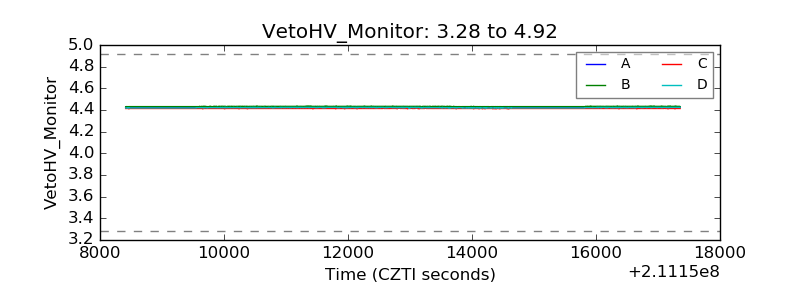 |
| Veto LLD | 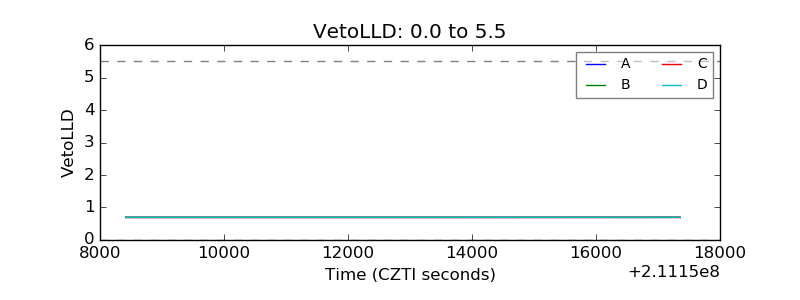 |
| Alpha Counter | 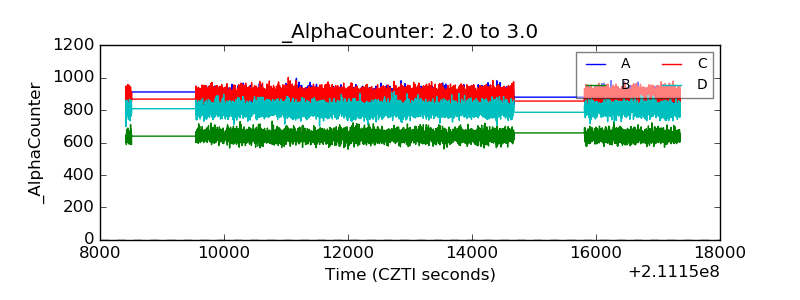 |
| _CPM_Rate | 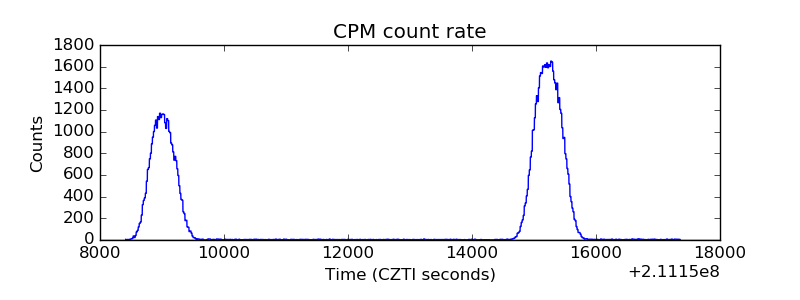 |
| CZT Counter | 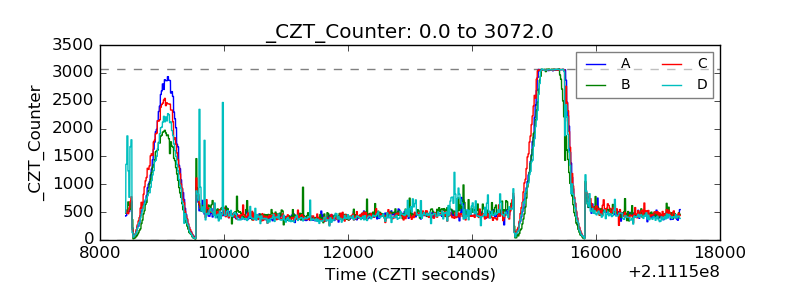 |
| +2.5 Volts monitor |  |
| +5 Volts monitor | 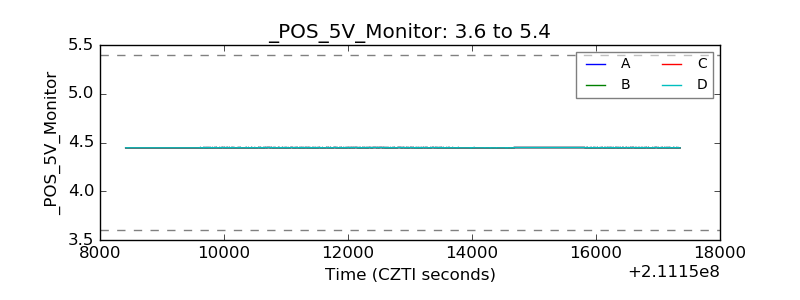 |
| _ROLL_ROT | 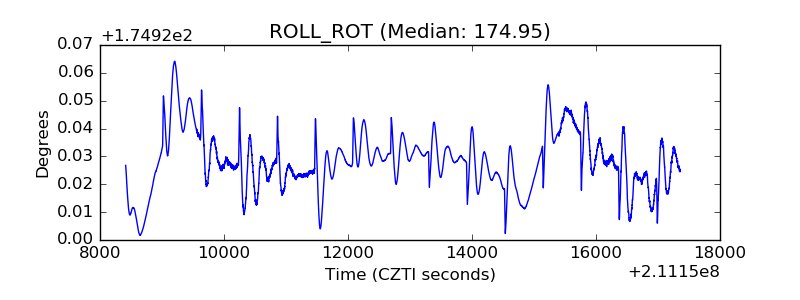 |
| _Roll_DEC | 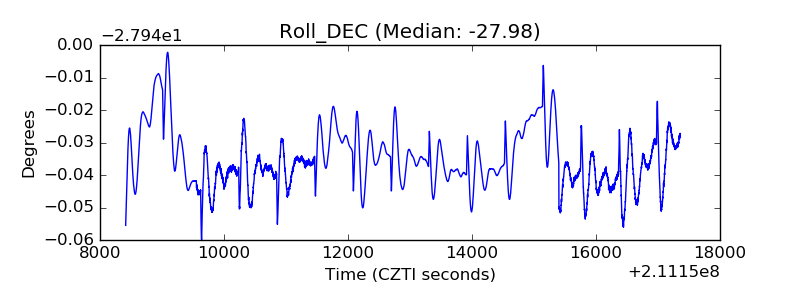 |
| _Roll_RA | 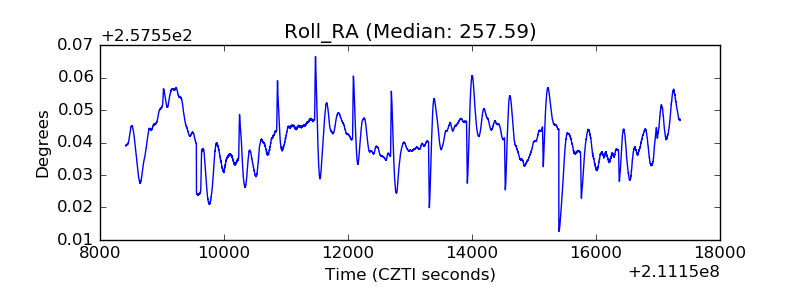 |
| Veto Counter | 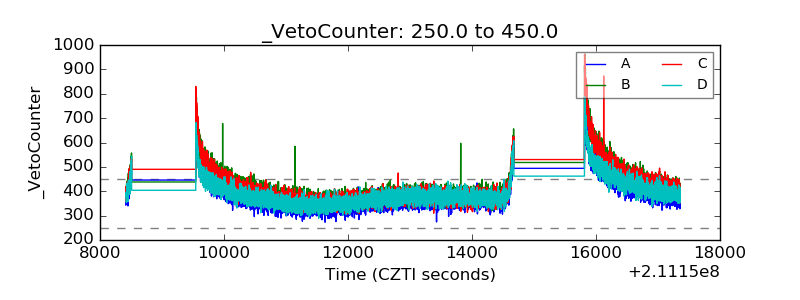 |