| Param | Original file | Final file |
|---|---|---|
| Filename | modeM0/AS1G05_102T01_9000000650_05151cztM0_level2.evt | modeM0/AS1G05_102T01_9000000650_05151cztM0_level2_quad_clean.evt |
| Size (bytes) | 448,997,760 | 56,416,320 |
| Size | 428.2 MB | 53.8 MB |
| Events in quadrant A | 3,062,651 | 317,382 |
| Events in quadrant B | 3,946,504 | 314,810 |
| Events in quadrant C | 3,123,657 | 317,602 |
| Events in quadrant D | 3,025,347 | 306,537 |
| Mode M0 | |||
|---|---|---|---|
| Quadrant | BADHDUFLAG | Total packets | Discarded packets |
| A | 0 | 13291 | 3 |
| B | 0 | 15772 | 2 |
| C | 0 | 13377 | 2 |
| D | 0 | 13474 | 2 |
| Mode M9 | |||
|---|---|---|---|
| Quadrant | BADHDUFLAG | Total packets | Discarded packets |
| A | 0 | 13 | 0 |
| B | 0 | 13 | 0 |
| C | 0 | 13 | 0 |
| D | 0 | 14 | 0 |
| Mode SS | |||
|---|---|---|---|
| Quadrant | BADHDUFLAG | Total packets | Discarded packets |
| A | 0 | 132 | 0 |
| B | 0 | 132 | 0 |
| C | 0 | 132 | 0 |
| D | 0 | 132 | 0 |
| Quadrant | Total seconds | Saturated seconds | Saturation percentage |
|---|---|---|---|
| A | 6468 | 37 | 0.572047% |
| B | 6468 | 197 | 3.045764% |
| C | 6468 | 50 | 0.773036% |
| D | 6468 | 40 | 0.618429% |
Noise dominated data is calculated using 1-second bins in cleaned event files. If a bin has >2000 counts, and if more than 50% of those come from <1% of pixels, then it is considered to be noise-dominated and hence unusable.
| Quadrant | # 1 sec bins | Bins with >0 counts | Bins with >2000 counts | High rate bins dominated by noise | Noise dominated (total time) | Noise dominated (detector-on time) | Marked lightcurve |
|---|---|---|---|---|---|---|---|
| A | 7698 | 6469 | 0 | 0 | 0.00% | 0.00% | 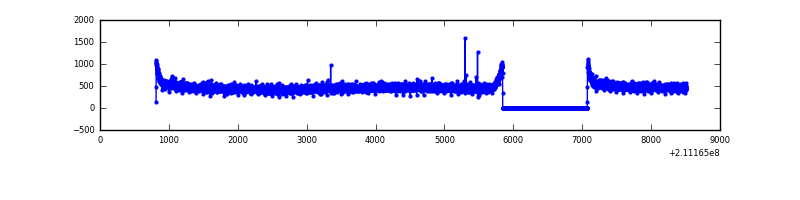 |
| B | 7698 | 6469 | 110 | 110 | 1.43% | 1.70% | 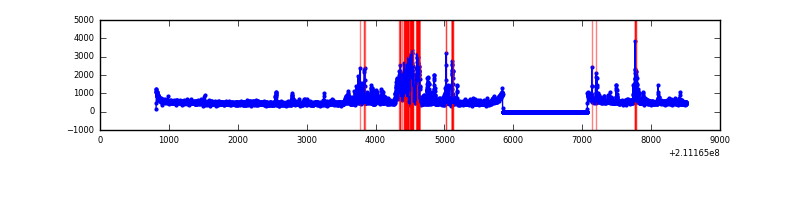 |
| C | 7698 | 6469 | 0 | 0 | 0.00% | 0.00% | 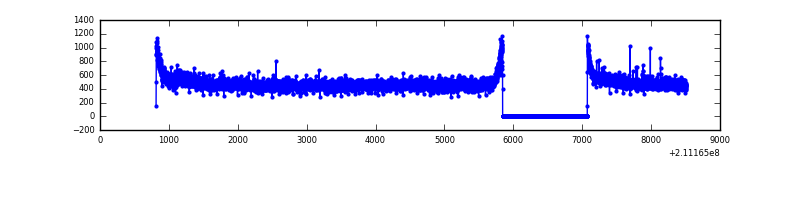 |
| D | 7698 | 6469 | 8 | 8 | 0.10% | 0.12% | 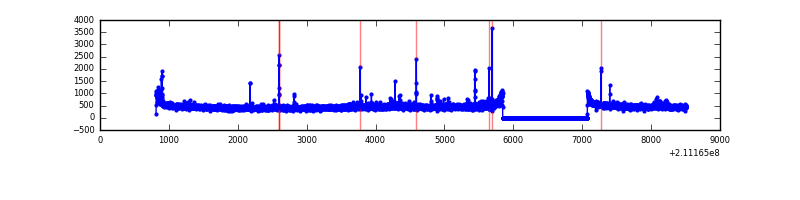 |
Top three noisy pixels from each quadrant. If the there are fewer than three noisy pixels in the level2.evt file, extra rows are filled as -1
| Pixel properties | Quadrant properties | ||||||
|---|---|---|---|---|---|---|---|
| Quadrant | DetID | PixID | Counts | Sigma | Mean | Median | Sigma |
| A | 12 | 194 | 7855 | 43.33 | 795 | 778 | 163.3 |
| A | 0 | 226 | 7787 | 42.91 | 795 | 778 | 163.3 |
| A | 0 | 50 | 6088 | 32.51 | 795 | 778 | 163.3 |
| B | 8 | 3 | 649578 | 4291.73 | 804 | 789 | 151.2 |
| B | 7 | 252 | 48382 | 314.83 | 804 | 789 | 151.2 |
| B | 0 | 219 | 37124 | 240.36 | 804 | 789 | 151.2 |
| C | 1 | 16 | 96183 | 528.0 | 776 | 780 | 180.7 |
| C | 13 | 61 | 6222 | 30.12 | 776 | 780 | 180.7 |
| C | 3 | 202 | 1940 | 6.42 | 776 | 780 | 180.7 |
| D | 10 | 15 | 28254 | 145.75 | 769 | 745 | 188.7 |
| D | 2 | 136 | 24627 | 126.53 | 769 | 745 | 188.7 |
| D | 2 | 14 | 23495 | 120.53 | 769 | 745 | 188.7 |
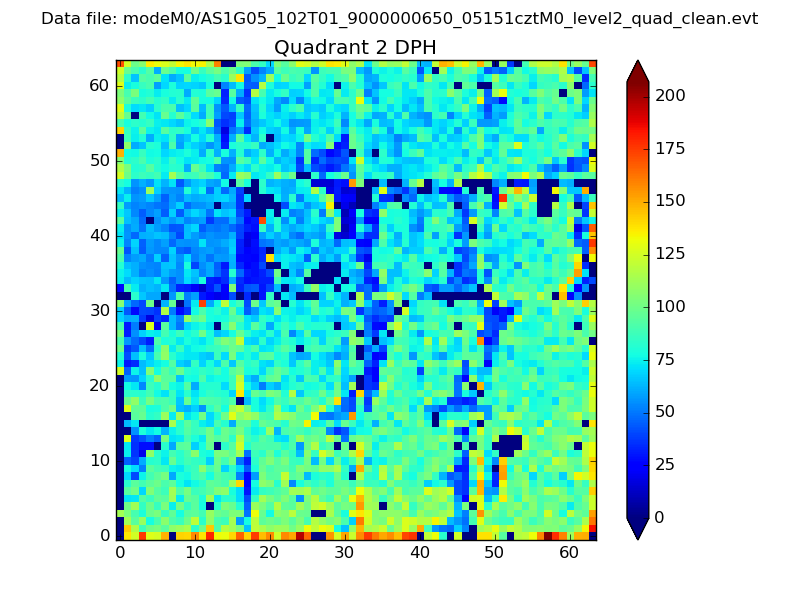
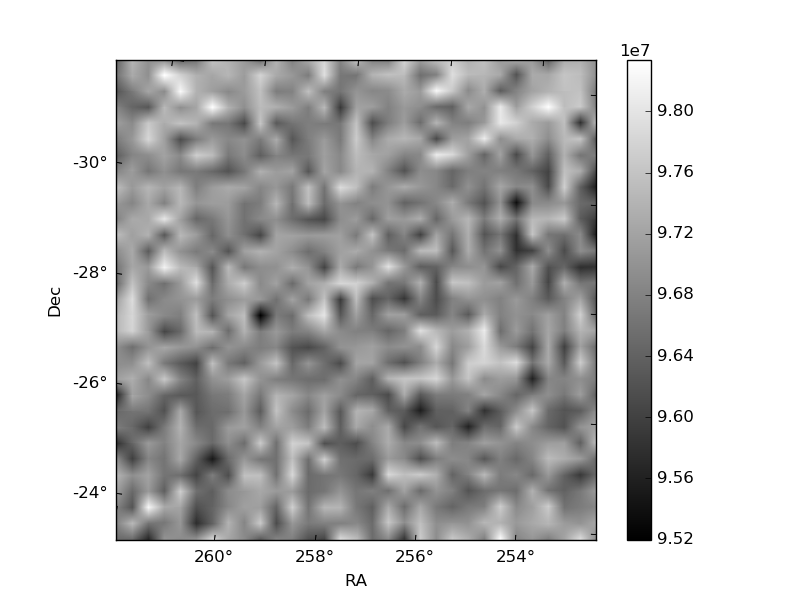
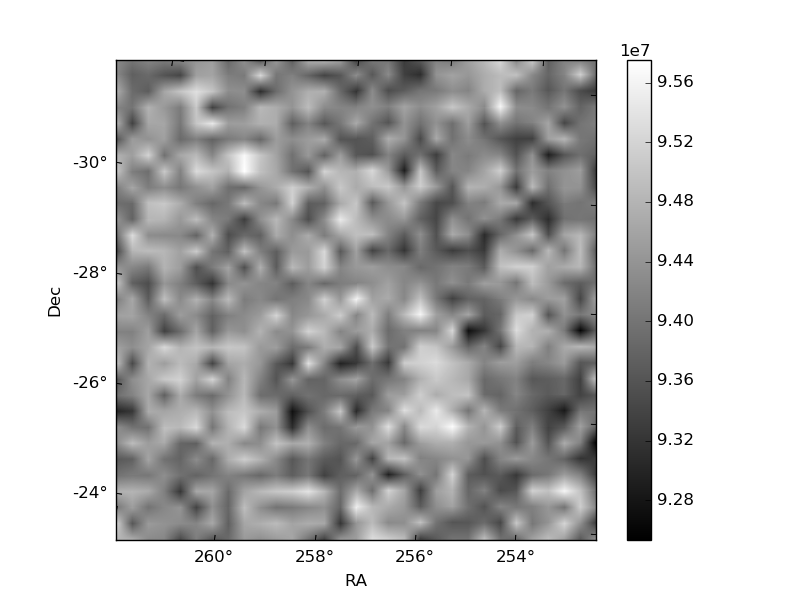
Histogram calculated using DETX and DETY for each event in the final _common_clean file
| Quadrant A | 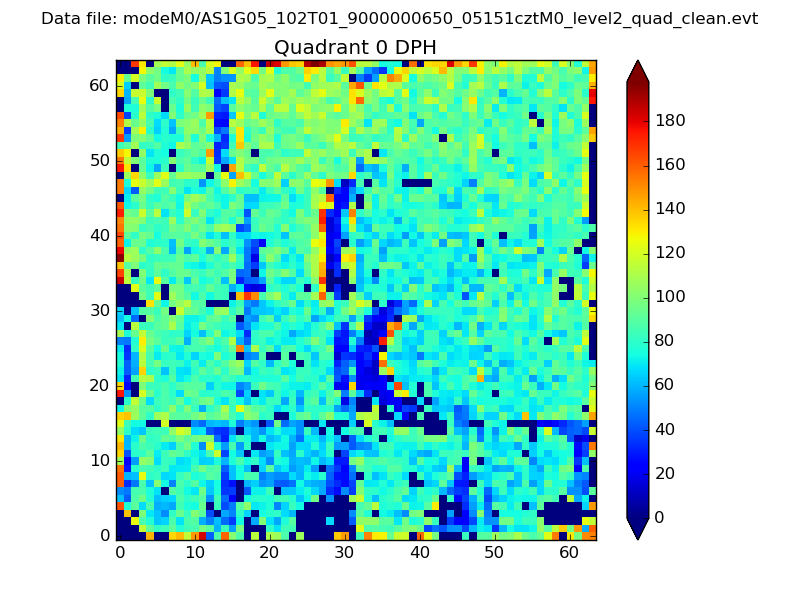 |
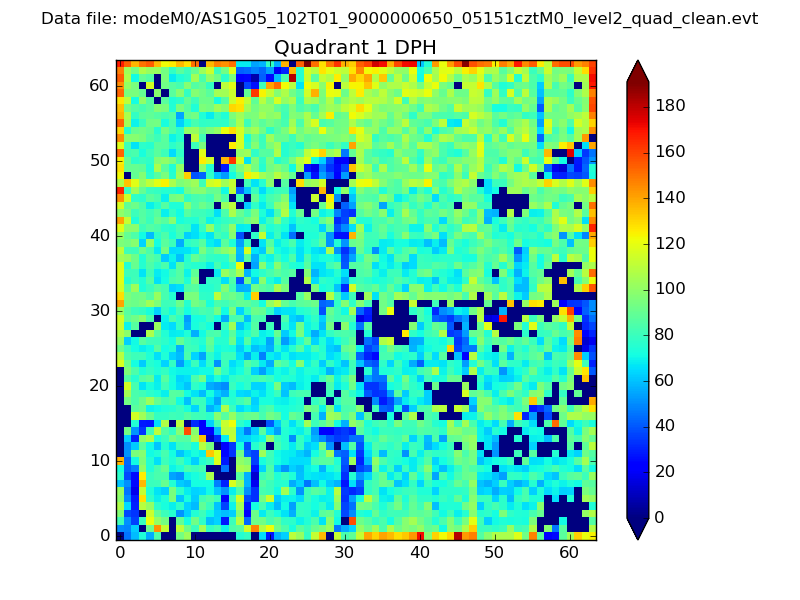 |
Quadrant B |
|---|---|---|---|
| Quadrant D | 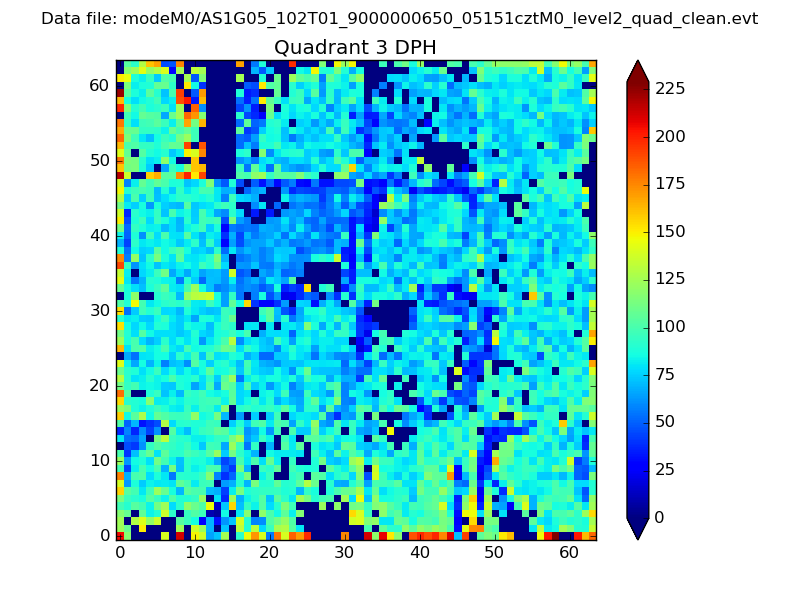 |
 |
Quadrant C |
| Plot type | Count rate plots | Images |
|---|---|---|
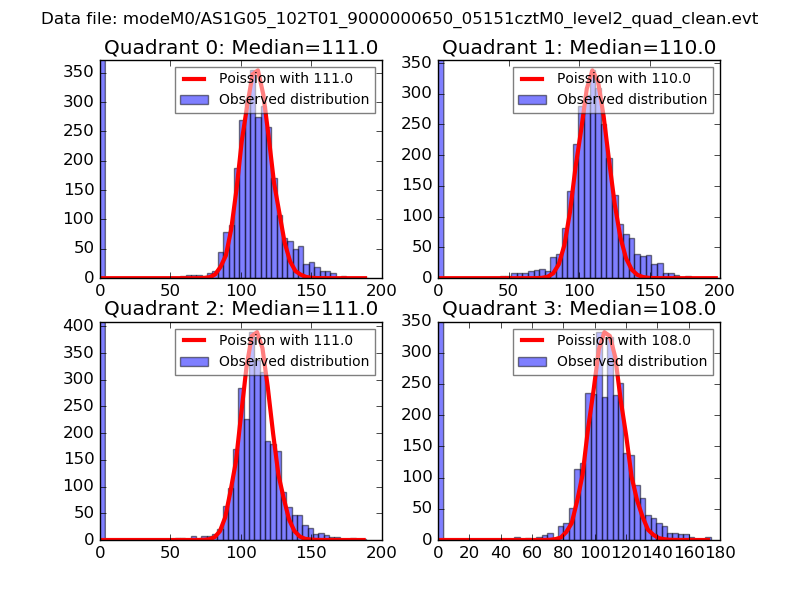
| Comparison with Poisson distribution Blue bars denote a histogram of data divided into 1 sec bins. Red curve is a Poisson curve with rate = median count rate of data. |
 |
 |
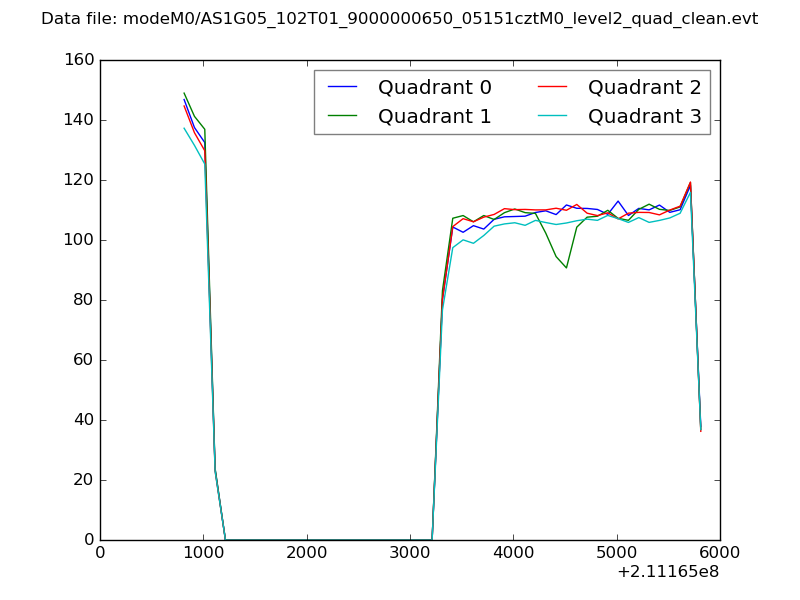
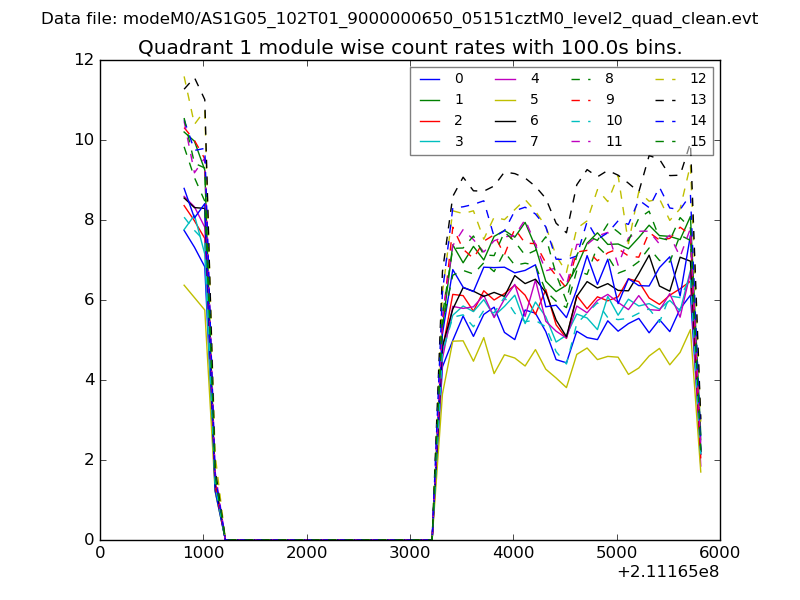
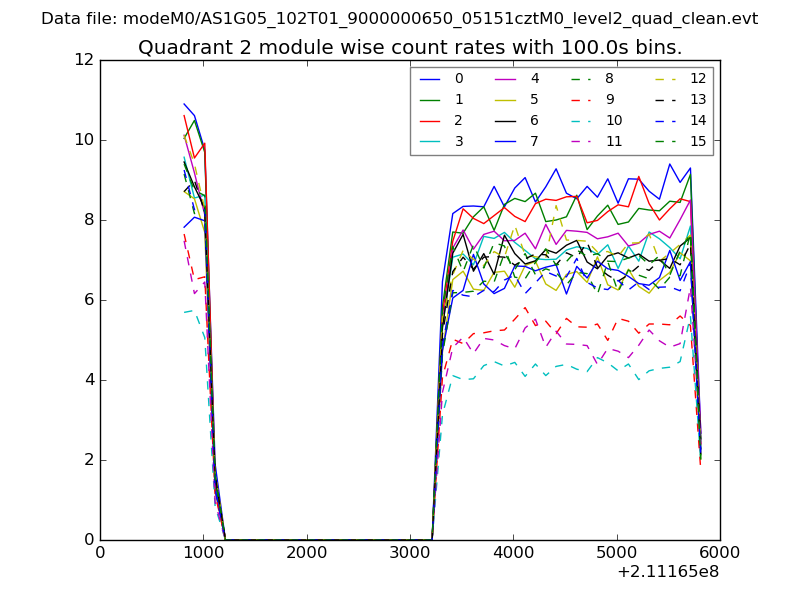
| Quadrant-wise count rates Data is divided into 100 sec bins |
 |
|
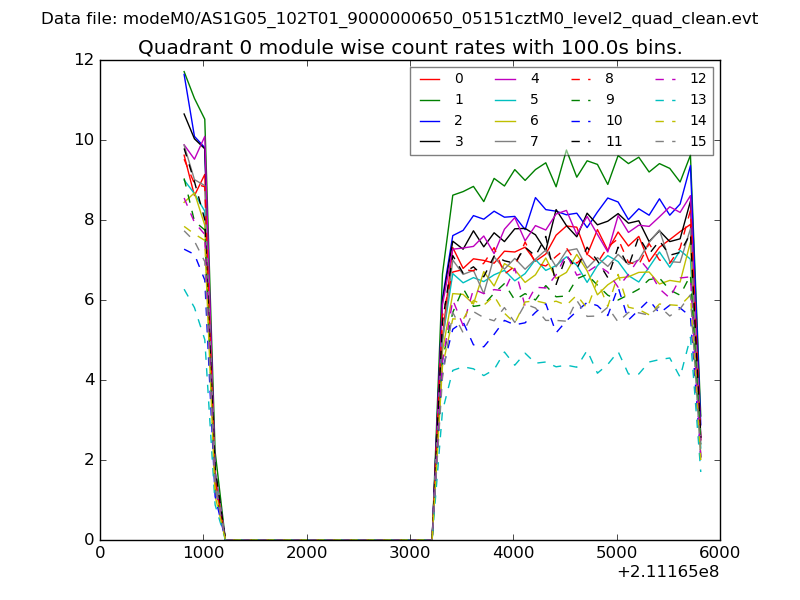
| Module-wise count rates for Quadrant A Data is divided into 100 sec bins |
 |
 |
| Module-wise count rates for Quadrant B Data is divided into 100 sec bins |
 |
 |
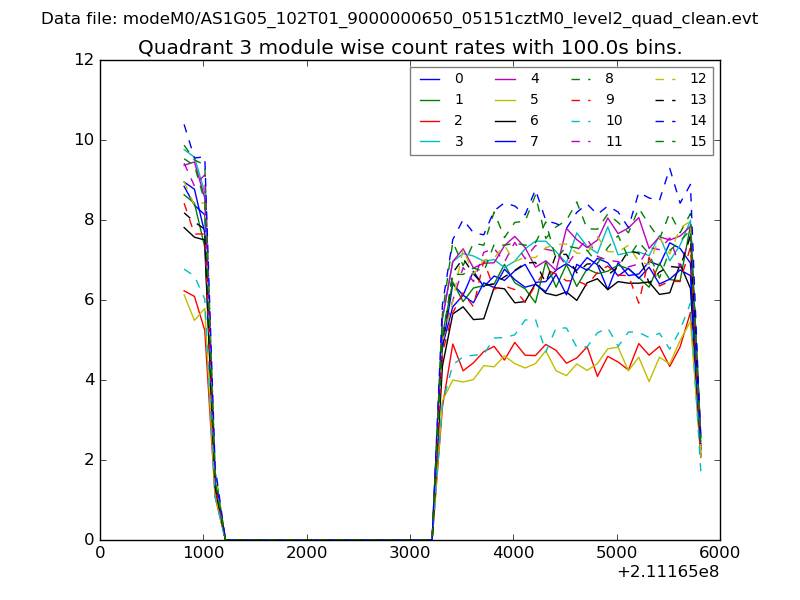
| Module-wise count rates for Quadrant C Data is divided into 100 sec bins |
 |
 |
| Module-wise count rates for Quadrant D Data is divided into 100 sec bins |
 |
 |
| Parameter | Plot |
|---|---|
| CZT HV Monitor | 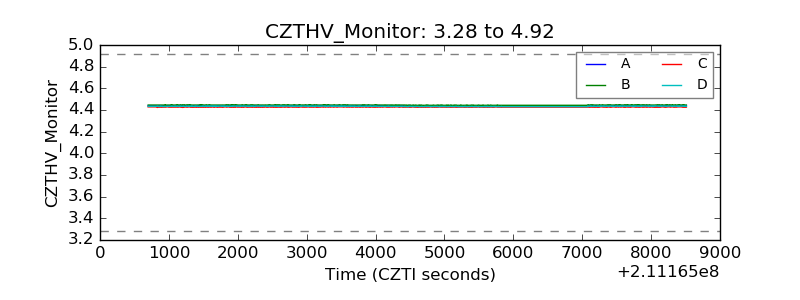 |
| D_VDD | 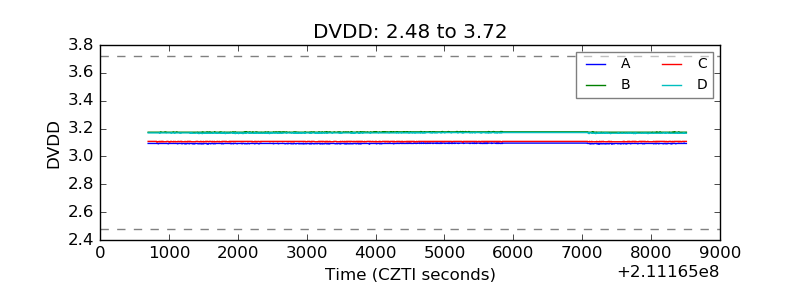 |
| Temperature 1 | 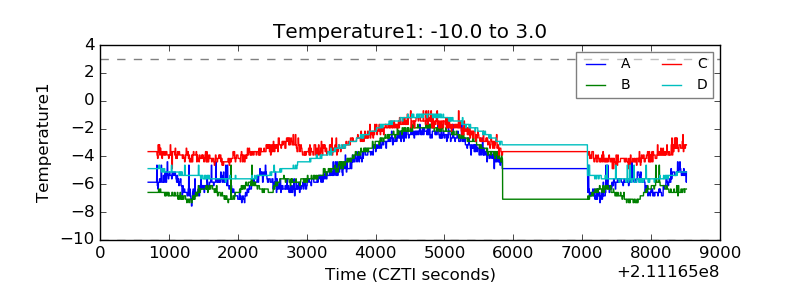 |
| Veto HV Monitor | 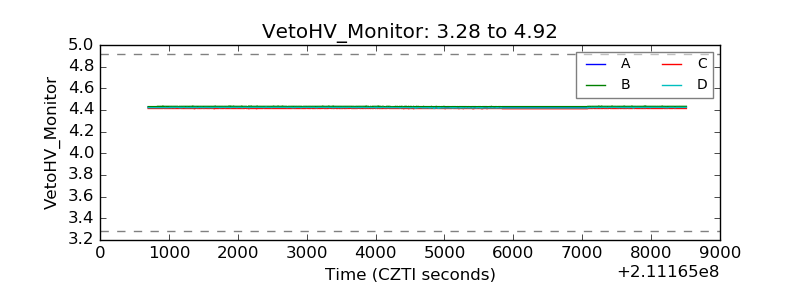 |
| Veto LLD | 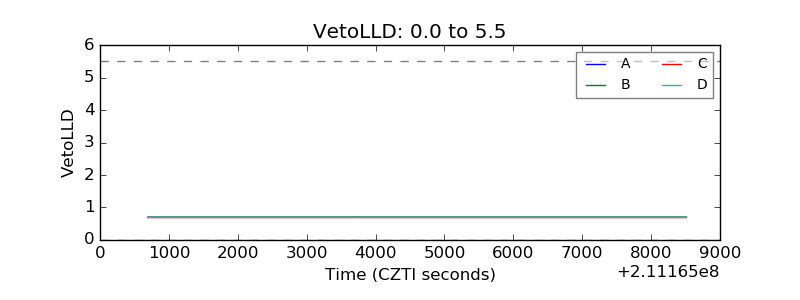 |
| Alpha Counter | 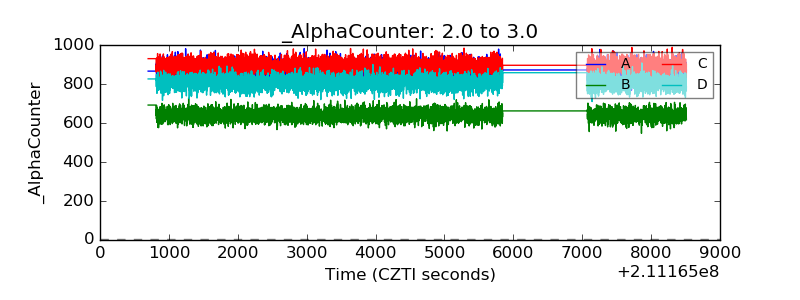 |
| _CPM_Rate | 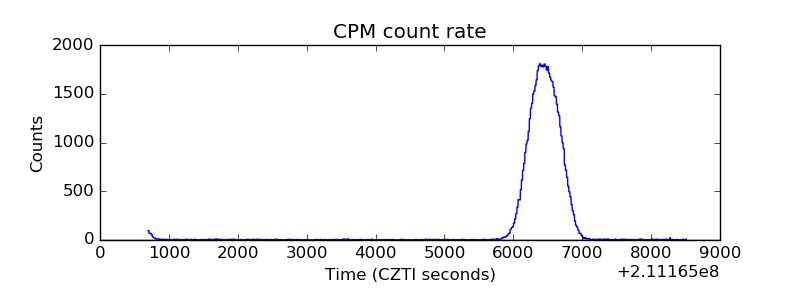 |
| CZT Counter | 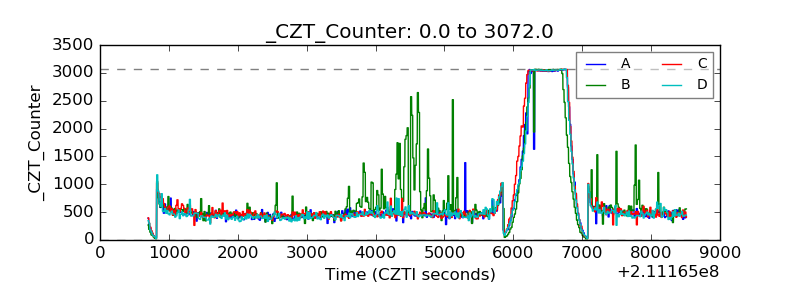 |
| +2.5 Volts monitor | 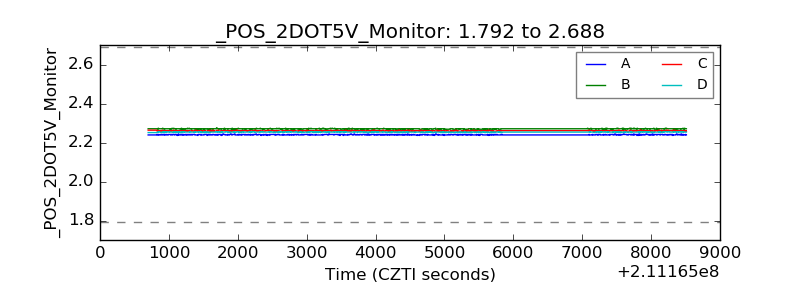 |
| +5 Volts monitor |  |
| _ROLL_ROT | 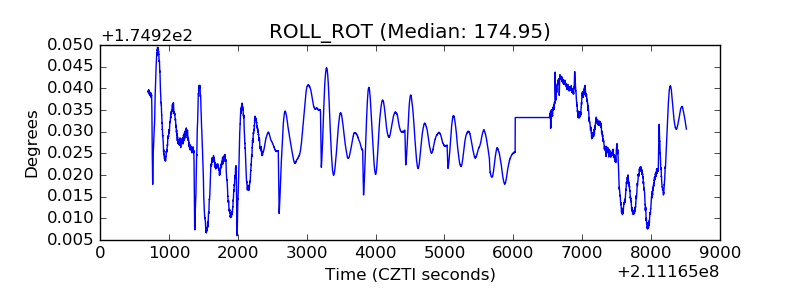 |
| _Roll_DEC | 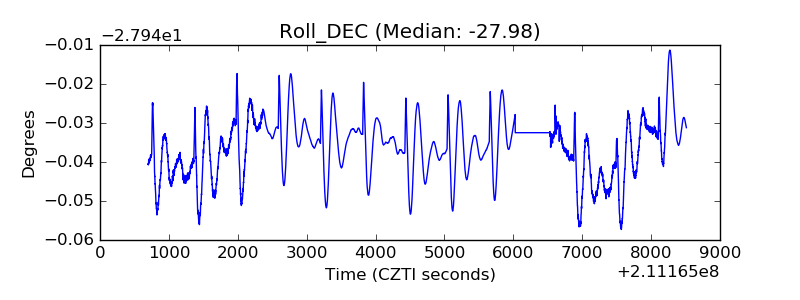 |
| _Roll_RA | 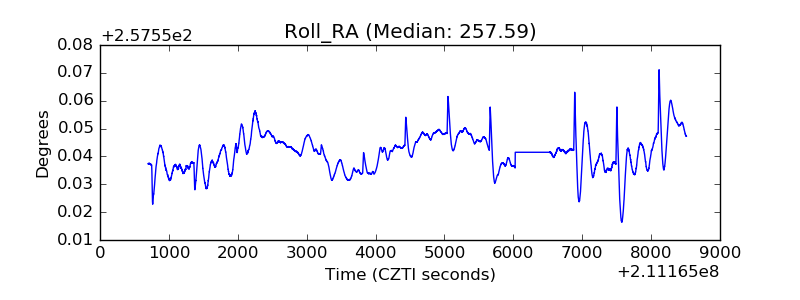 |
| Veto Counter | 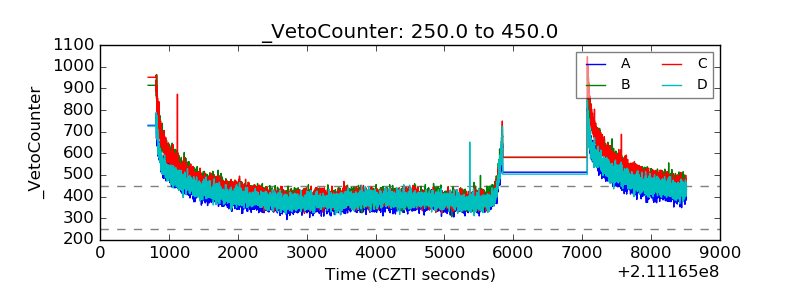 |