| Param | Original file | Final file |
|---|---|---|
| Filename | modeM0/AS1G05_102T01_9000000650_05152cztM0_level2.evt | modeM0/AS1G05_102T01_9000000650_05152cztM0_level2_quad_clean.evt |
| Size (bytes) | 453,504,960 | 56,603,520 |
| Size | 432.5 MB | 54.0 MB |
| Events in quadrant A | 3,111,810 | 320,959 |
| Events in quadrant B | 3,822,474 | 319,894 |
| Events in quadrant C | 3,197,770 | 322,989 |
| Events in quadrant D | 3,173,128 | 308,917 |
| Mode M0 | |||
|---|---|---|---|
| Quadrant | BADHDUFLAG | Total packets | Discarded packets |
| A | 0 | 13136 | 3 |
| B | 0 | 15233 | 2 |
| C | 0 | 13595 | 2 |
| D | 0 | 13503 | 2 |
| Mode M9 | |||
|---|---|---|---|
| Quadrant | BADHDUFLAG | Total packets | Discarded packets |
| A | 0 | 17 | 0 |
| B | 0 | 17 | 0 |
| C | 0 | 17 | 0 |
| D | 0 | 18 | 0 |
| Mode SS | |||
|---|---|---|---|
| Quadrant | BADHDUFLAG | Total packets | Discarded packets |
| A | 0 | 128 | 0 |
| B | 0 | 128 | 0 |
| C | 0 | 128 | 0 |
| D | 0 | 128 | 0 |
| Quadrant | Total seconds | Saturated seconds | Saturation percentage |
|---|---|---|---|
| A | 6318 | 72 | 1.139601% |
| B | 6318 | 128 | 2.025958% |
| C | 6318 | 76 | 1.202912% |
| D | 6318 | 70 | 1.107946% |
Noise dominated data is calculated using 1-second bins in cleaned event files. If a bin has >2000 counts, and if more than 50% of those come from <1% of pixels, then it is considered to be noise-dominated and hence unusable.
| Quadrant | # 1 sec bins | Bins with >0 counts | Bins with >2000 counts | High rate bins dominated by noise | Noise dominated (total time) | Noise dominated (detector-on time) | Marked lightcurve |
|---|---|---|---|---|---|---|---|
| A | 7584 | 6319 | 3 | 3 | 0.04% | 0.05% | 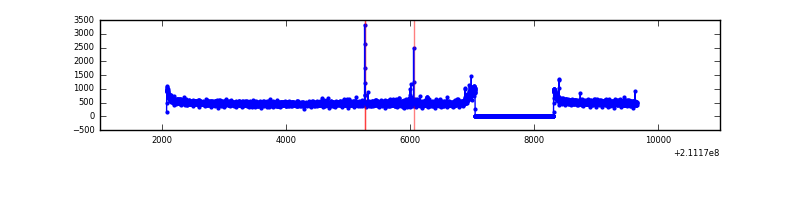 |
| B | 7584 | 6319 | 17 | 17 | 0.22% | 0.27% | 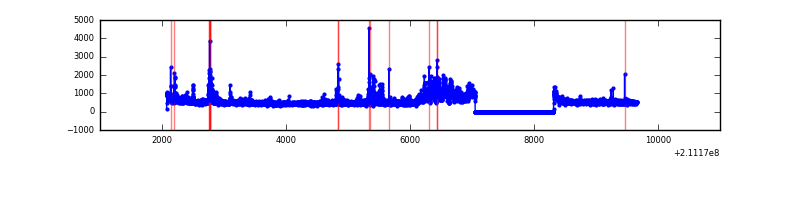 |
| C | 7584 | 6319 | 0 | 0 | 0.00% | 0.00% | 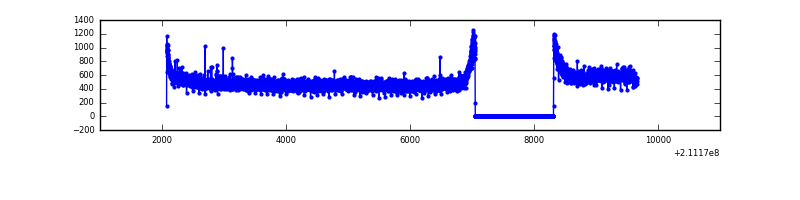 |
| D | 7584 | 6319 | 7 | 7 | 0.09% | 0.11% | 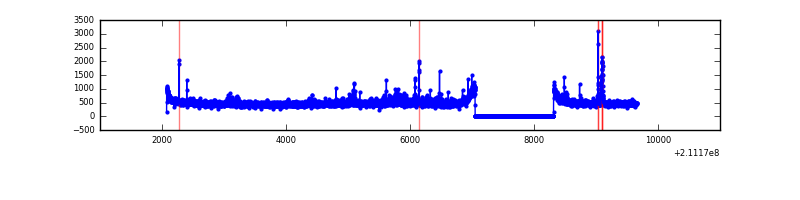 |
Top three noisy pixels from each quadrant. If the there are fewer than three noisy pixels in the level2.evt file, extra rows are filled as -1
| Pixel properties | Quadrant properties | ||||||
|---|---|---|---|---|---|---|---|
| Quadrant | DetID | PixID | Counts | Sigma | Mean | Median | Sigma |
| A | 0 | 50 | 24948 | 147.49 | 802 | 784 | 163.8 |
| A | 12 | 194 | 7945 | 43.71 | 802 | 784 | 163.8 |
| A | 0 | 226 | 7746 | 42.49 | 802 | 784 | 163.8 |
| B | 8 | 3 | 363603 | 2365.01 | 810 | 794 | 153.4 |
| B | 4 | 80 | 122525 | 793.52 | 810 | 794 | 153.4 |
| B | 15 | 204 | 87073 | 562.42 | 810 | 794 | 153.4 |
| C | 1 | 16 | 149346 | 827.31 | 781 | 785 | 179.6 |
| C | 13 | 61 | 6369 | 31.1 | 781 | 785 | 179.6 |
| C | 3 | 202 | 1983 | 6.67 | 781 | 785 | 179.6 |
| D | 8 | 195 | 64175 | 331.51 | 778 | 754 | 191.3 |
| D | 10 | 15 | 51355 | 264.49 | 778 | 754 | 191.3 |
| D | 2 | 33 | 40120 | 205.77 | 778 | 754 | 191.3 |
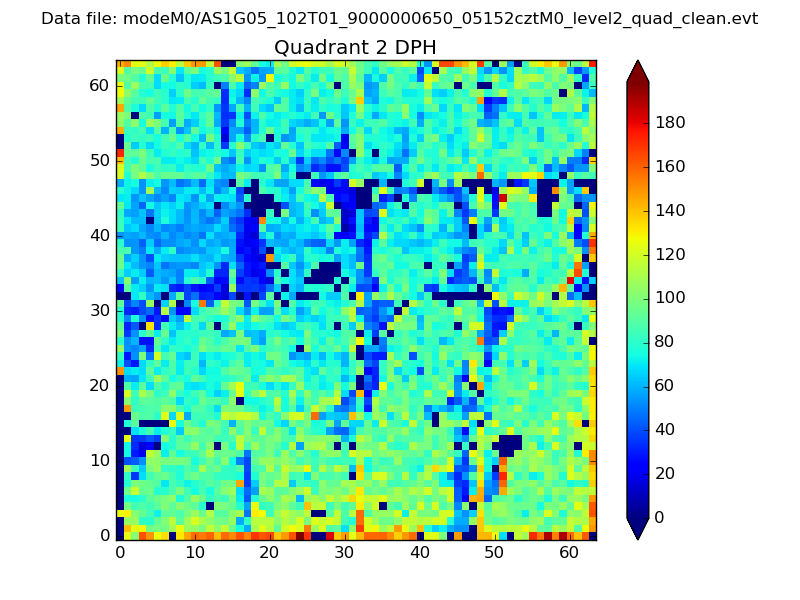
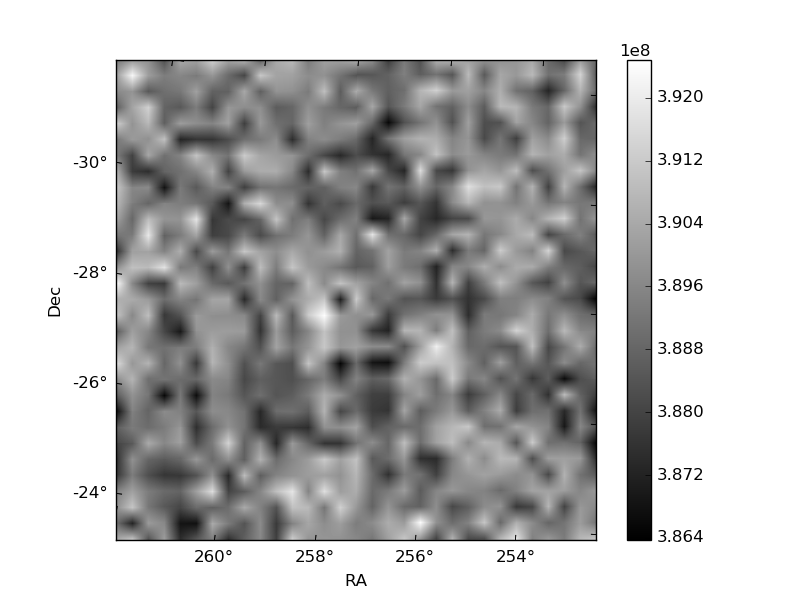
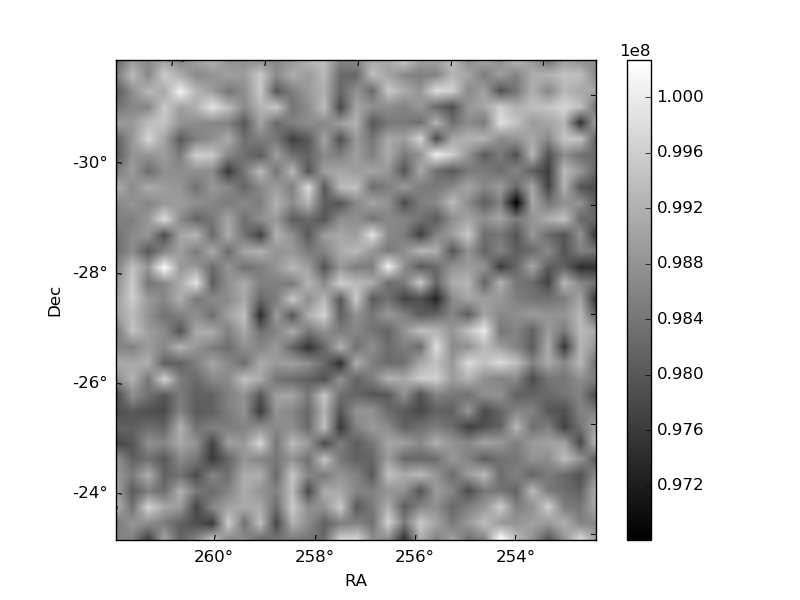
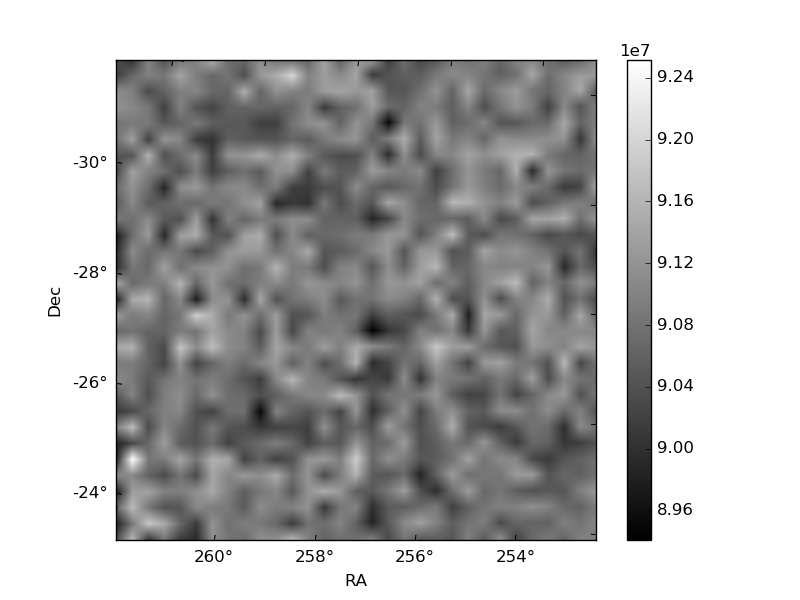
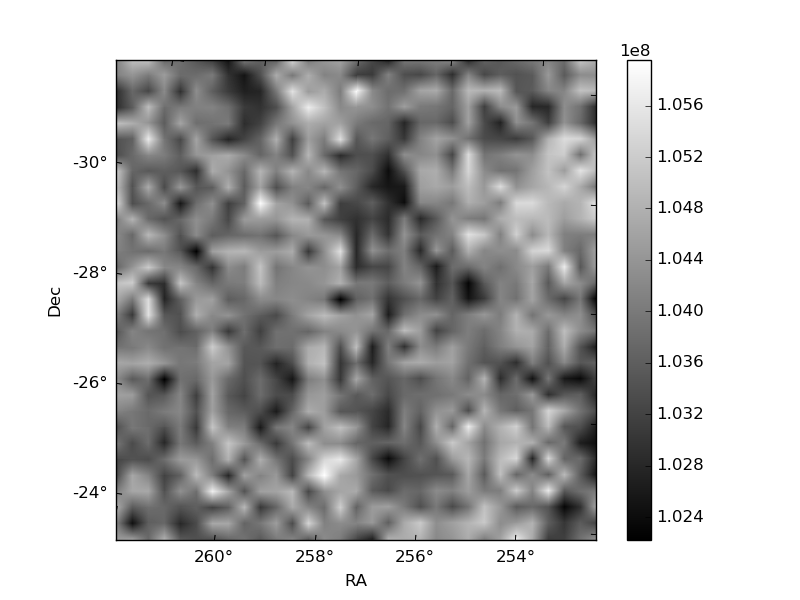
Histogram calculated using DETX and DETY for each event in the final _common_clean file
| Quadrant A | 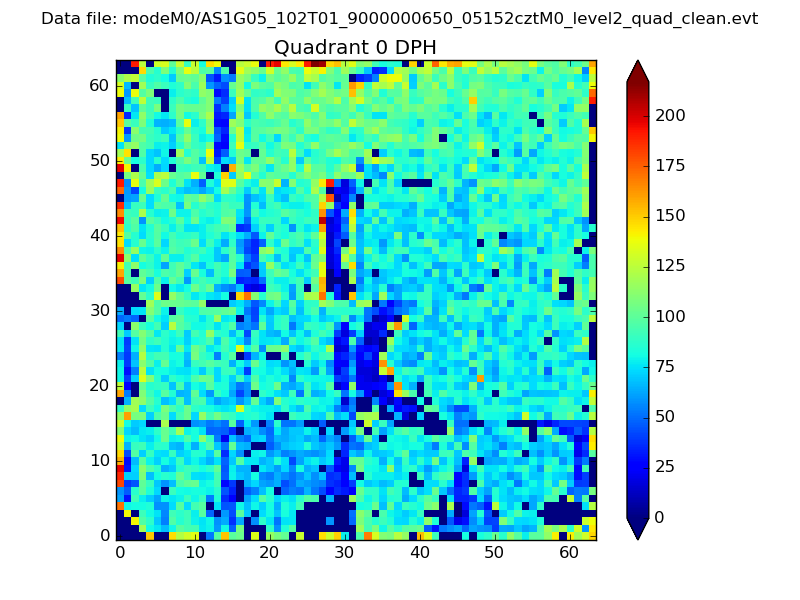 |
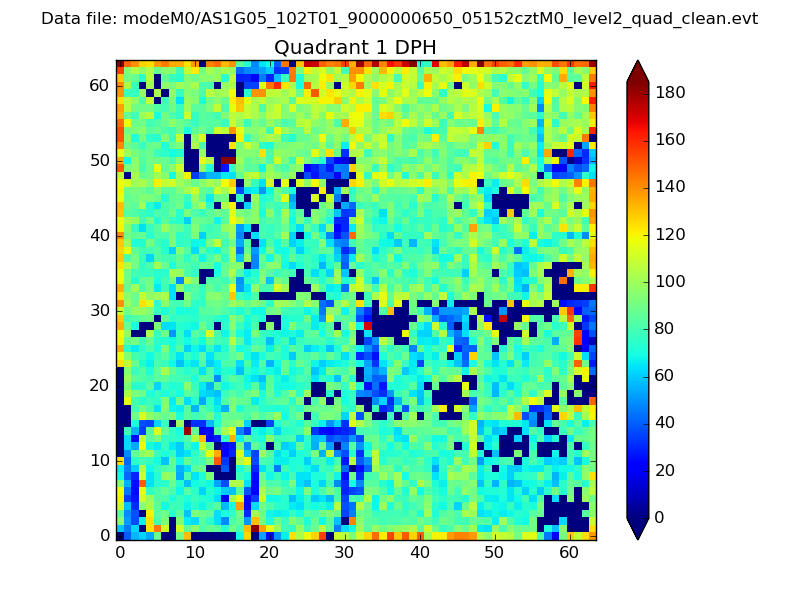 |
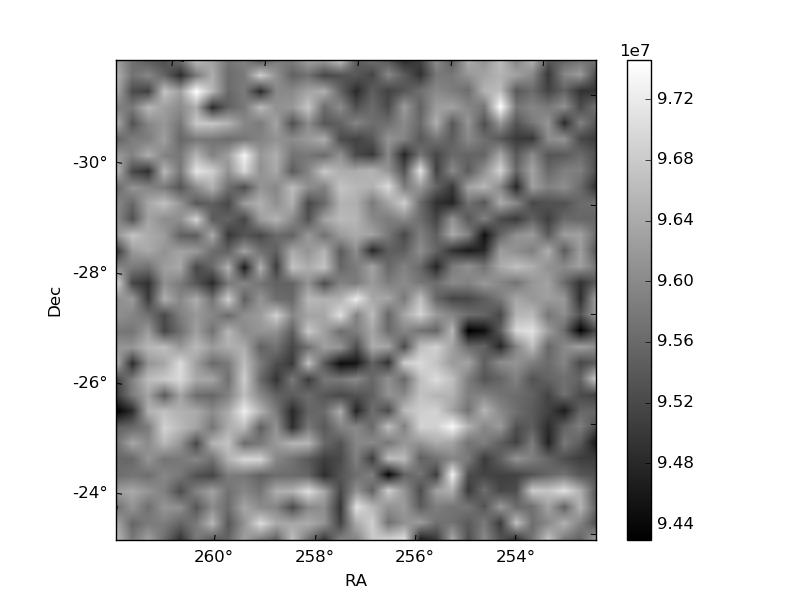
Quadrant B |
|---|---|---|---|
| Quadrant D | 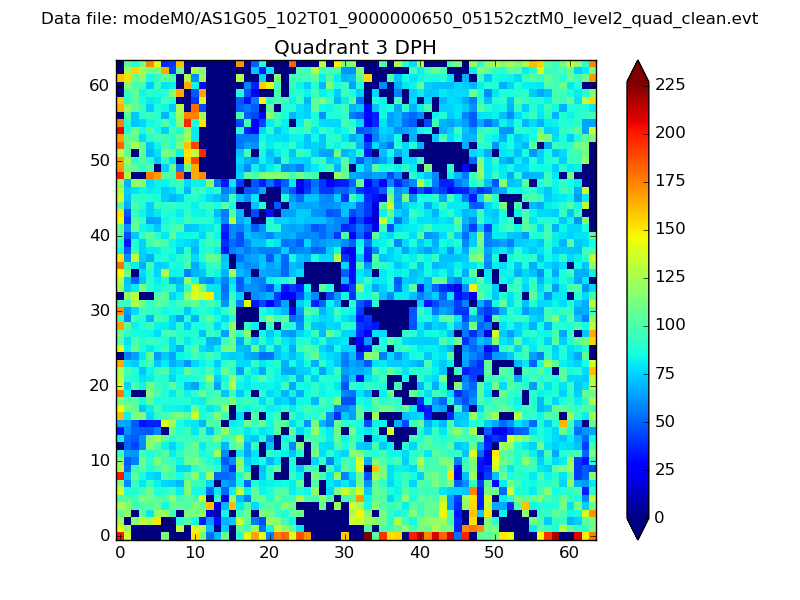 |
 |
Quadrant C |
| Plot type | Count rate plots | Images |
|---|---|---|
| Comparison with Poisson distribution Blue bars denote a histogram of data divided into 1 sec bins. Red curve is a Poisson curve with rate = median count rate of data. |
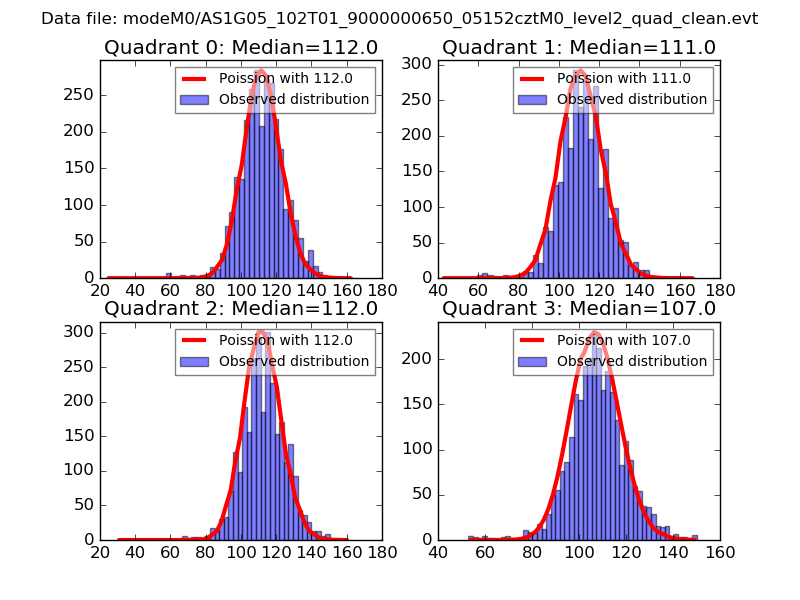 |
 |
| Quadrant-wise count rates Data is divided into 100 sec bins |
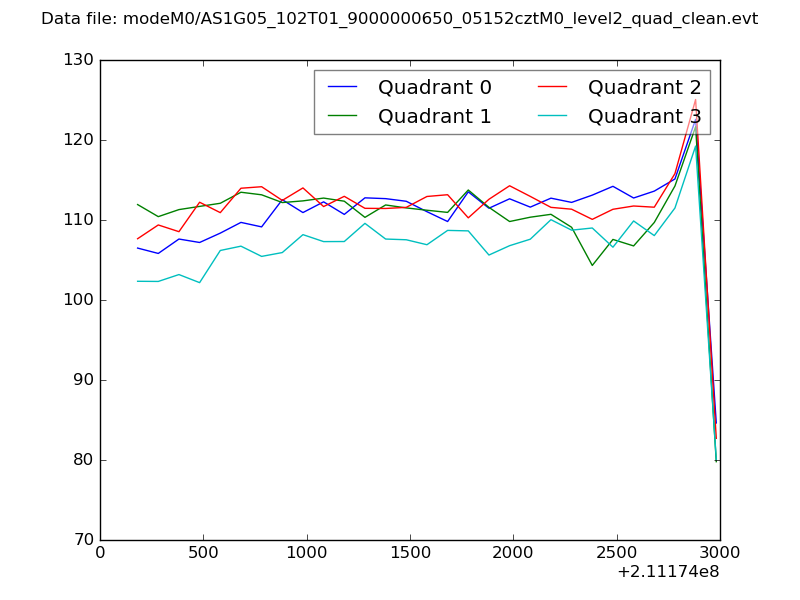 |
|
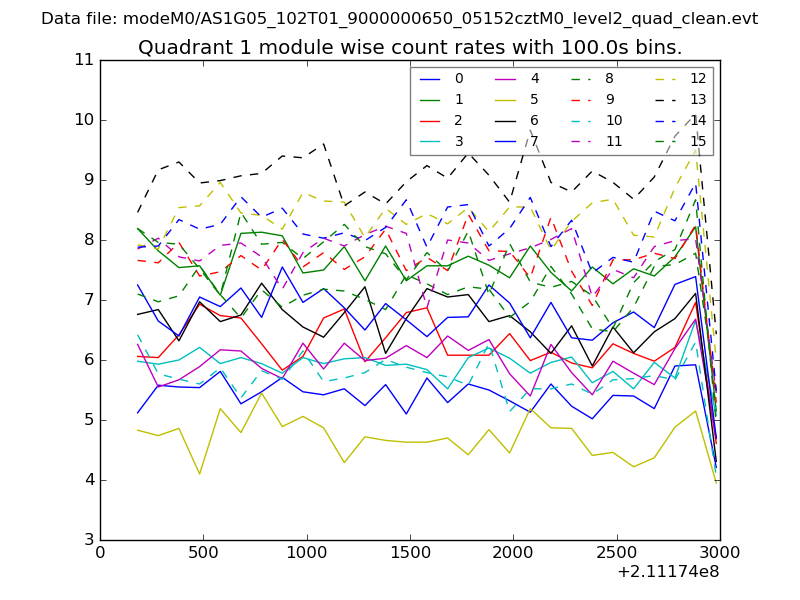
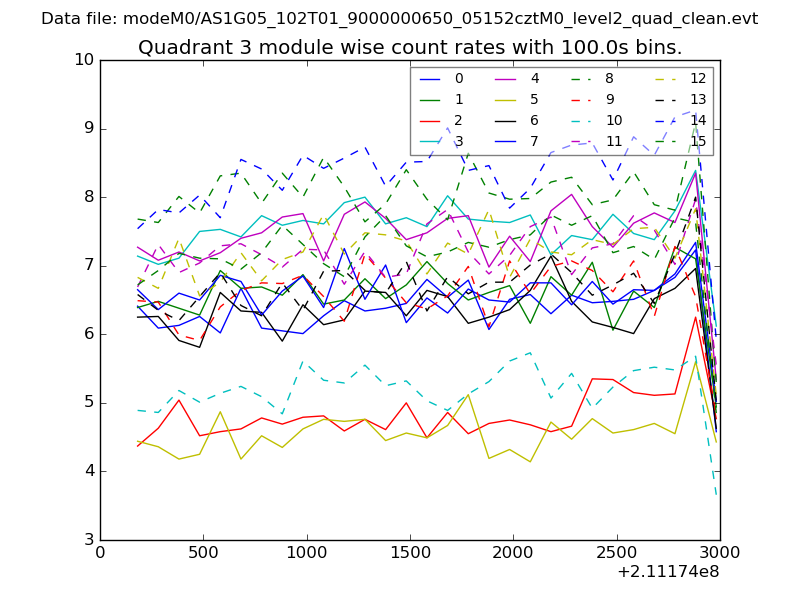
| Module-wise count rates for Quadrant A Data is divided into 100 sec bins |
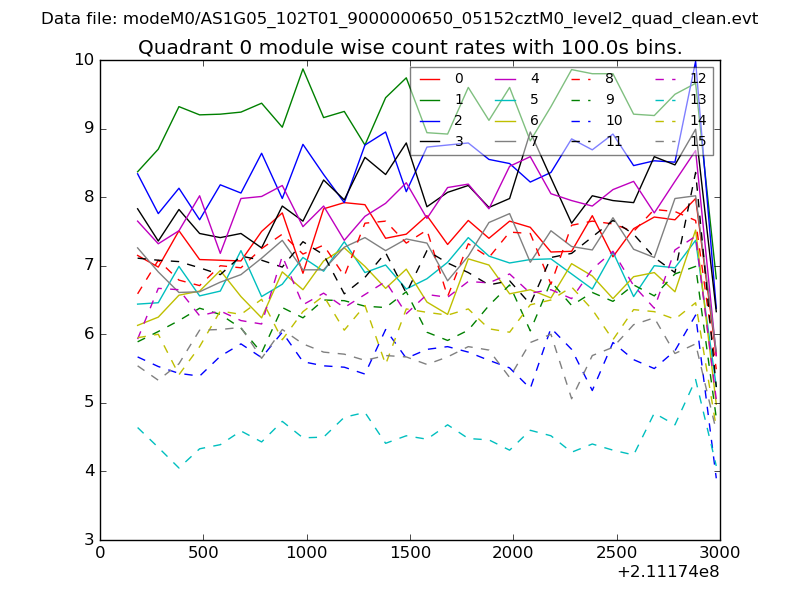 |
 |
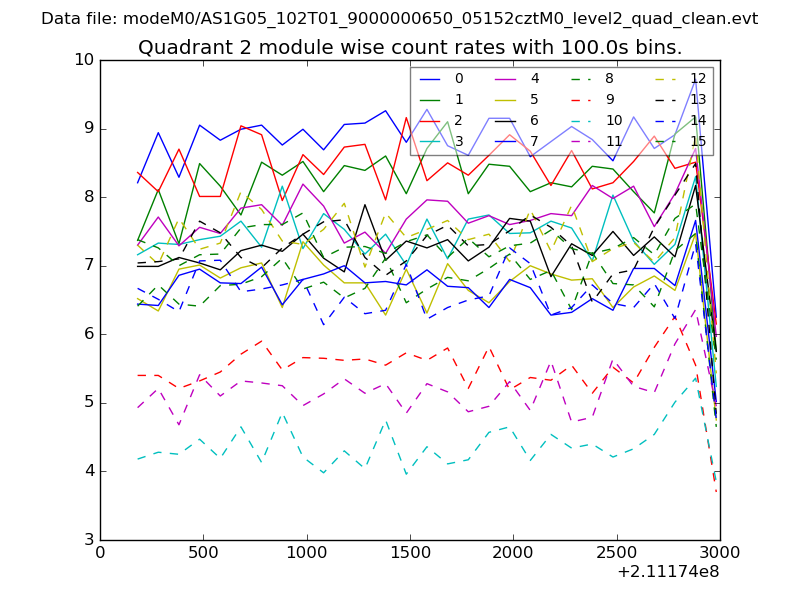
| Module-wise count rates for Quadrant B Data is divided into 100 sec bins |
 |
 |
| Module-wise count rates for Quadrant C Data is divided into 100 sec bins |
 |
 |
| Module-wise count rates for Quadrant D Data is divided into 100 sec bins |
 |
 |
| Parameter | Plot |
|---|---|
| CZT HV Monitor | 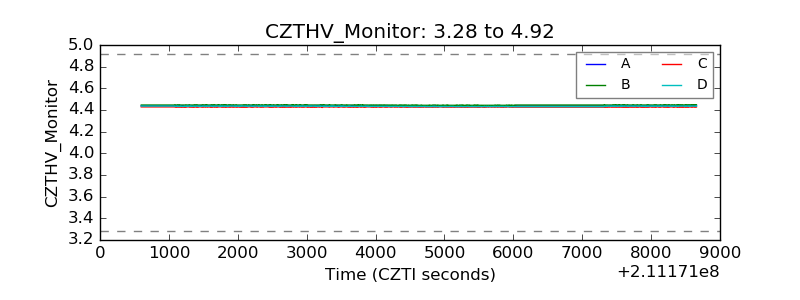 |
| D_VDD | 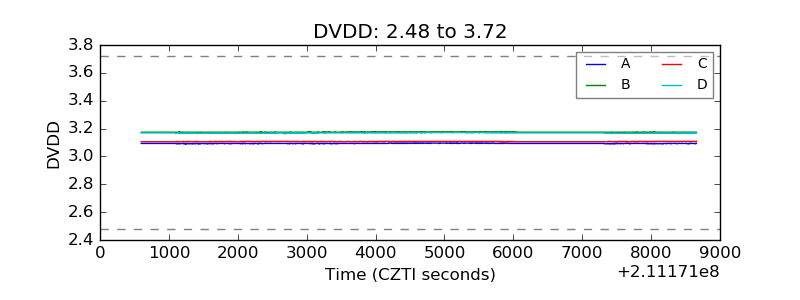 |
| Temperature 1 | 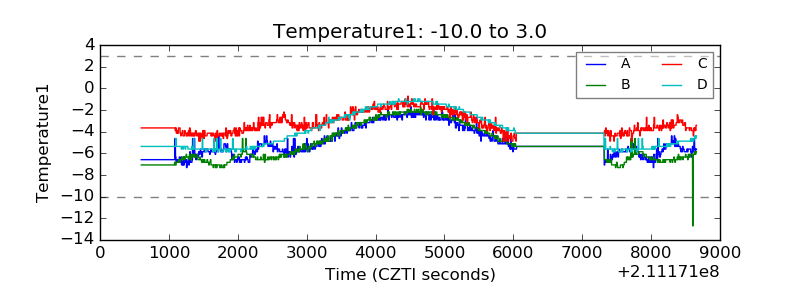 |
| Veto HV Monitor | 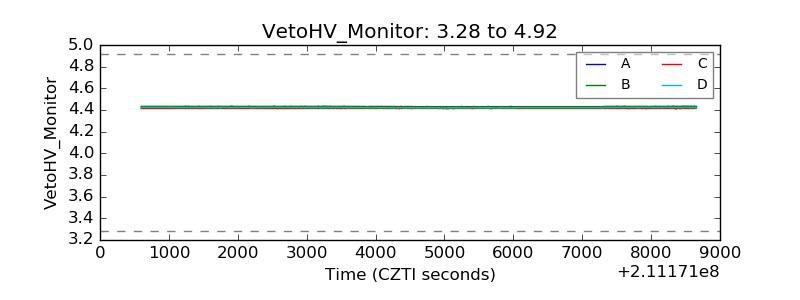 |
| Veto LLD | 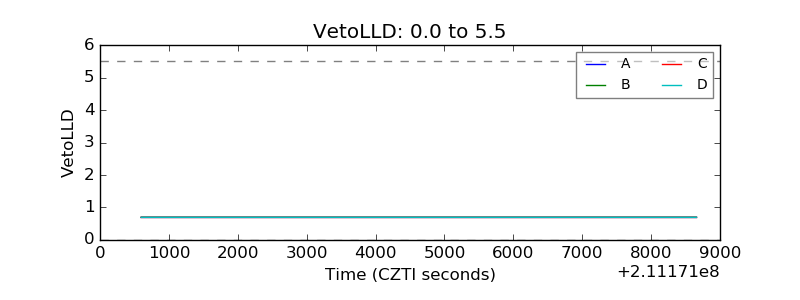 |
| Alpha Counter | 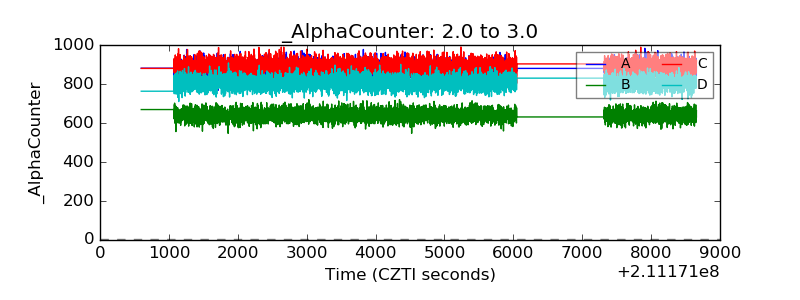 |
| _CPM_Rate | 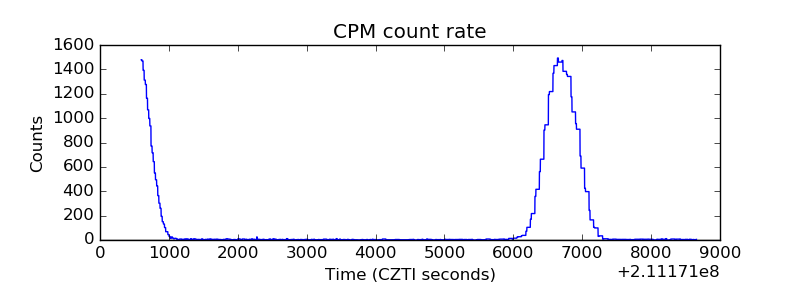 |
| CZT Counter | 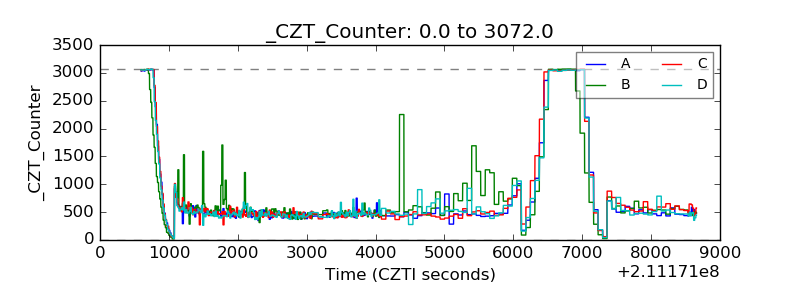 |
| +2.5 Volts monitor | 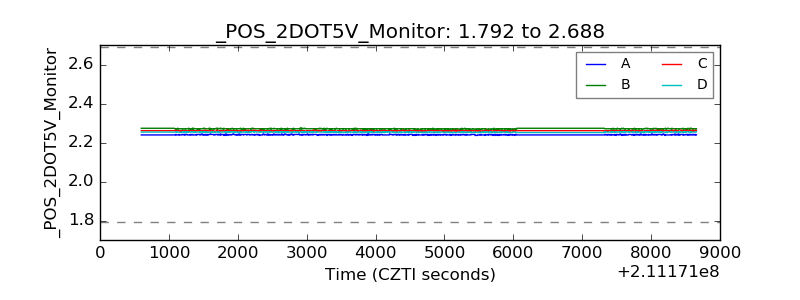 |
| +5 Volts monitor | 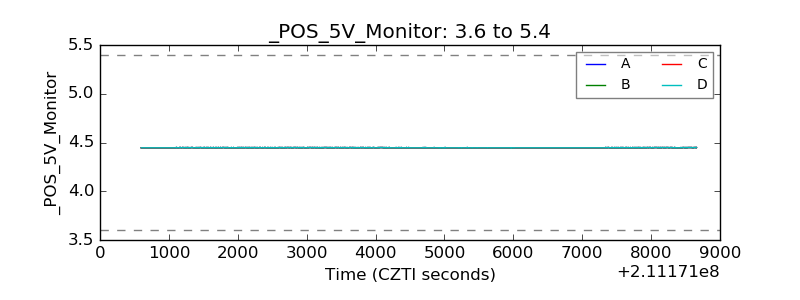 |
| _ROLL_ROT | 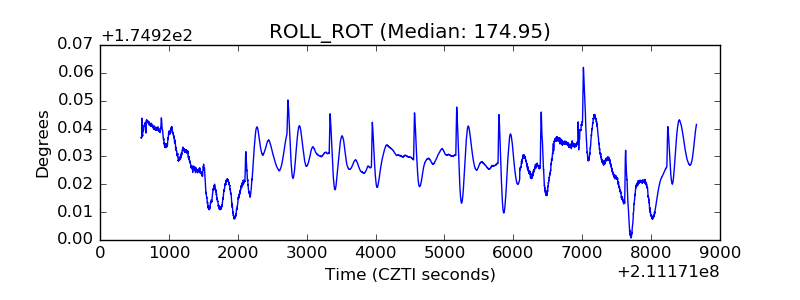 |
| _Roll_DEC | 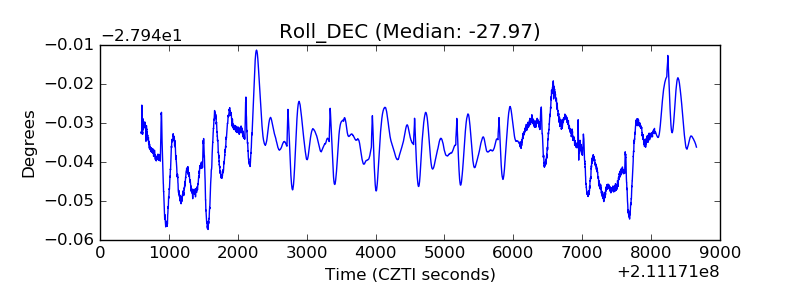 |
| _Roll_RA | 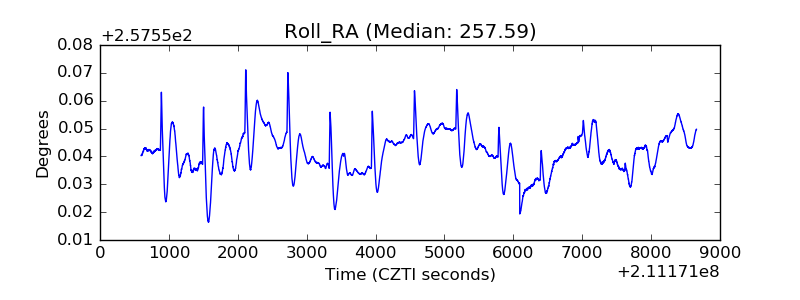 |
| Veto Counter | 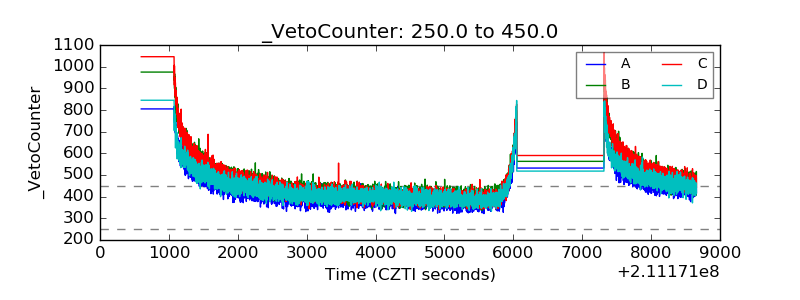 |