| Param | Original file | Final file |
|---|---|---|
| Filename | modeM0/AS1G05_214T01_9000000652cztM0_level2.fits | modeM0/AS1G05_214T01_9000000652cztM0_level2_quad_clean.evt |
| Size (bytes) | 1,521,452,160 | 1,508,604,480 |
| Size | 1.4 GB | 1.4 GB |
| Events in quadrant A | 9,135,712 | 8,907,946 |
| Events in quadrant B | 8,912,954 | 8,984,662 |
| Events in quadrant C | 9,041,854 | 8,774,268 |
| Events in quadrant D | 7,774,014 | 7,813,657 |
| Mode SS | |||
|---|---|---|---|
| Quadrant | BADHDUFLAG | Total packets | Discarded packets |
| A | 0 | 3332 | 0 |
| B | 0 | 3332 | 0 |
| C | 0 | 3330 | 0 |
| D | 0 | 3332 | 0 |
| Mode M9 | |||
|---|---|---|---|
| Quadrant | BADHDUFLAG | Total packets | Discarded packets |
| A | 0 | 250 | 0 |
| B | 0 | 250 | 0 |
| C | 0 | 250 | 0 |
| D | 0 | 250 | 0 |
| Mode M0 | |||
|---|---|---|---|
| Quadrant | BADHDUFLAG | Total packets | Discarded packets |
| A | 0 | 350001 | 0 |
| B | 0 | 349444 | 0 |
| C | 0 | 337155 | 0 |
| D | 0 | 377311 | 0 |
| Quadrant | Total seconds | Saturated seconds | Saturation percentage |
|---|---|---|---|
| A | 163630 | 3262 | 1.993522% |
| B | 163630 | 3044 | 1.860295% |
| C | 163626 | 1738 | 1.062178% |
| D | 163627 | 4602 | 2.812494% |
Noise dominated data is calculated using 1-second bins in cleaned event files. If a bin has >2000 counts, and if more than 50% of those come from <1% of pixels, then it is considered to be noise-dominated and hence unusable.
| Quadrant | # 1 sec bins | Bins with >0 counts | Bins with >2000 counts | High rate bins dominated by noise | Noise dominated (total time) | Noise dominated (detector-on time) | Marked lightcurve |
|---|---|---|---|---|---|---|---|
| A | 188717 | 163608 | 0 | 0 | 0.00% | 0.00% | 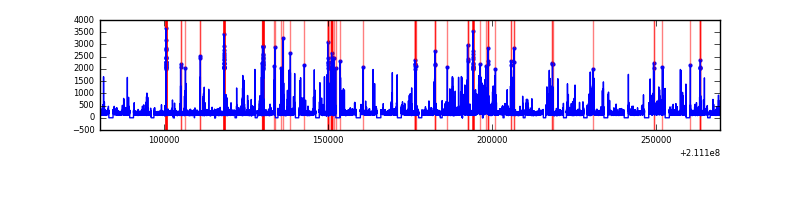 |
| B | 188717 | 163624 | 0 | 0 | 0.00% | 0.00% |  |
| C | 188717 | 163632 | 0 | 0 | 0.00% | 0.00% | 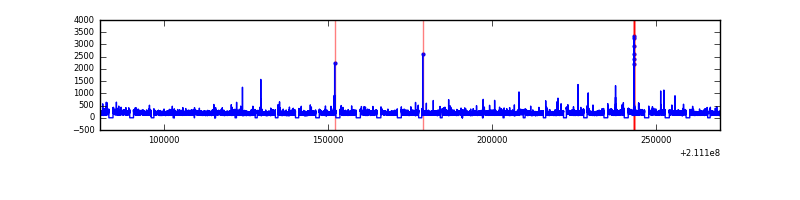 |
| D | 188717 | 163555 | 0 | 0 | 0.00% | 0.00% | 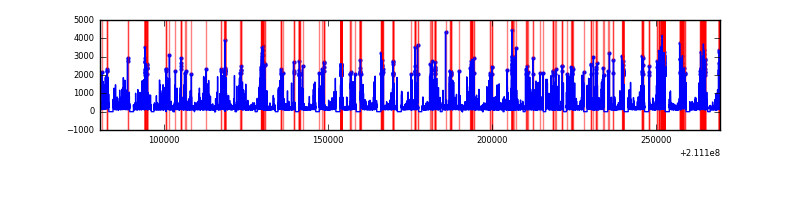 |
Top three noisy pixels from each quadrant. If the there are fewer than three noisy pixels in the level2.evt file, extra rows are filled as -1
| Pixel properties | Quadrant properties | ||||||
|---|---|---|---|---|---|---|---|
| Quadrant | DetID | PixID | Counts | Sigma | Mean | Median | Sigma |
| A | 0 | 29 | 8717 | 10.72 | 2372 | 2205 | 607.5 |
| A | 7 | 110 | 7603 | 8.89 | 2372 | 2205 | 607.5 |
| A | 9 | 19 | 6811 | 7.58 | 2372 | 2205 | 607.5 |
| B | 2 | 9 | 7675 | 11.32 | 2347 | 2221 | 481.7 |
| B | 12 | 226 | 6306 | 8.48 | 2347 | 2221 | 481.7 |
| B | 14 | 254 | 6248 | 8.36 | 2347 | 2221 | 481.7 |
| C | 1 | 80 | 6510 | 6.79 | 2387 | 2197 | 635.5 |
| C | 1 | 81 | 6345 | 6.53 | 2387 | 2197 | 635.5 |
| C | 12 | 241 | 6179 | 6.27 | 2387 | 2197 | 635.5 |
| D | 11 | 82 | 5841 | 6.5 | 2209 | 2003 | 590.6 |
| D | 3 | 14 | 5772 | 6.38 | 2209 | 2003 | 590.6 |
| D | 6 | 231 | 5661 | 6.19 | 2209 | 2003 | 590.6 |
Histogram calculated using DETX and DETY for each event in the final _common_clean file
| Quadrant A |  |
 |
Quadrant B |
|---|---|---|---|
| Quadrant D |  |
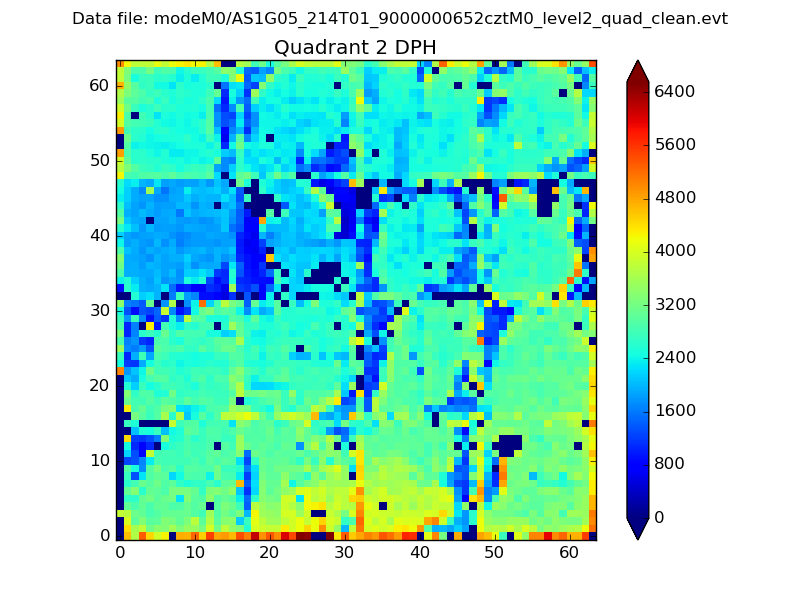 |
Quadrant C |
| Plot type | Count rate plots | Images |
|---|---|---|
| Comparison with Poisson distribution Blue bars denote a histogram of data divided into 1 sec bins. Red curve is a Poisson curve with rate = median count rate of data. |
 |
 |
| Quadrant-wise count rates Data is divided into 100 sec bins |
 |
|
| Module-wise count rates for Quadrant A Data is divided into 100 sec bins |
 |
 |
| Module-wise count rates for Quadrant B Data is divided into 100 sec bins |
 |
 |
| Module-wise count rates for Quadrant C Data is divided into 100 sec bins |
 |
 |
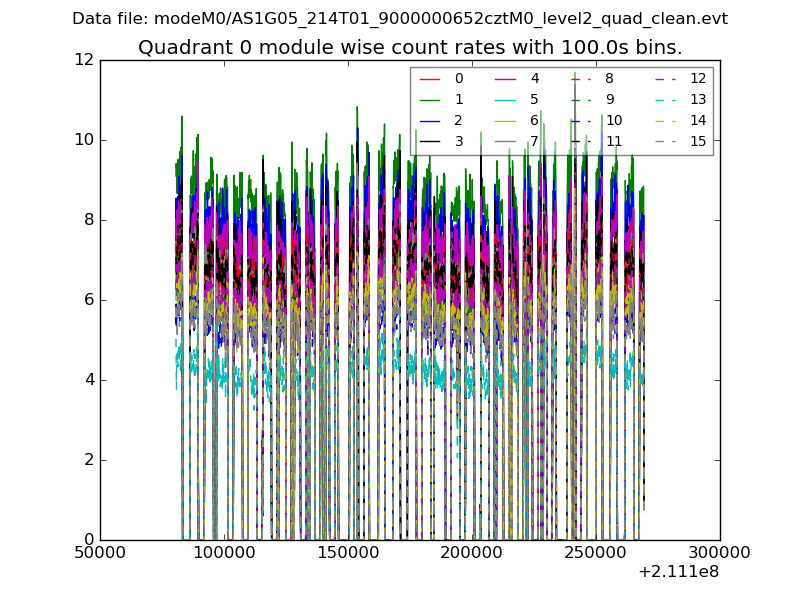
| Module-wise count rates for Quadrant D Data is divided into 100 sec bins |
 |
 |
| Parameter | Plot |
|---|---|
| CZT HV Monitor |  |
| D_VDD |  |
| Temperature 1 | 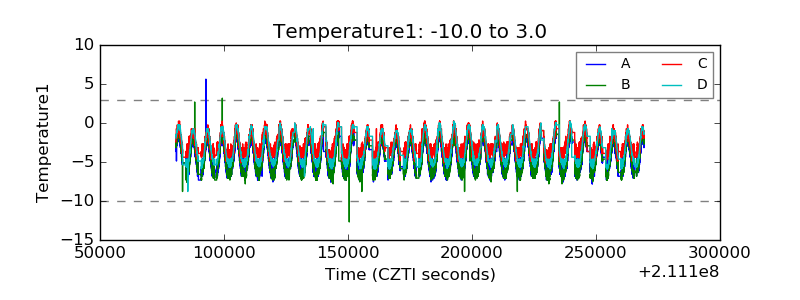 |
| Veto HV Monitor | 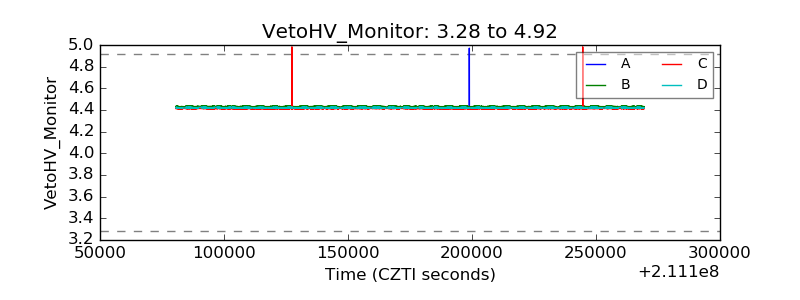 |
| Veto LLD |  |
| Alpha Counter |  |
| _CPM_Rate | 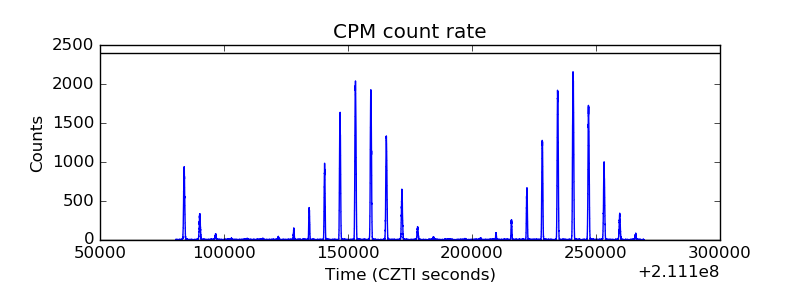 |
| CZT Counter |  |
| +2.5 Volts monitor |  |
| +5 Volts monitor | 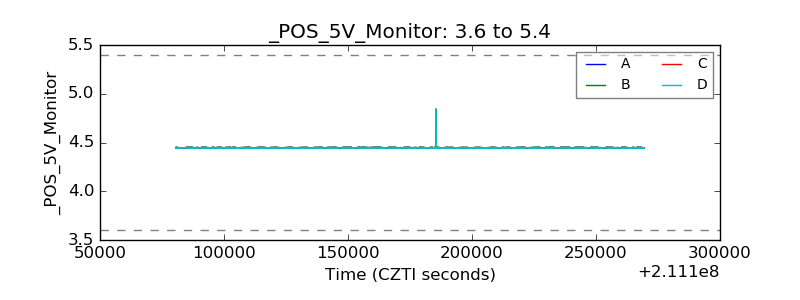 |
| _ROLL_ROT |  |
| _Roll_DEC | 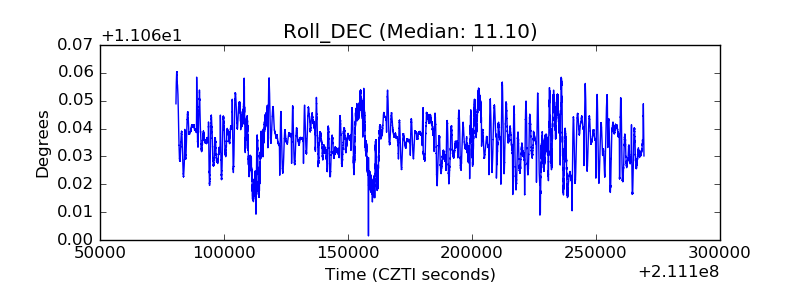 |
| _Roll_RA |  |
| Veto Counter | 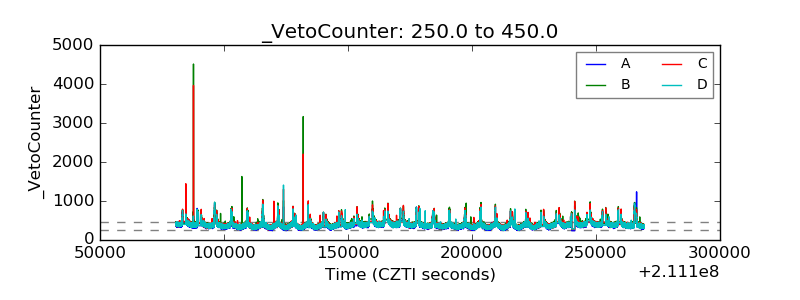 |