| Param | Original file | Final file |
|---|---|---|
| Filename | modeM0/AS1G05_214T01_9000000652_05153cztM0_level2.evt | modeM0/AS1G05_214T01_9000000652_05153cztM0_level2_quad_clean.evt |
| Size (bytes) | 292,512,960 | 49,351,680 |
| Size | 279.0 MB | 47.1 MB |
| Events in quadrant A | 1,992,121 | 303,287 |
| Events in quadrant B | 2,079,014 | 306,728 |
| Events in quadrant C | 2,040,701 | 308,904 |
| Events in quadrant D | 2,472,392 | 291,424 |
| Mode SS | |||
|---|---|---|---|
| Quadrant | BADHDUFLAG | Total packets | Discarded packets |
| A | 0 | 82 | 0 |
| B | 0 | 82 | 0 |
| C | 0 | 82 | 0 |
| D | 0 | 82 | 0 |
| Mode M9 | |||
|---|---|---|---|
| Quadrant | BADHDUFLAG | Total packets | Discarded packets |
| A | 0 | 13 | 0 |
| B | 0 | 13 | 0 |
| C | 0 | 13 | 0 |
| D | 0 | 13 | 0 |
| Mode M0 | |||
|---|---|---|---|
| Quadrant | BADHDUFLAG | Total packets | Discarded packets |
| A | 0 | 8393 | 2 |
| B | 0 | 8528 | 1 |
| C | 0 | 8474 | 1 |
| D | 0 | 10015 | 1 |
| Quadrant | Total seconds | Saturated seconds | Saturation percentage |
|---|---|---|---|
| A | 4023 | 47 | 1.168282% |
| B | 4023 | 57 | 1.416853% |
| C | 4023 | 42 | 1.043997% |
| D | 4023 | 76 | 1.889137% |
Noise dominated data is calculated using 1-second bins in cleaned event files. If a bin has >2000 counts, and if more than 50% of those come from <1% of pixels, then it is considered to be noise-dominated and hence unusable.
| Quadrant | # 1 sec bins | Bins with >0 counts | Bins with >2000 counts | High rate bins dominated by noise | Noise dominated (total time) | Noise dominated (detector-on time) | Marked lightcurve |
|---|---|---|---|---|---|---|---|
| A | 5313 | 4024 | 1 | 1 | 0.02% | 0.02% | 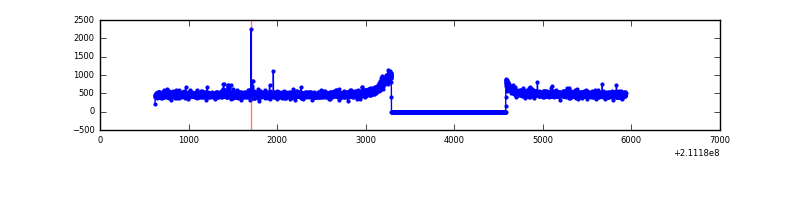 |
| B | 5313 | 4024 | 0 | 0 | 0.00% | 0.00% | 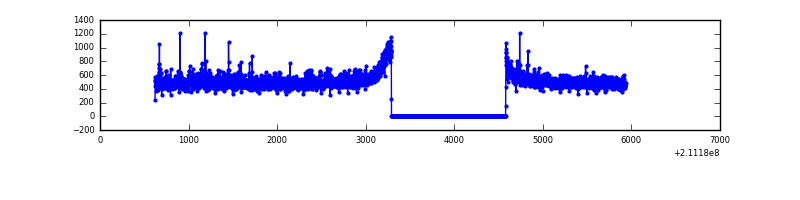 |
| C | 5313 | 4024 | 0 | 0 | 0.00% | 0.00% | 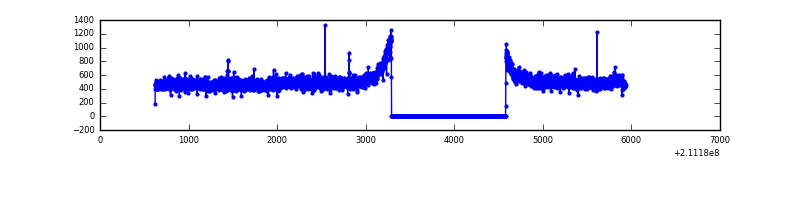 |
| D | 5313 | 4024 | 47 | 47 | 0.88% | 1.17% | 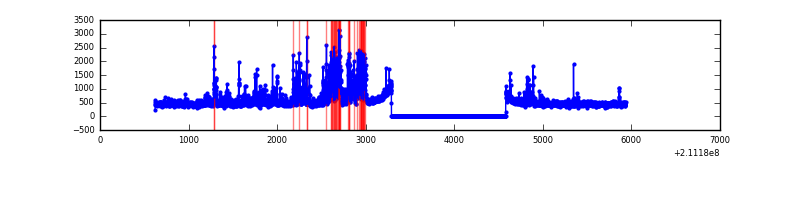 |
Top three noisy pixels from each quadrant. If the there are fewer than three noisy pixels in the level2.evt file, extra rows are filled as -1
| Pixel properties | Quadrant properties | ||||||
|---|---|---|---|---|---|---|---|
| Quadrant | DetID | PixID | Counts | Sigma | Mean | Median | Sigma |
| A | 0 | 50 | 11726 | 105.97 | 513 | 502 | 105.9 |
| A | 0 | 31 | 6516 | 56.78 | 513 | 502 | 105.9 |
| A | 12 | 194 | 5005 | 42.51 | 513 | 502 | 105.9 |
| B | 15 | 204 | 33820 | 332.3 | 517 | 506 | 100.3 |
| B | 15 | 54 | 14580 | 140.38 | 517 | 506 | 100.3 |
| B | 4 | 80 | 11781 | 112.46 | 517 | 506 | 100.3 |
| C | 1 | 16 | 91839 | 781.9 | 498 | 501 | 116.8 |
| C | 12 | 4 | 5371 | 41.69 | 498 | 501 | 116.8 |
| C | 13 | 61 | 4137 | 31.13 | 498 | 501 | 116.8 |
| D | 1 | 239 | 365991 | 2998.79 | 497 | 483 | 121.9 |
| D | 2 | 33 | 65190 | 530.89 | 497 | 483 | 121.9 |
| D | 2 | 136 | 44660 | 362.45 | 497 | 483 | 121.9 |
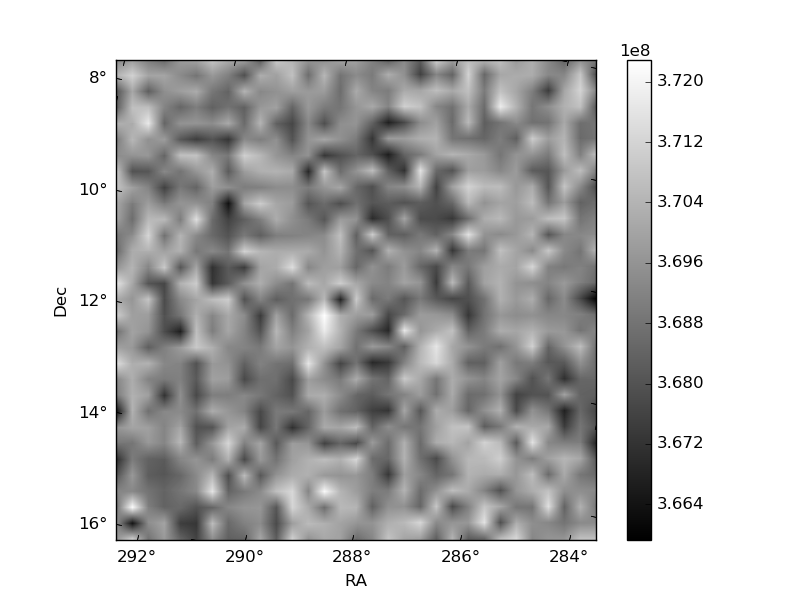
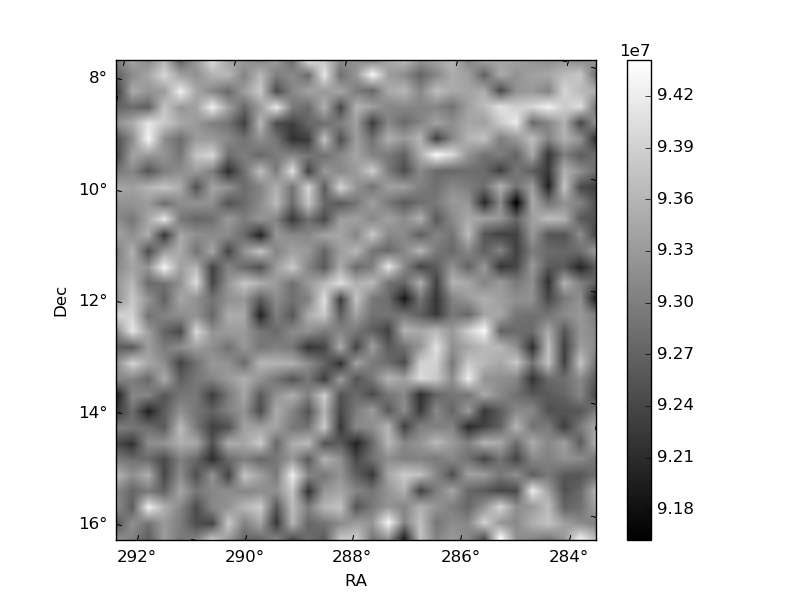
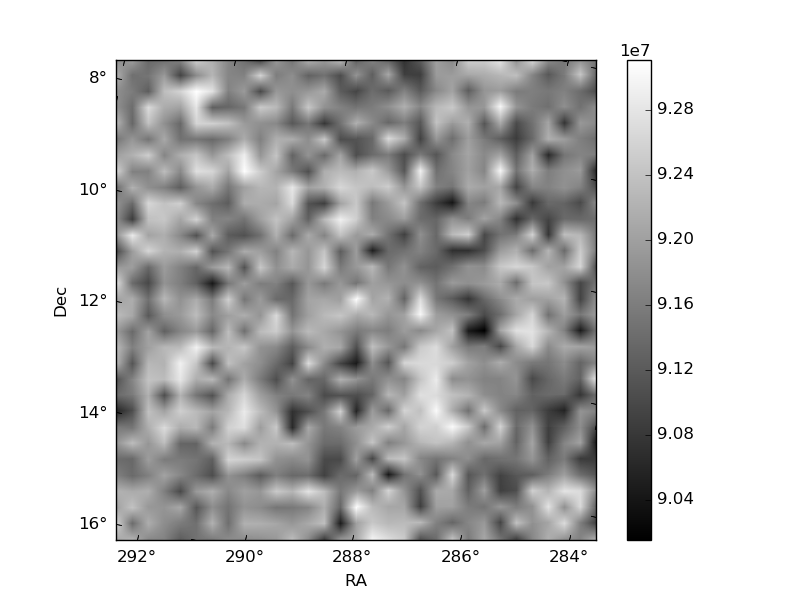
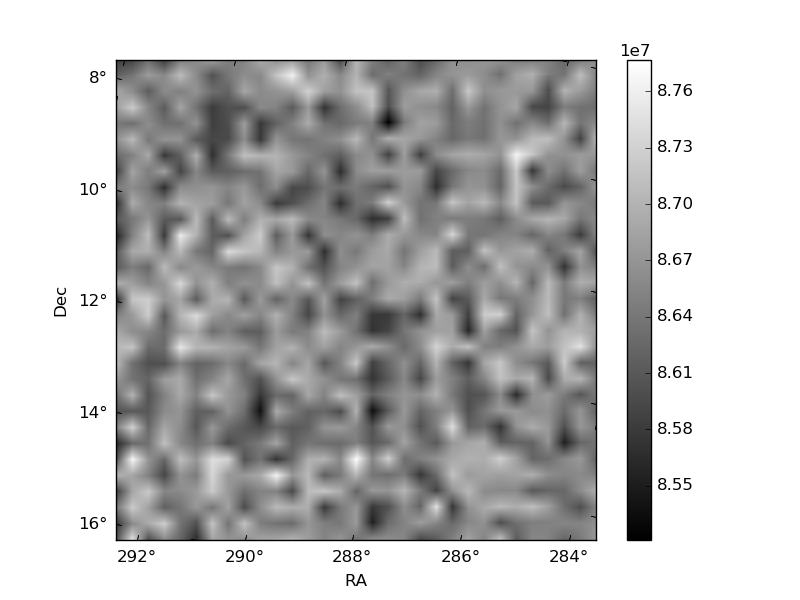
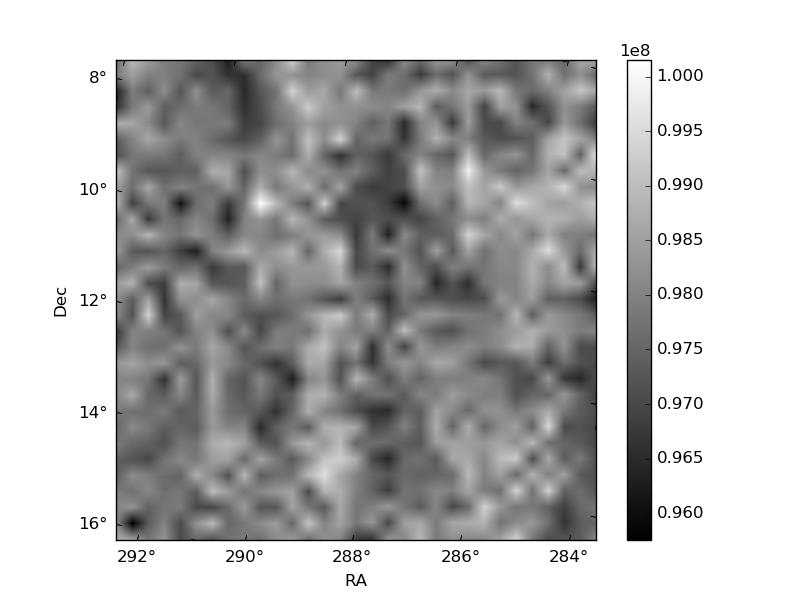
Histogram calculated using DETX and DETY for each event in the final _common_clean file
| Quadrant A | 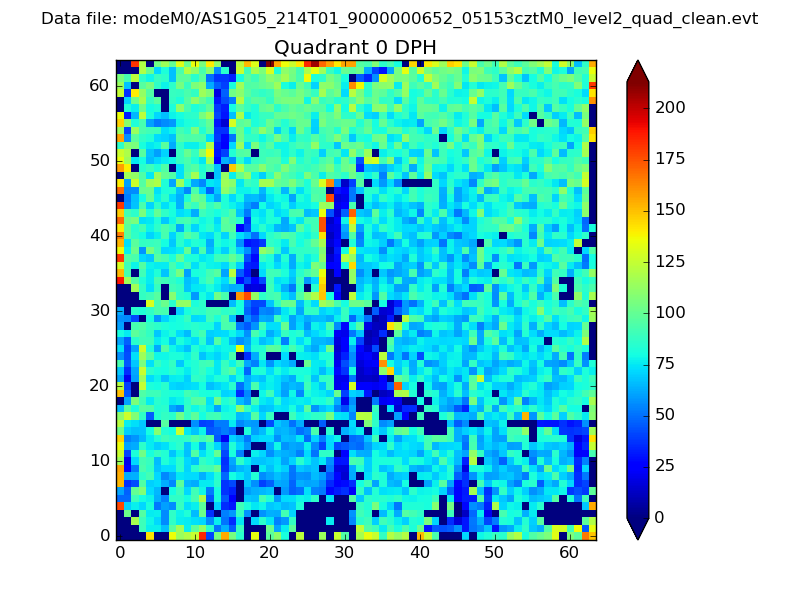 |
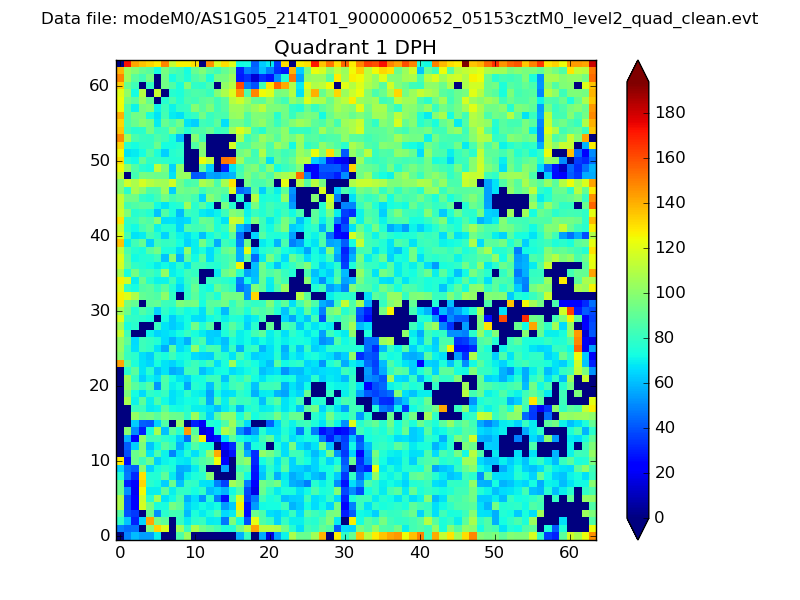 |
Quadrant B |
|---|---|---|---|
| Quadrant D | 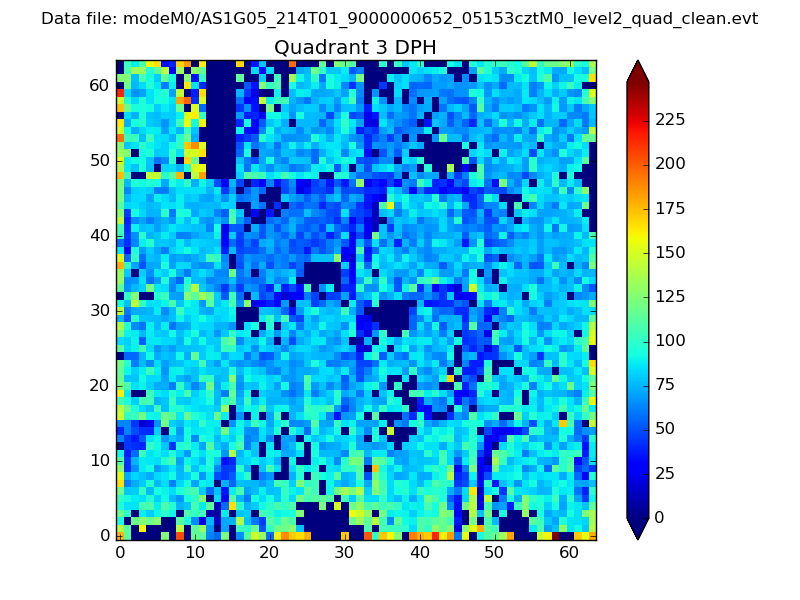 |
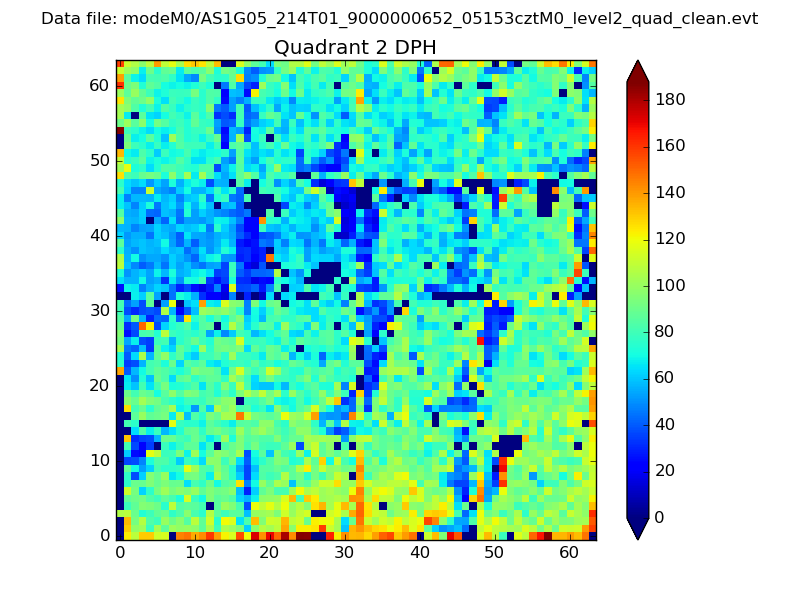 |
Quadrant C |
| Plot type | Count rate plots | Images |
|---|---|---|
| Comparison with Poisson distribution Blue bars denote a histogram of data divided into 1 sec bins. Red curve is a Poisson curve with rate = median count rate of data. |
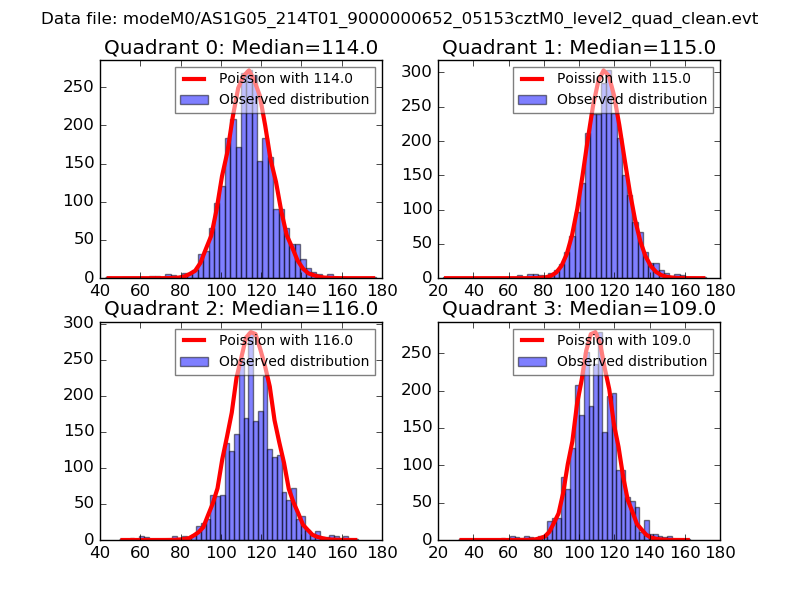 |
 |
| Quadrant-wise count rates Data is divided into 100 sec bins |
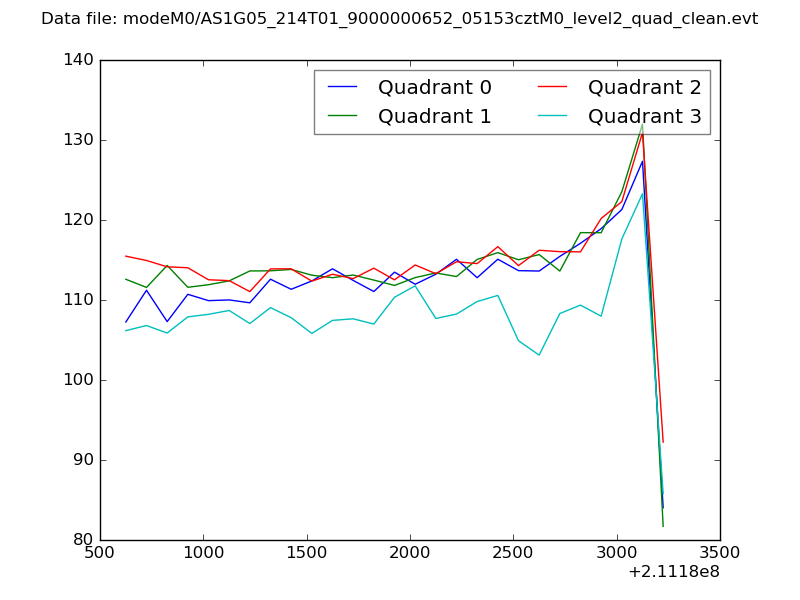 |
|
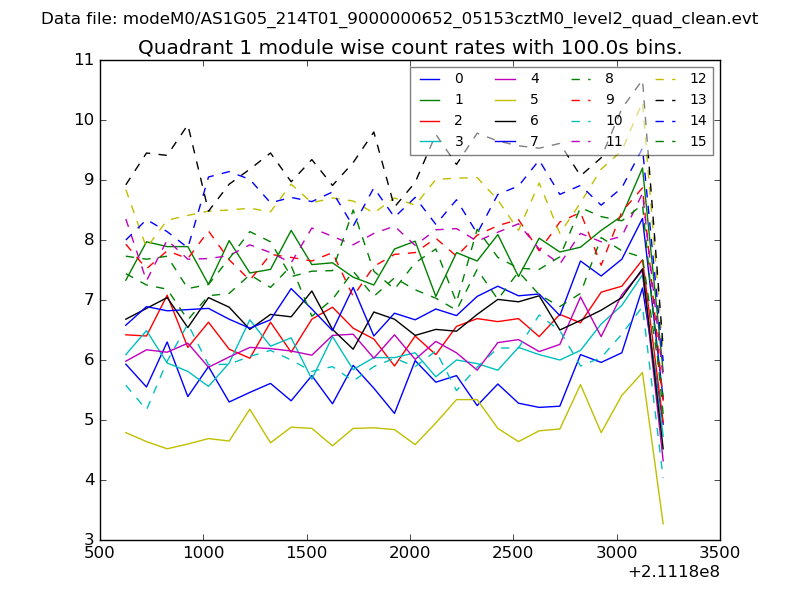
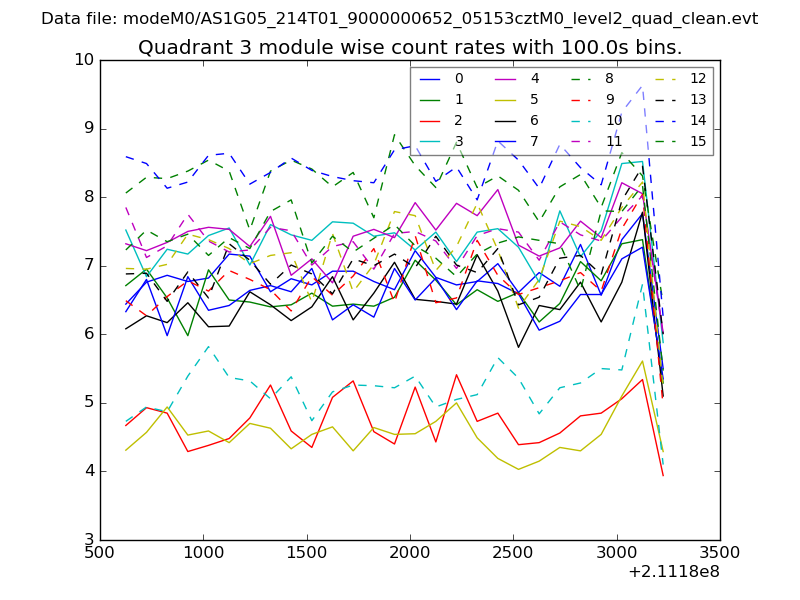
| Module-wise count rates for Quadrant A Data is divided into 100 sec bins |
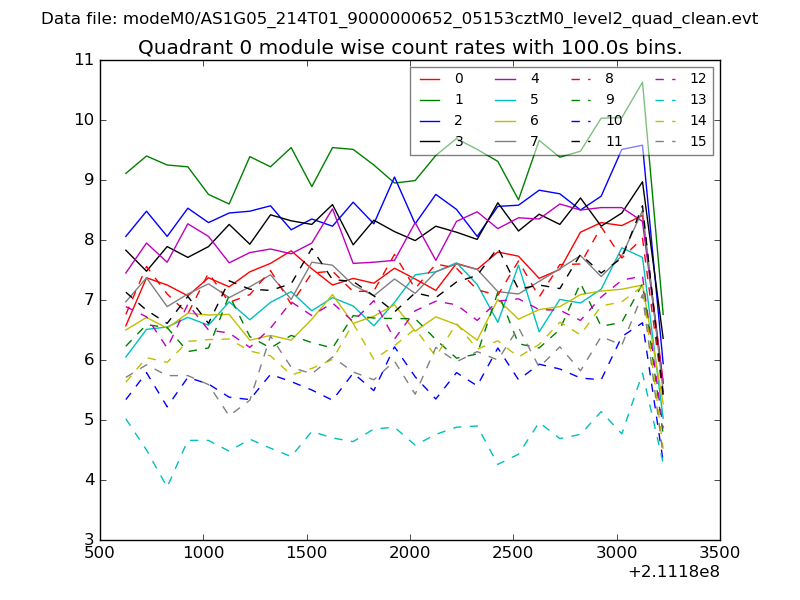 |
 |
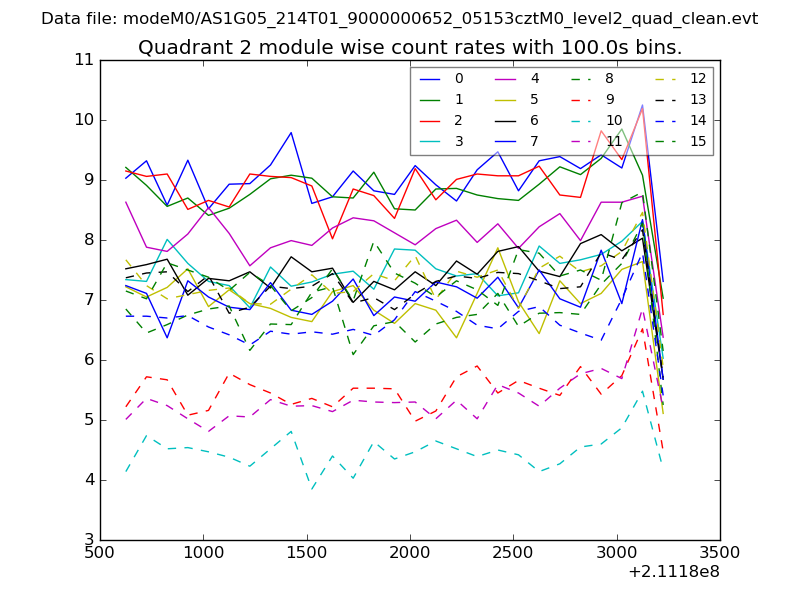
| Module-wise count rates for Quadrant B Data is divided into 100 sec bins |
 |
 |
| Module-wise count rates for Quadrant C Data is divided into 100 sec bins |
 |
 |
| Module-wise count rates for Quadrant D Data is divided into 100 sec bins |
 |
 |
| Parameter | Plot |
|---|---|
| CZT HV Monitor | 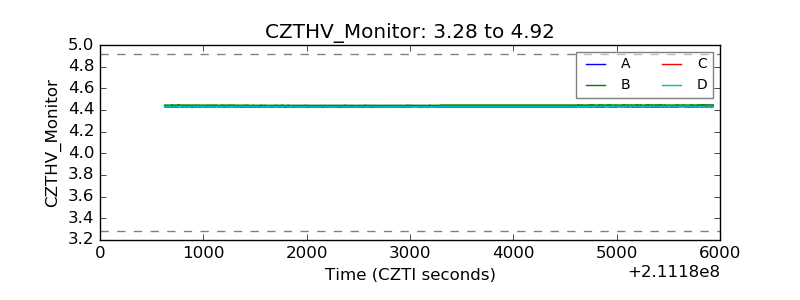 |
| D_VDD | 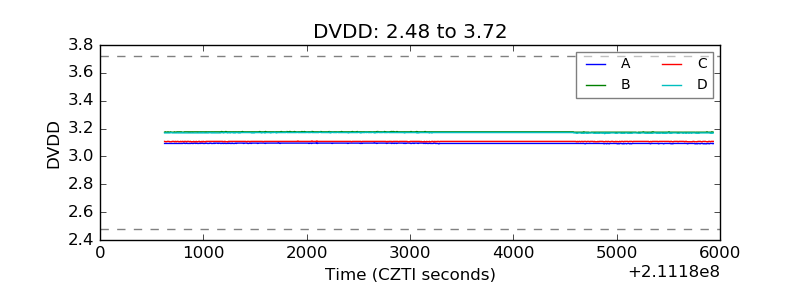 |
| Temperature 1 | 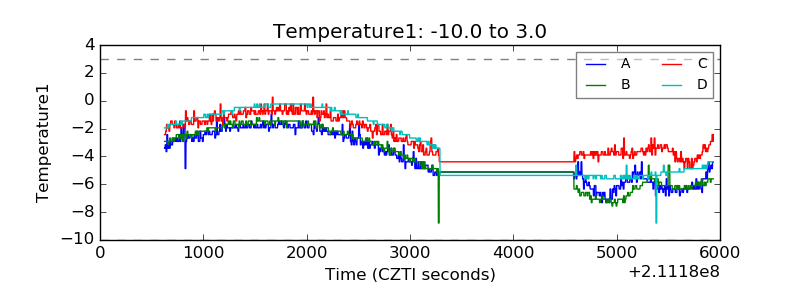 |
| Veto HV Monitor | 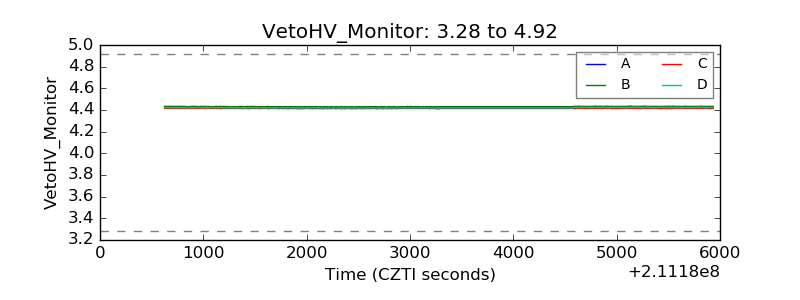 |
| Veto LLD | 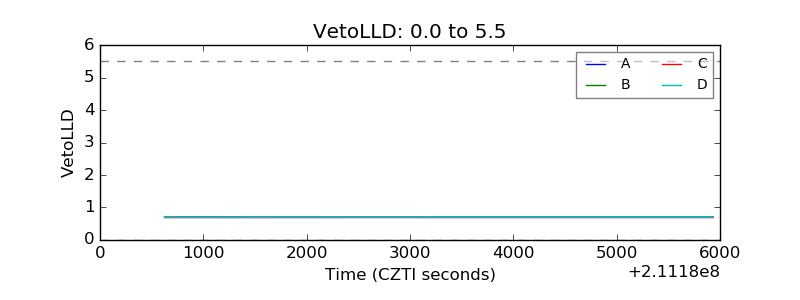 |
| Alpha Counter | 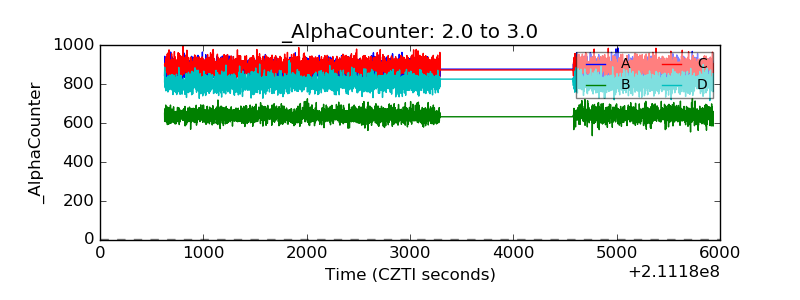 |
| _CPM_Rate | 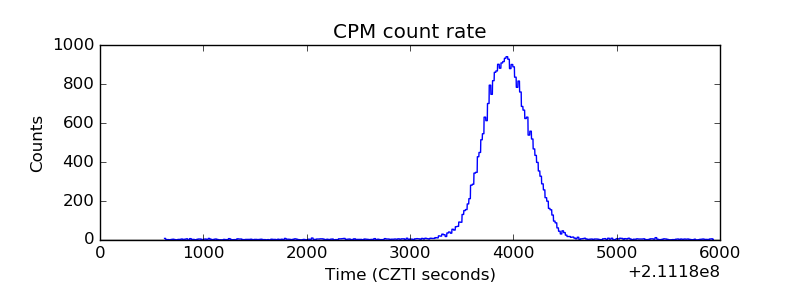 |
| CZT Counter | 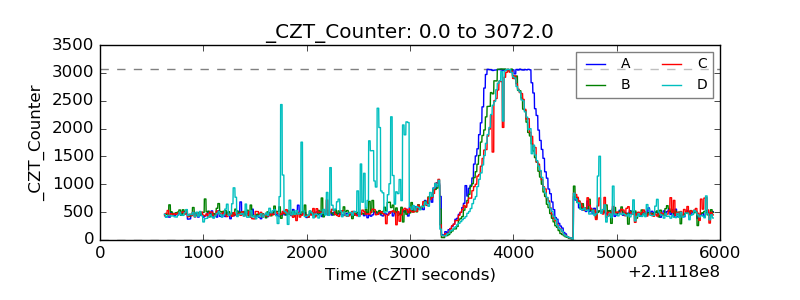 |
| +2.5 Volts monitor |  |
| +5 Volts monitor |  |
| _ROLL_ROT | 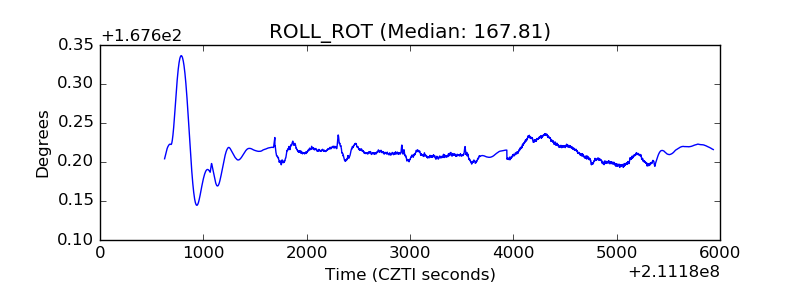 |
| _Roll_DEC | 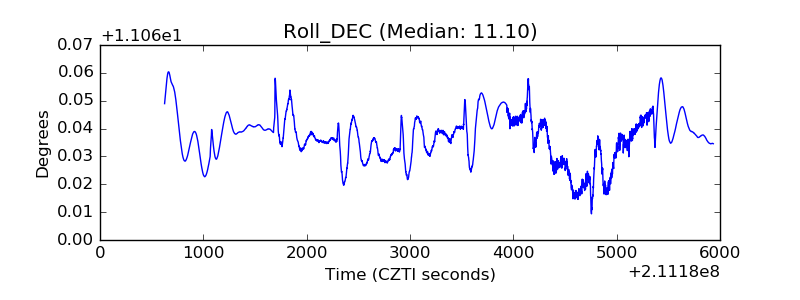 |
| _Roll_RA | 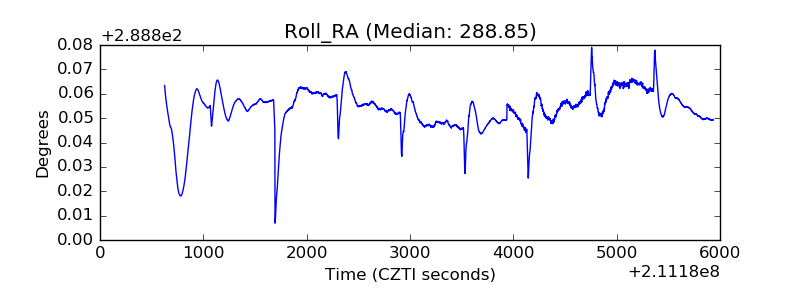 |
| Veto Counter |  |