| Param | Original file | Final file |
|---|---|---|
| Filename | modeM0/AS1G05_214T01_9000000652_05154cztM0_level2.evt | modeM0/AS1G05_214T01_9000000652_05154cztM0_level2_quad_clean.evt |
| Size (bytes) | 440,210,880 | 63,172,800 |
| Size | 419.8 MB | 60.2 MB |
| Events in quadrant A | 3,100,205 | 368,413 |
| Events in quadrant B | 3,370,616 | 370,148 |
| Events in quadrant C | 3,170,066 | 374,003 |
| Events in quadrant D | 3,255,196 | 352,801 |
| Mode SS | |||
|---|---|---|---|
| Quadrant | BADHDUFLAG | Total packets | Discarded packets |
| A | 0 | 130 | 0 |
| B | 0 | 130 | 0 |
| C | 0 | 130 | 0 |
| D | 0 | 130 | 0 |
| Mode M9 | |||
|---|---|---|---|
| Quadrant | BADHDUFLAG | Total packets | Discarded packets |
| A | 0 | 18 | 0 |
| B | 0 | 18 | 0 |
| C | 0 | 18 | 0 |
| D | 0 | 19 | 0 |
| Mode M0 | |||
|---|---|---|---|
| Quadrant | BADHDUFLAG | Total packets | Discarded packets |
| A | 0 | 13284 | 3 |
| B | 0 | 13920 | 2 |
| C | 0 | 13347 | 2 |
| D | 0 | 13931 | 2 |
| Quadrant | Total seconds | Saturated seconds | Saturation percentage |
|---|---|---|---|
| A | 6410 | 83 | 1.294852% |
| B | 6410 | 97 | 1.513261% |
| C | 6410 | 49 | 0.764431% |
| D | 6410 | 62 | 0.967239% |
Noise dominated data is calculated using 1-second bins in cleaned event files. If a bin has >2000 counts, and if more than 50% of those come from <1% of pixels, then it is considered to be noise-dominated and hence unusable.
| Quadrant | # 1 sec bins | Bins with >0 counts | Bins with >2000 counts | High rate bins dominated by noise | Noise dominated (total time) | Noise dominated (detector-on time) | Marked lightcurve |
|---|---|---|---|---|---|---|---|
| A | 7575 | 6411 | 1 | 1 | 0.01% | 0.02% | 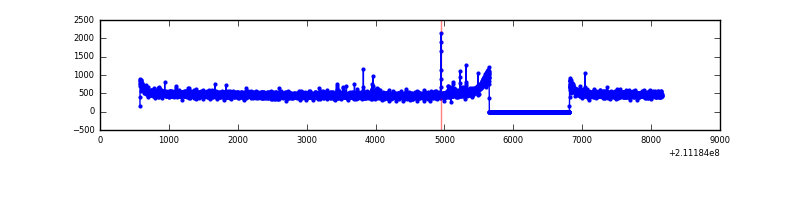 |
| B | 7575 | 6411 | 5 | 5 | 0.07% | 0.08% | 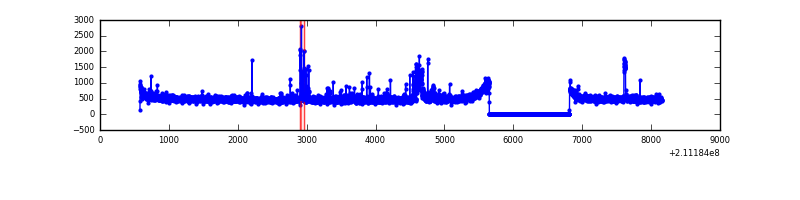 |
| C | 7575 | 6411 | 0 | 0 | 0.00% | 0.00% | 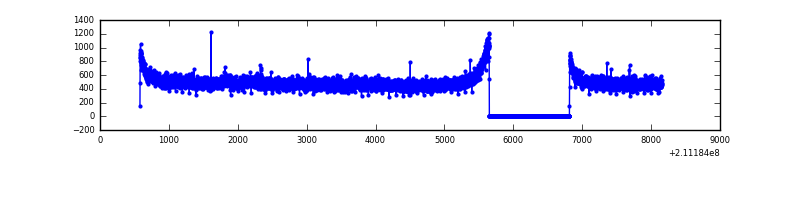 |
| D | 7575 | 6411 | 8 | 8 | 0.11% | 0.12% | 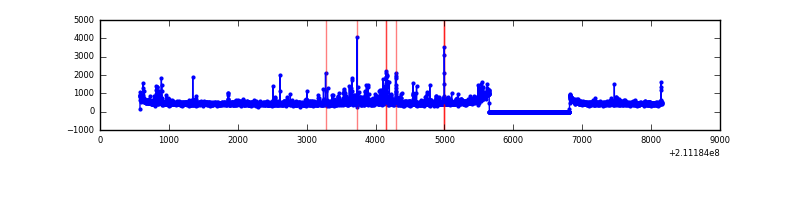 |
Top three noisy pixels from each quadrant. If the there are fewer than three noisy pixels in the level2.evt file, extra rows are filled as -1
| Pixel properties | Quadrant properties | ||||||
|---|---|---|---|---|---|---|---|
| Quadrant | DetID | PixID | Counts | Sigma | Mean | Median | Sigma |
| A | 0 | 50 | 22114 | 129.77 | 799 | 780 | 164.4 |
| A | 0 | 226 | 7775 | 42.55 | 799 | 780 | 164.4 |
| A | 12 | 194 | 7728 | 42.26 | 799 | 780 | 164.4 |
| B | 4 | 80 | 116038 | 734.65 | 808 | 790 | 156.9 |
| B | 5 | 175 | 37417 | 233.48 | 808 | 790 | 156.9 |
| B | 4 | 48 | 34768 | 216.59 | 808 | 790 | 156.9 |
| C | 1 | 16 | 139591 | 769.23 | 776 | 782 | 180.5 |
| C | 13 | 61 | 6299 | 30.57 | 776 | 782 | 180.5 |
| C | 14 | 67 | 4765 | 22.07 | 776 | 782 | 180.5 |
| D | 1 | 239 | 126287 | 656.88 | 774 | 752 | 191.1 |
| D | 2 | 136 | 89316 | 463.43 | 774 | 752 | 191.1 |
| D | 10 | 15 | 51457 | 265.32 | 774 | 752 | 191.1 |
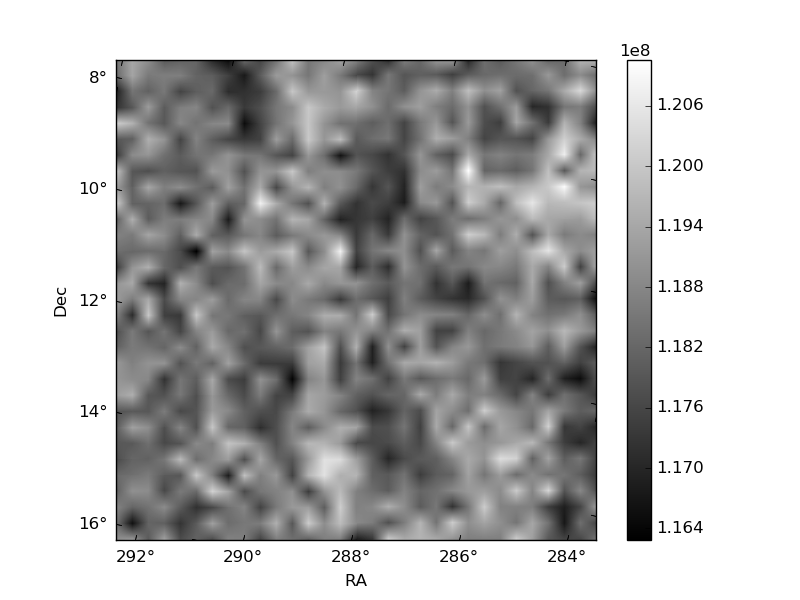
Histogram calculated using DETX and DETY for each event in the final _common_clean file
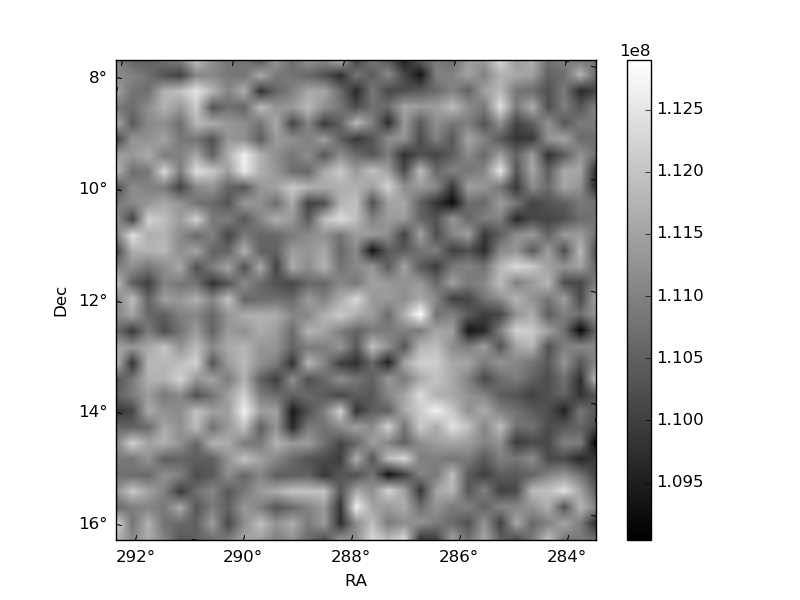
| Quadrant A | 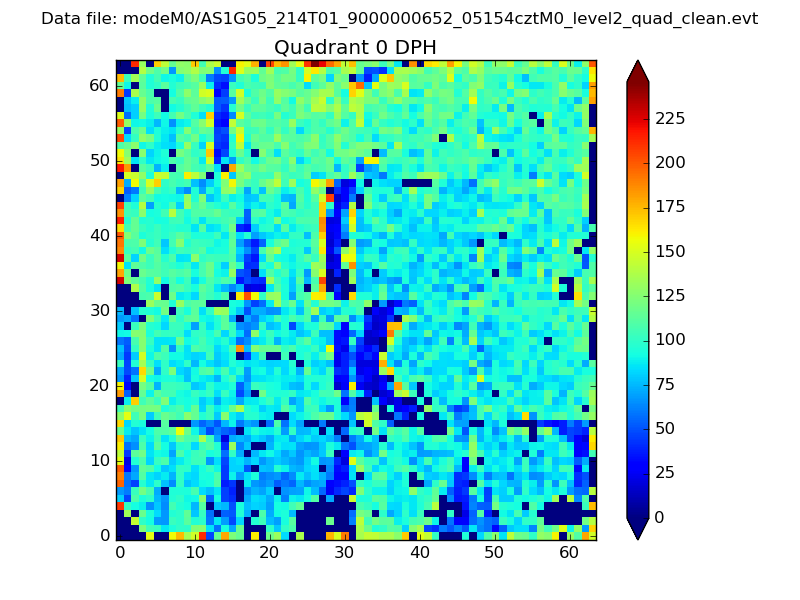 |
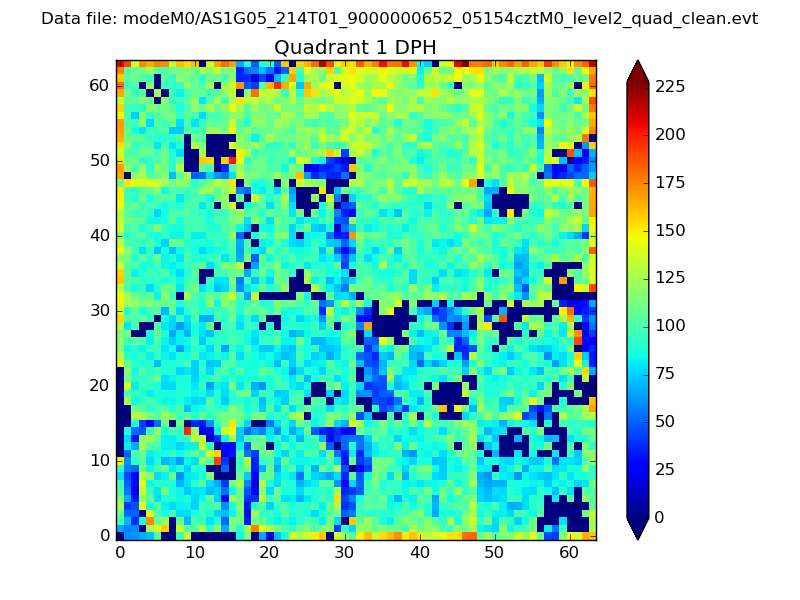 |
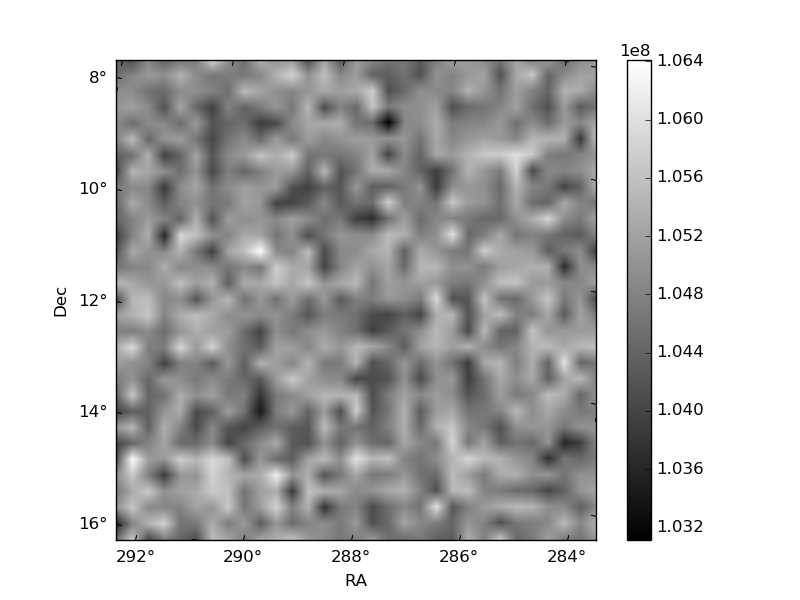
Quadrant B |
|---|---|---|---|
| Quadrant D | 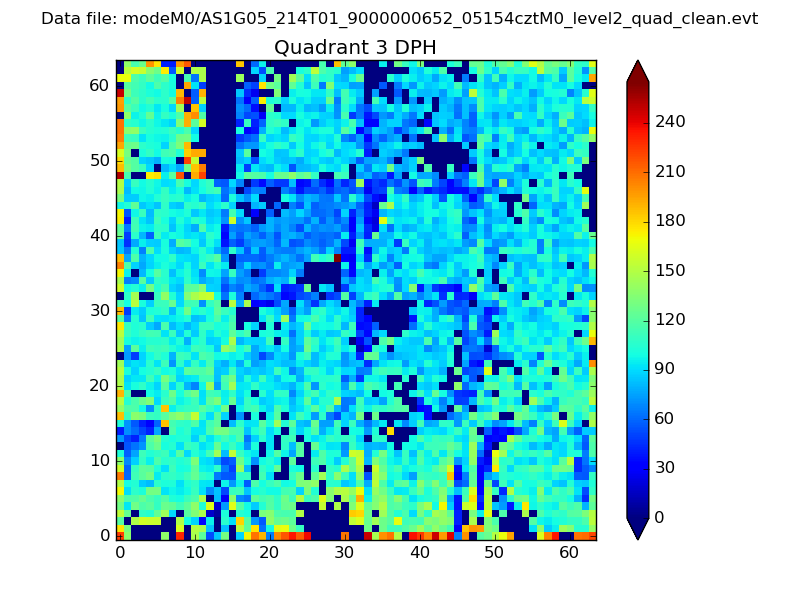 |
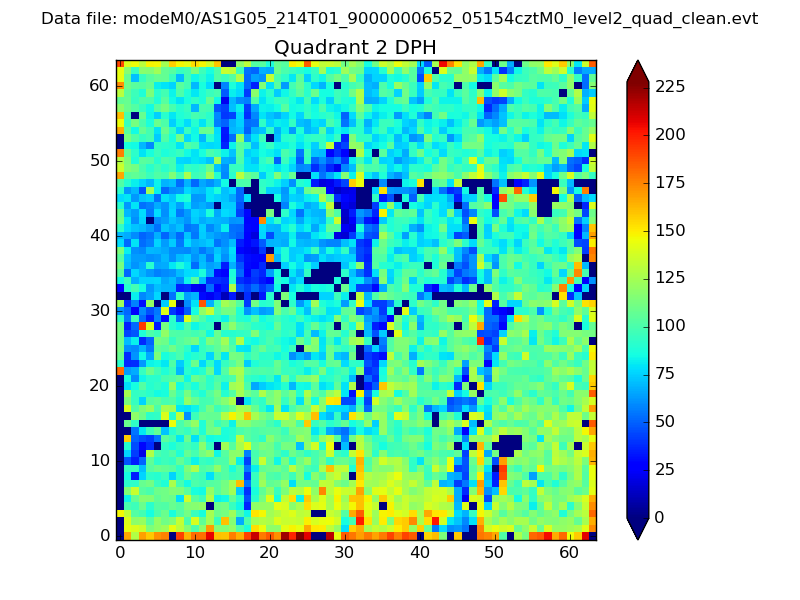 |
Quadrant C |
| Plot type | Count rate plots | Images |
|---|---|---|
| Comparison with Poisson distribution Blue bars denote a histogram of data divided into 1 sec bins. Red curve is a Poisson curve with rate = median count rate of data. |
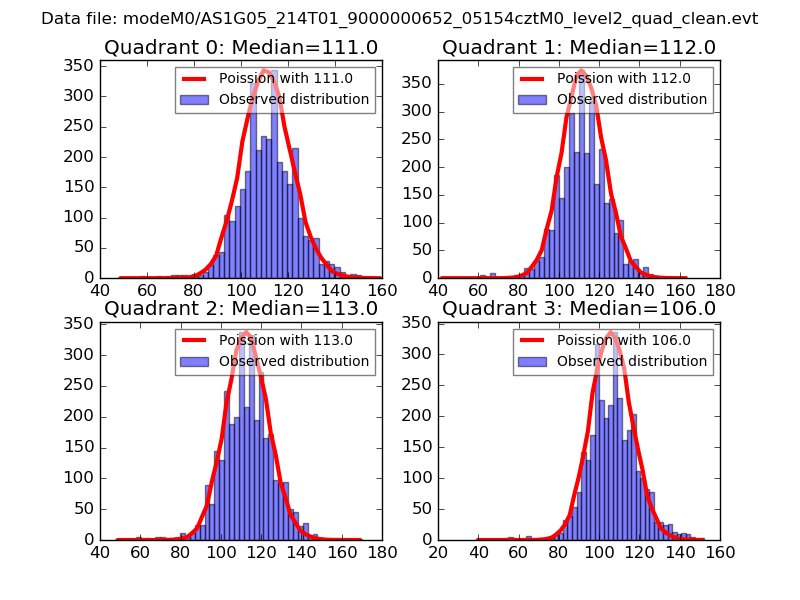 |
 |
| Quadrant-wise count rates Data is divided into 100 sec bins |
 |
|
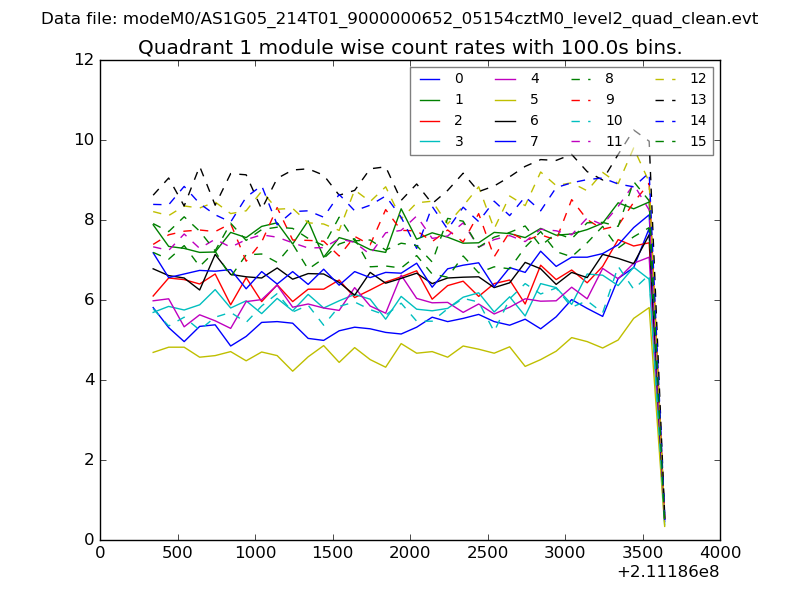
| Module-wise count rates for Quadrant A Data is divided into 100 sec bins |
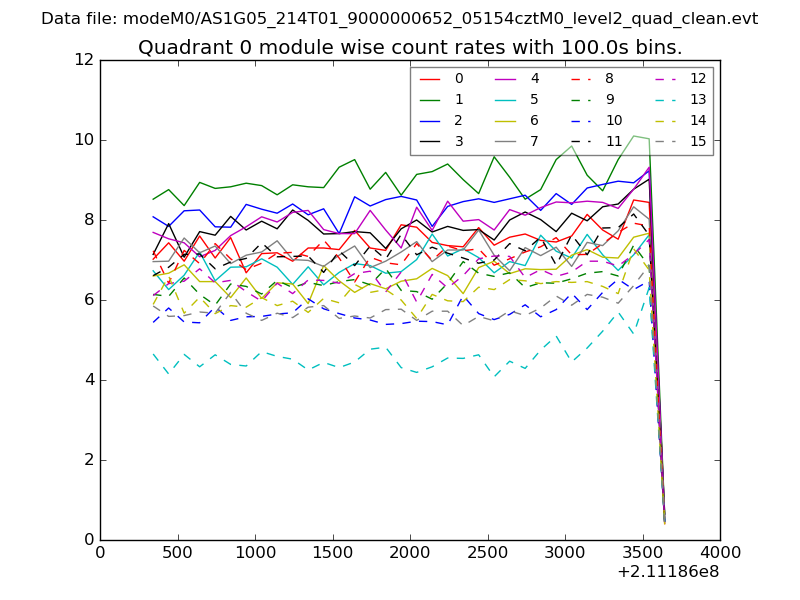 |
 |
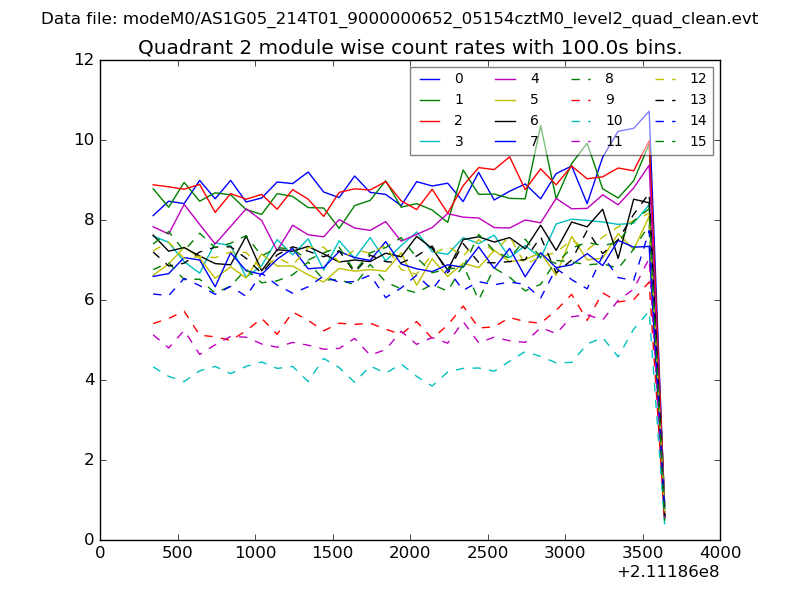
| Module-wise count rates for Quadrant B Data is divided into 100 sec bins |
 |
 |
| Module-wise count rates for Quadrant C Data is divided into 100 sec bins |
 |
 |
| Module-wise count rates for Quadrant D Data is divided into 100 sec bins |
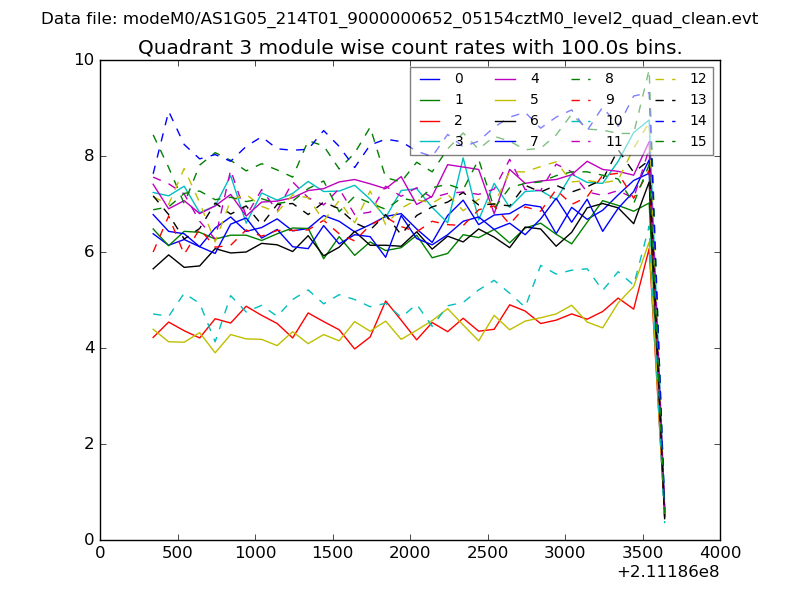 |
 |
| Parameter | Plot |
|---|---|
| CZT HV Monitor | 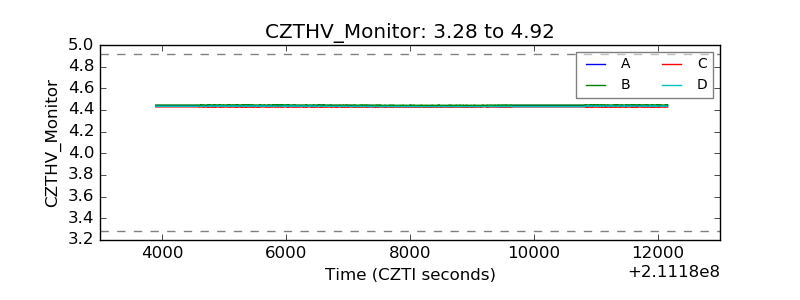 |
| D_VDD | 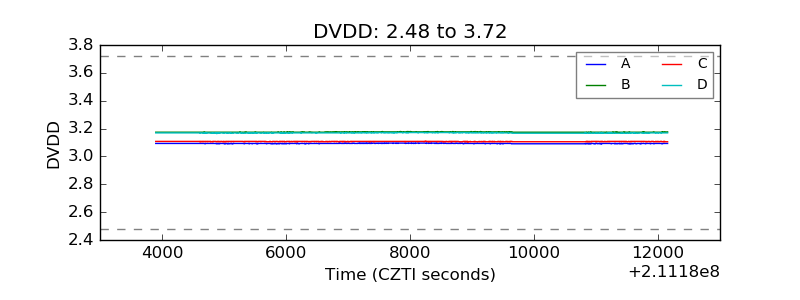 |
| Temperature 1 | 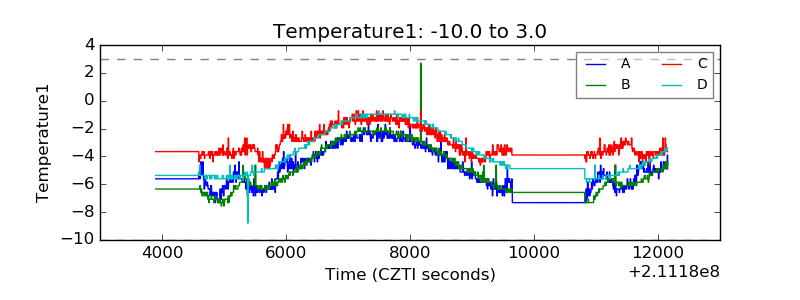 |
| Veto HV Monitor | 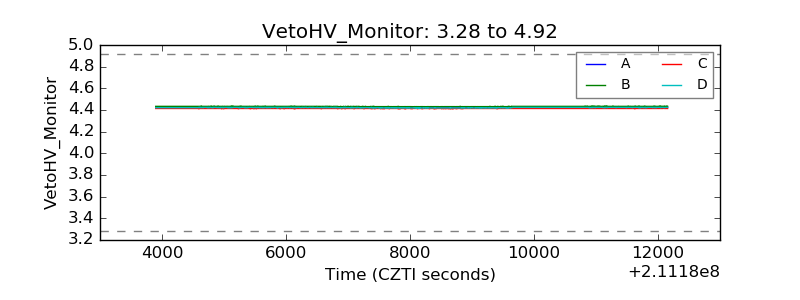 |
| Veto LLD | 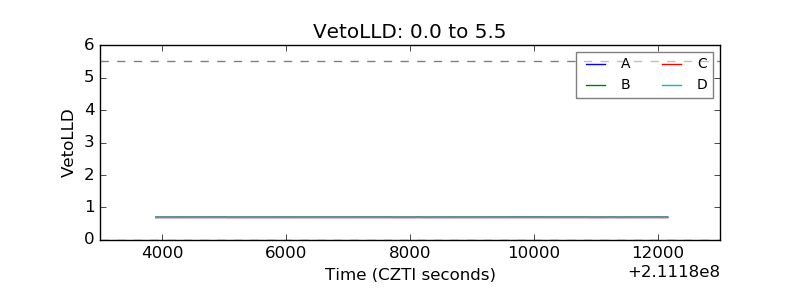 |
| Alpha Counter | 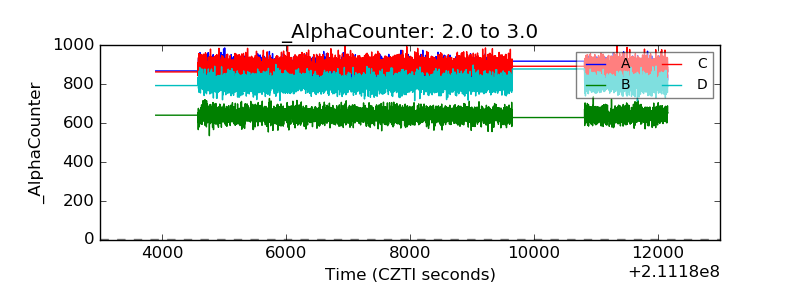 |
| _CPM_Rate | 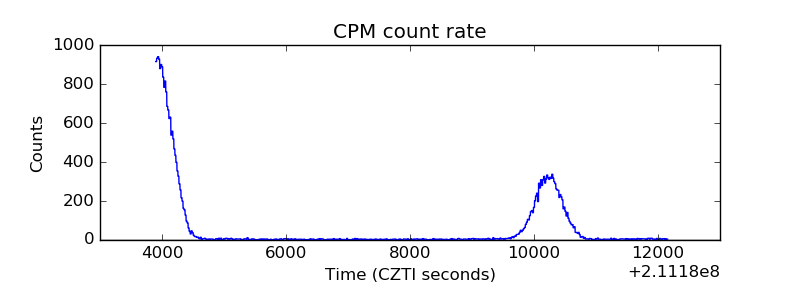 |
| CZT Counter | 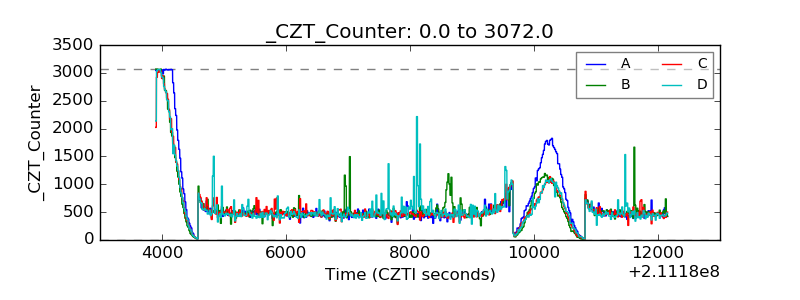 |
| +2.5 Volts monitor |  |
| +5 Volts monitor |  |
| _ROLL_ROT | 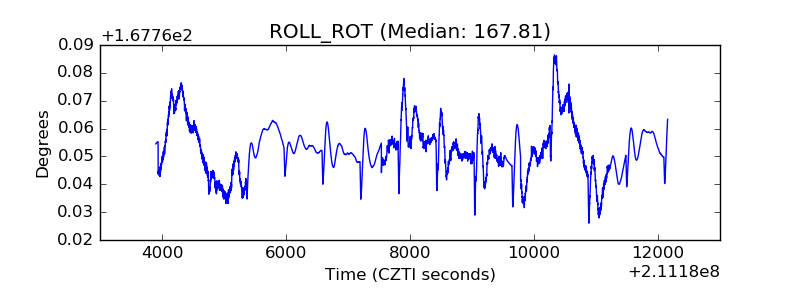 |
| _Roll_DEC | 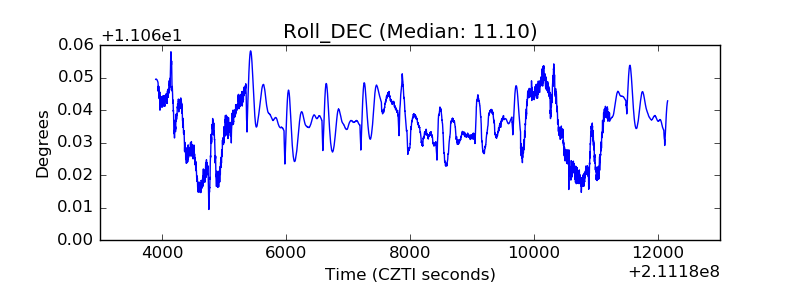 |
| _Roll_RA | 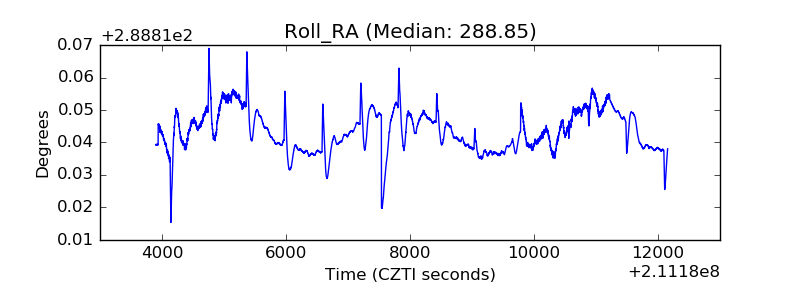 |
| Veto Counter | 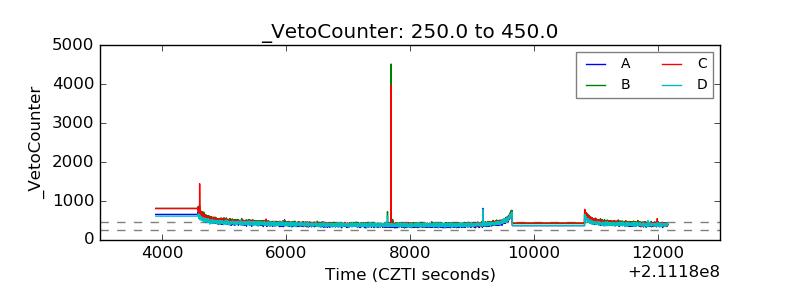 |