| Param | Original file | Final file |
|---|---|---|
| Filename | modeM0/AS1G05_214T01_9000000652_05156cztM0_level2.evt | modeM0/AS1G05_214T01_9000000652_05156cztM0_level2_quad_clean.evt |
| Size (bytes) | 500,883,840 | 77,212,800 |
| Size | 477.7 MB | 73.6 MB |
| Events in quadrant A | 3,528,680 | 457,975 |
| Events in quadrant B | 3,696,383 | 462,368 |
| Events in quadrant C | 3,452,423 | 469,476 |
| Events in quadrant D | 3,989,395 | 433,834 |
| Mode SS | |||
|---|---|---|---|
| Quadrant | BADHDUFLAG | Total packets | Discarded packets |
| A | 0 | 150 | 0 |
| B | 0 | 150 | 0 |
| C | 0 | 150 | 0 |
| D | 0 | 150 | 0 |
| Mode M9 | |||
|---|---|---|---|
| Quadrant | BADHDUFLAG | Total packets | Discarded packets |
| A | 0 | 9 | 0 |
| B | 0 | 9 | 0 |
| C | 0 | 9 | 0 |
| D | 0 | 10 | 0 |
| Mode M0 | |||
|---|---|---|---|
| Quadrant | BADHDUFLAG | Total packets | Discarded packets |
| A | 0 | 15523 | 4 |
| B | 0 | 15776 | 3 |
| C | 0 | 15307 | 3 |
| D | 0 | 17071 | 3 |
| Quadrant | Total seconds | Saturated seconds | Saturation percentage |
|---|---|---|---|
| A | 7387 | 293 | 3.966428% |
| B | 7387 | 273 | 3.695682% |
| C | 7387 | 184 | 2.490862% |
| D | 7387 | 409 | 5.536754% |
Noise dominated data is calculated using 1-second bins in cleaned event files. If a bin has >2000 counts, and if more than 50% of those come from <1% of pixels, then it is considered to be noise-dominated and hence unusable.
| Quadrant | # 1 sec bins | Bins with >0 counts | Bins with >2000 counts | High rate bins dominated by noise | Noise dominated (total time) | Noise dominated (detector-on time) | Marked lightcurve |
|---|---|---|---|---|---|---|---|
| A | 7722 | 7389 | 29 | 29 | 0.38% | 0.39% | 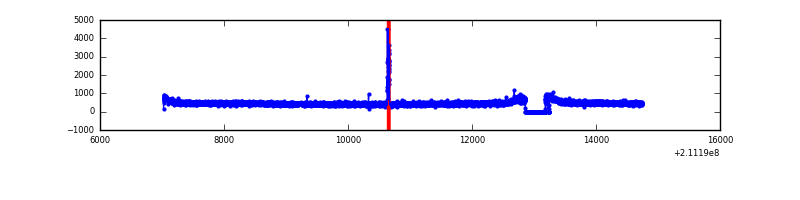 |
| B | 7722 | 7389 | 9 | 9 | 0.12% | 0.12% | 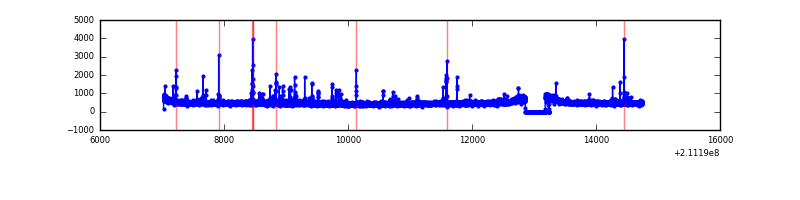 |
| C | 7722 | 7389 | 0 | 0 | 0.00% | 0.00% | 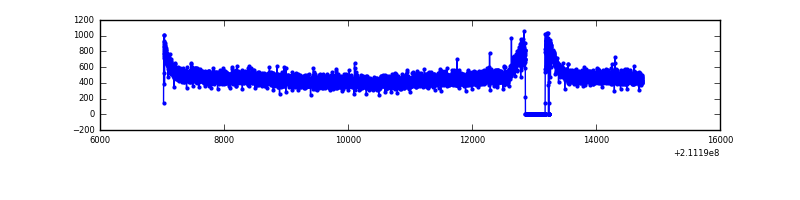 |
| D | 7722 | 7389 | 151 | 151 | 1.96% | 2.04% | 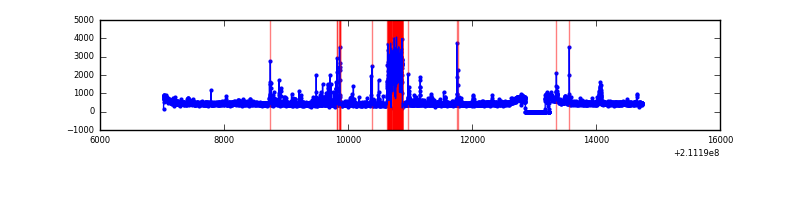 |
Top three noisy pixels from each quadrant. If the there are fewer than three noisy pixels in the level2.evt file, extra rows are filled as -1
| Pixel properties | Quadrant properties | ||||||
|---|---|---|---|---|---|---|---|
| Quadrant | DetID | PixID | Counts | Sigma | Mean | Median | Sigma |
| A | 0 | 50 | 94992 | 514.82 | 889 | 866 | 182.8 |
| A | 0 | 31 | 11343 | 57.3 | 889 | 866 | 182.8 |
| A | 12 | 194 | 8854 | 43.69 | 889 | 866 | 182.8 |
| B | 4 | 48 | 60886 | 344.98 | 898 | 875 | 174.0 |
| B | 4 | 80 | 44228 | 249.22 | 898 | 875 | 174.0 |
| B | 15 | 54 | 32990 | 184.62 | 898 | 875 | 174.0 |
| C | 1 | 16 | 39062 | 187.58 | 874 | 875 | 203.6 |
| C | 13 | 61 | 7047 | 30.32 | 874 | 875 | 203.6 |
| C | 14 | 67 | 3353 | 12.17 | 874 | 875 | 203.6 |
| D | 13 | 53 | 573564 | 2686.63 | 861 | 833 | 213.2 |
| D | 2 | 136 | 57346 | 265.1 | 861 | 833 | 213.2 |
| D | 10 | 15 | 29837 | 136.06 | 861 | 833 | 213.2 |
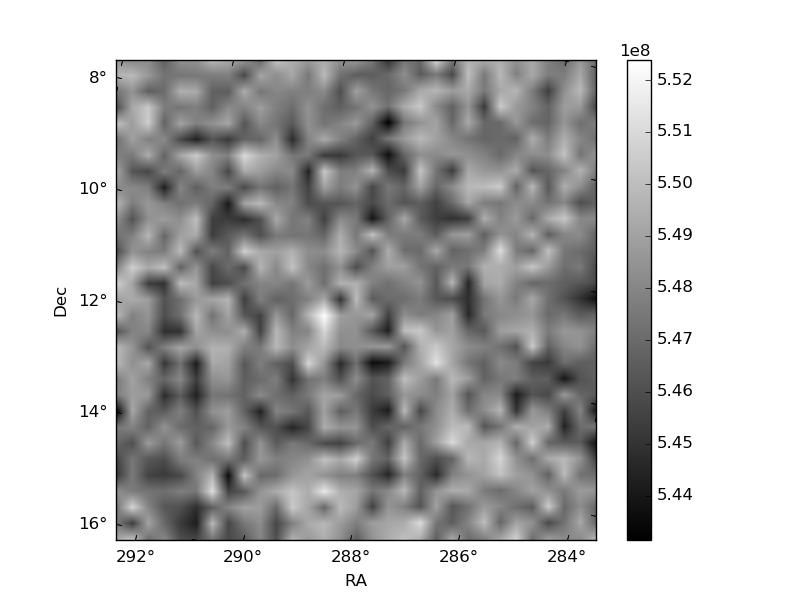
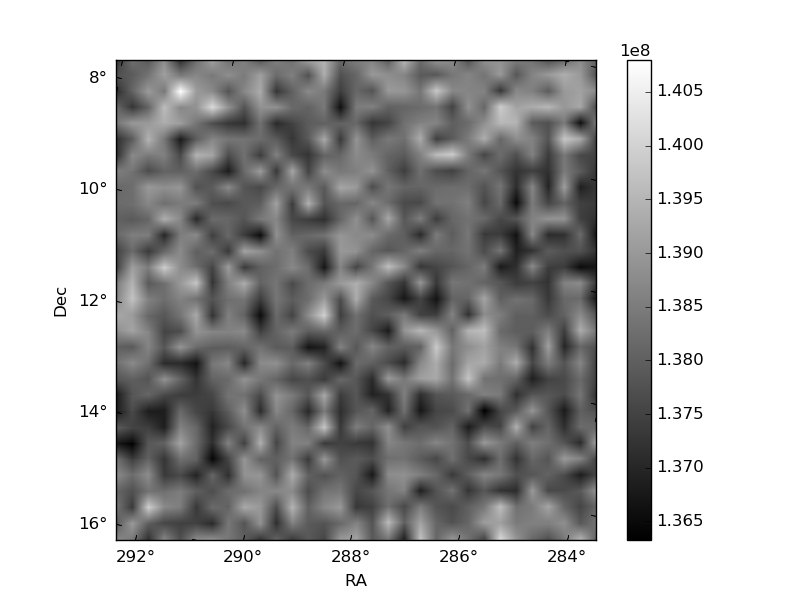
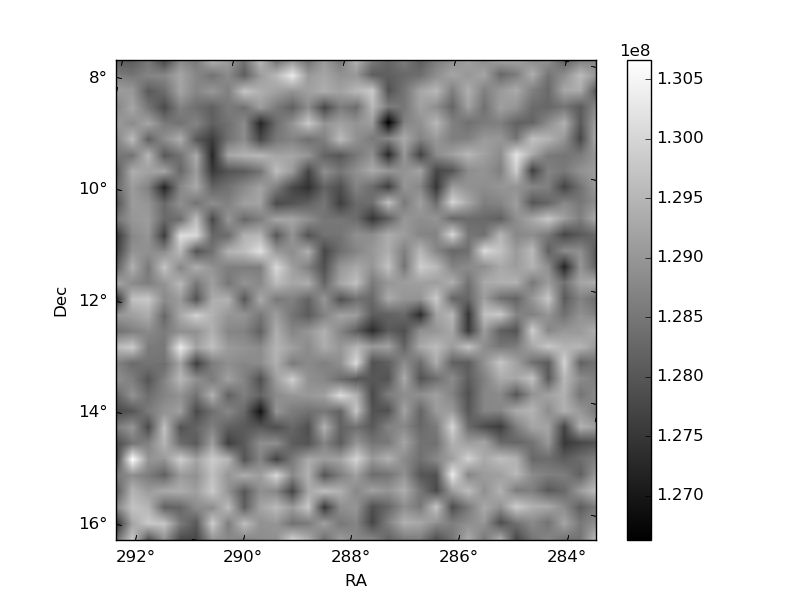
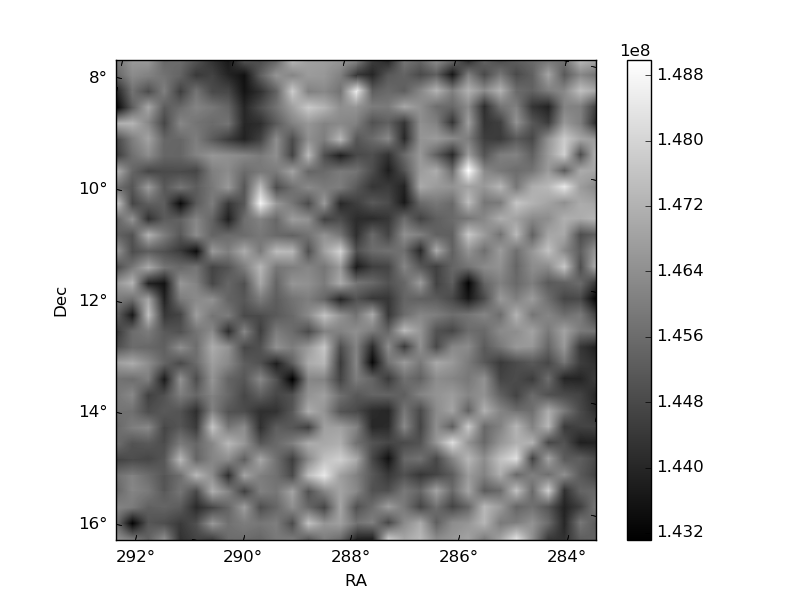
Histogram calculated using DETX and DETY for each event in the final _common_clean file
| Quadrant A | 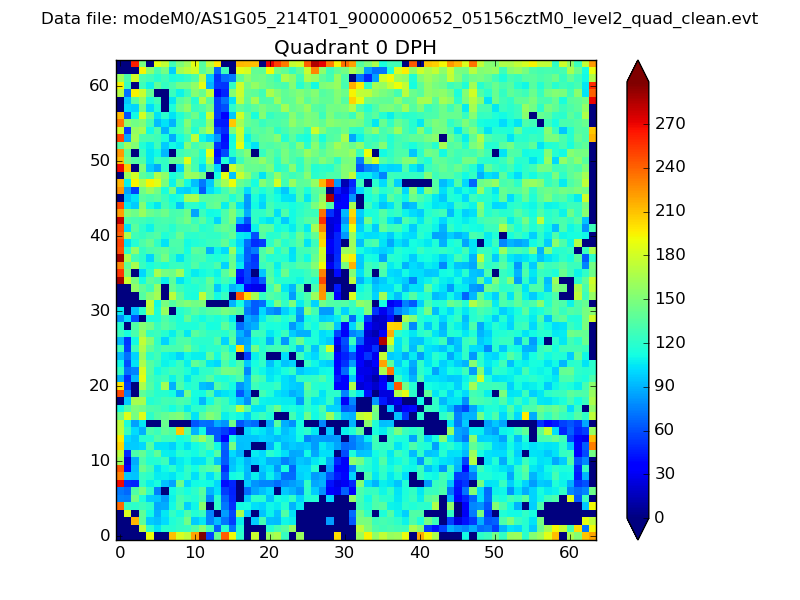 |
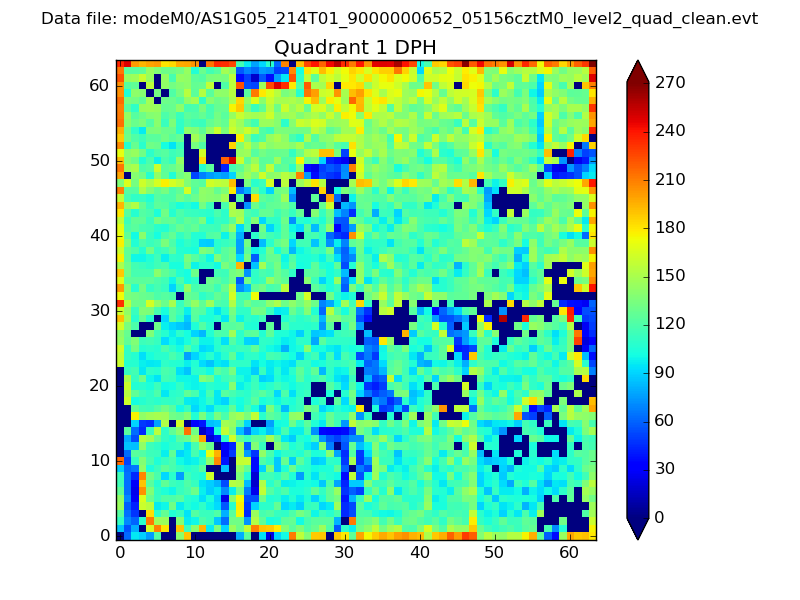 |
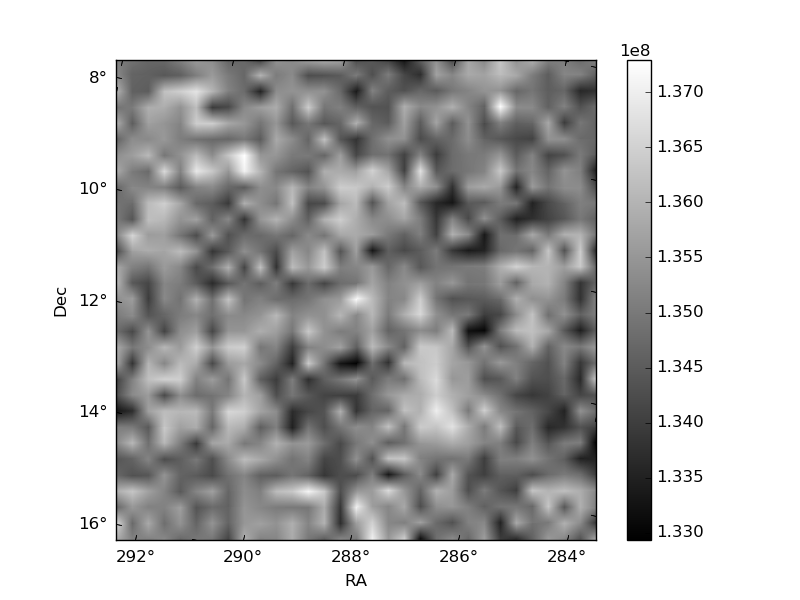
Quadrant B |
|---|---|---|---|
| Quadrant D | 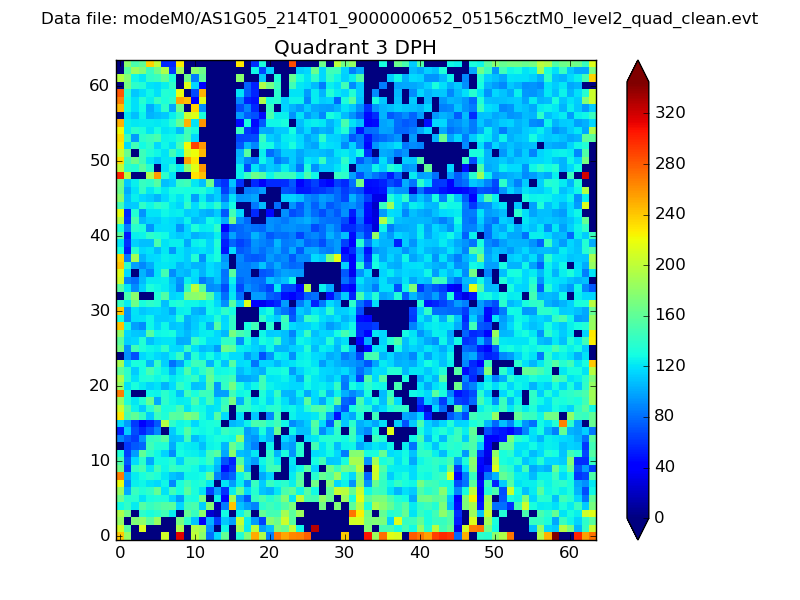 |
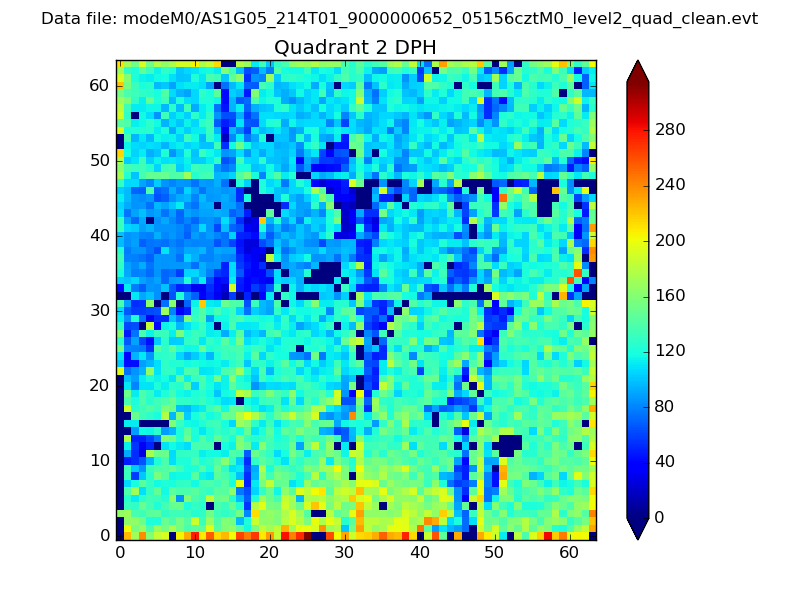 |
Quadrant C |
| Plot type | Count rate plots | Images |
|---|---|---|
| Comparison with Poisson distribution Blue bars denote a histogram of data divided into 1 sec bins. Red curve is a Poisson curve with rate = median count rate of data. |
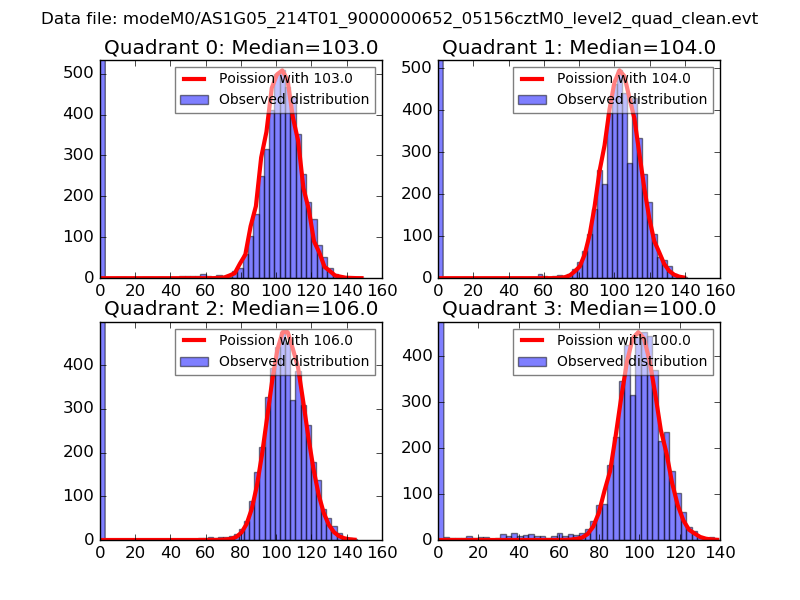 |
 |
| Quadrant-wise count rates Data is divided into 100 sec bins |
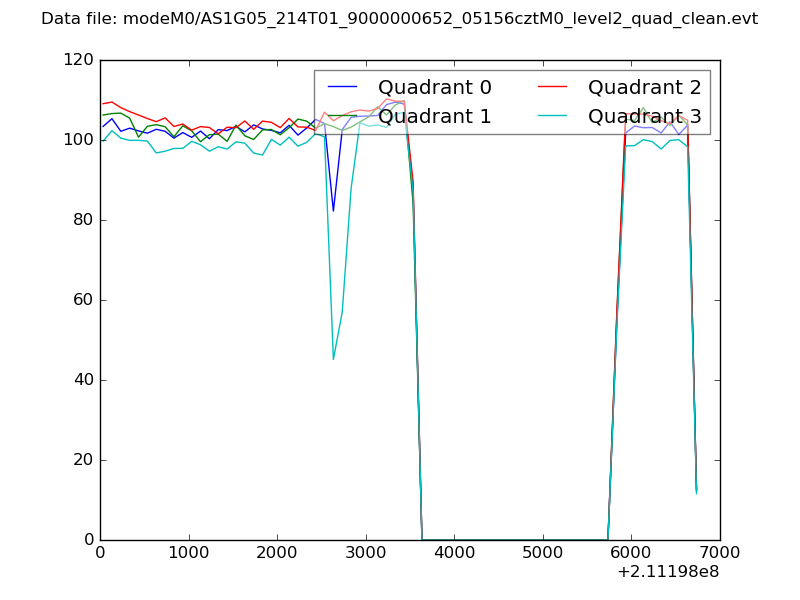 |
|
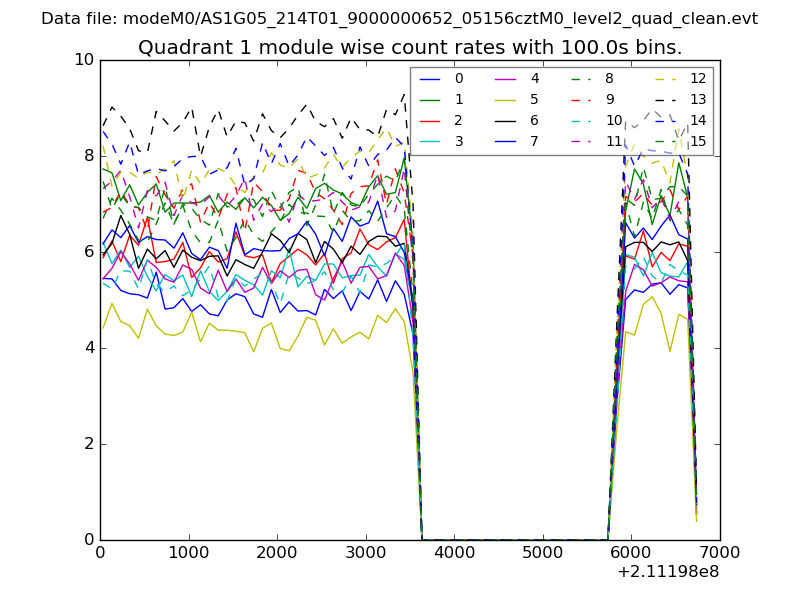
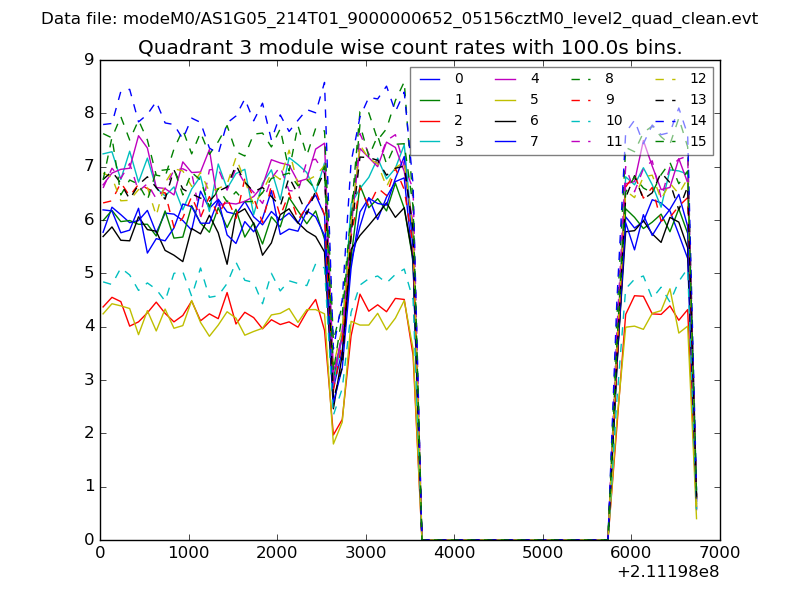
| Module-wise count rates for Quadrant A Data is divided into 100 sec bins |
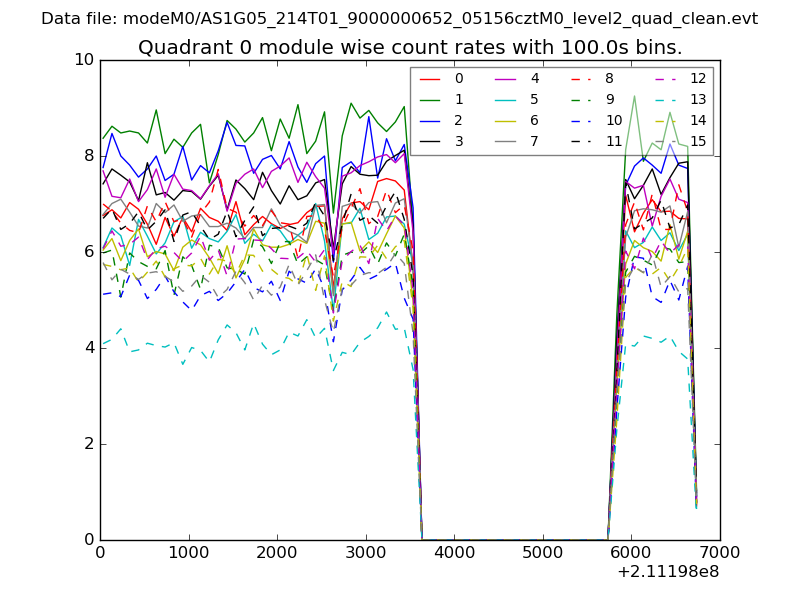 |
 |
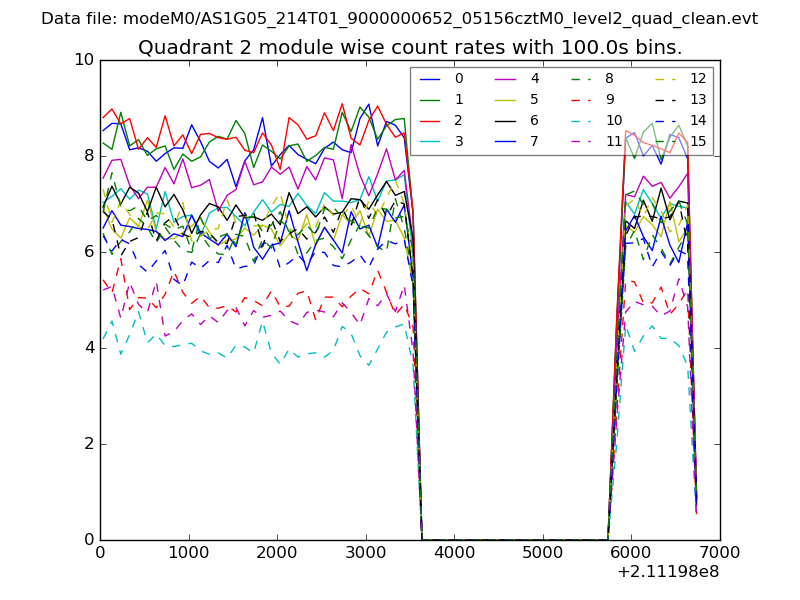
| Module-wise count rates for Quadrant B Data is divided into 100 sec bins |
 |
 |
| Module-wise count rates for Quadrant C Data is divided into 100 sec bins |
 |
 |
| Module-wise count rates for Quadrant D Data is divided into 100 sec bins |
 |
 |
| Parameter | Plot |
|---|---|
| CZT HV Monitor | 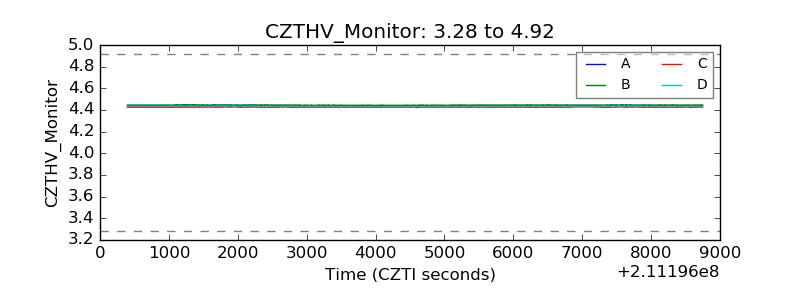 |
| D_VDD | 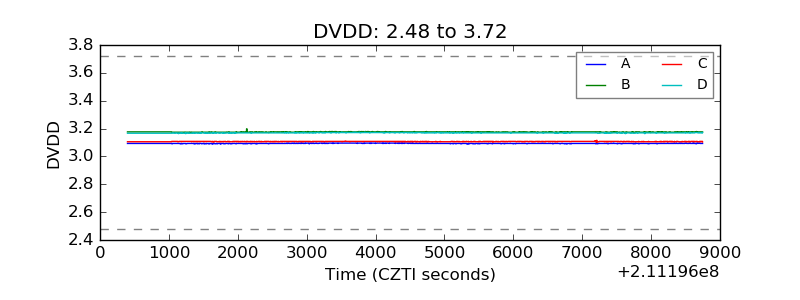 |
| Temperature 1 | 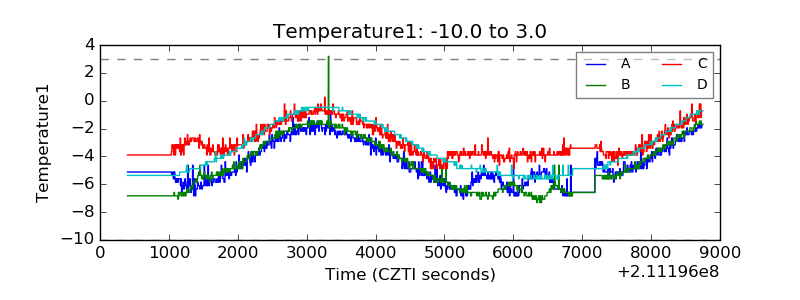 |
| Veto HV Monitor | 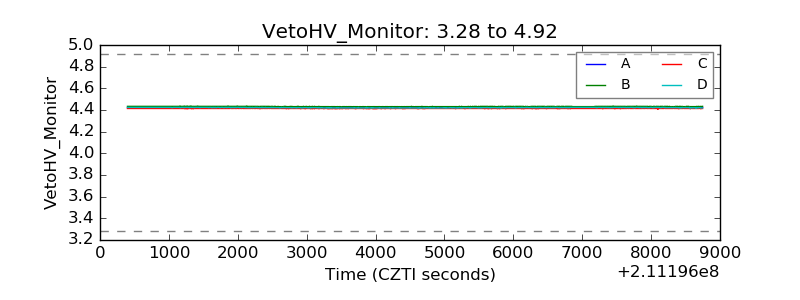 |
| Veto LLD | 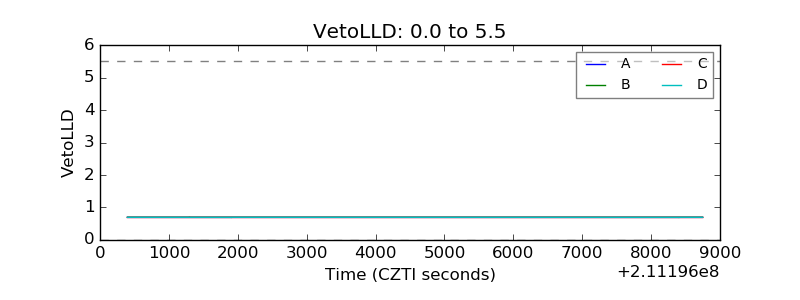 |
| Alpha Counter | 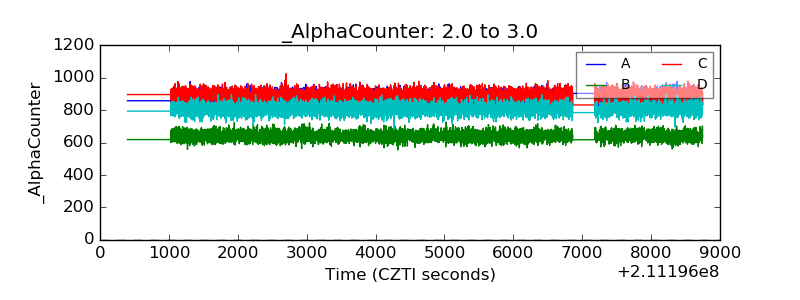 |
| _CPM_Rate | 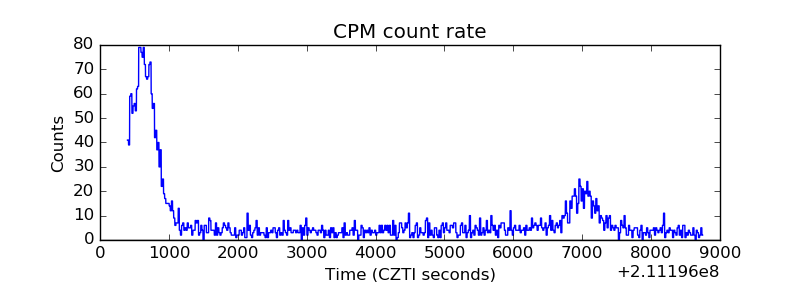 |
| CZT Counter | 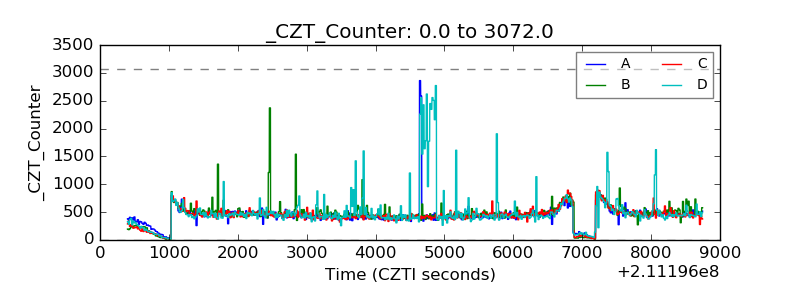 |
| +2.5 Volts monitor | 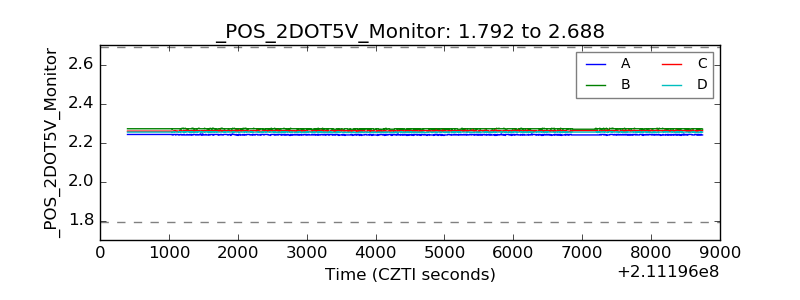 |
| +5 Volts monitor | 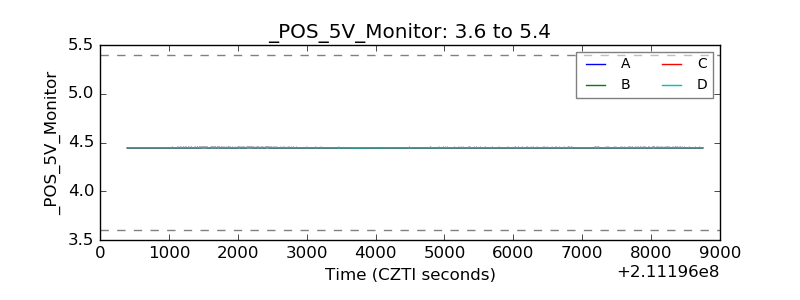 |
| _ROLL_ROT | 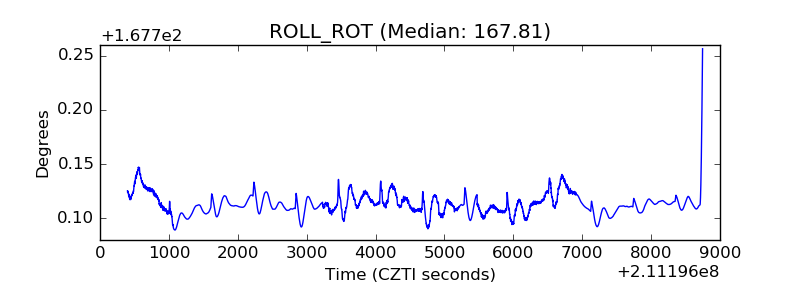 |
| _Roll_DEC | 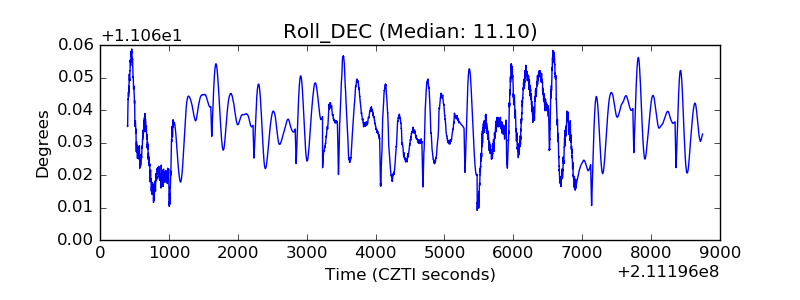 |
| _Roll_RA | 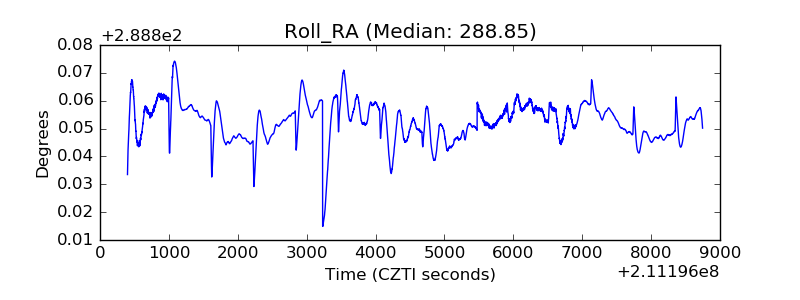 |
| Veto Counter | 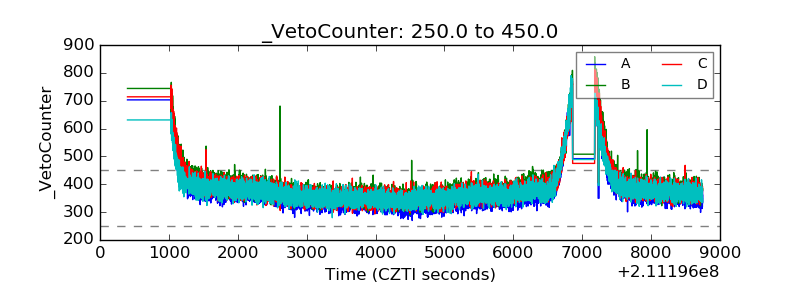 |