| Param | Original file | Final file |
|---|---|---|
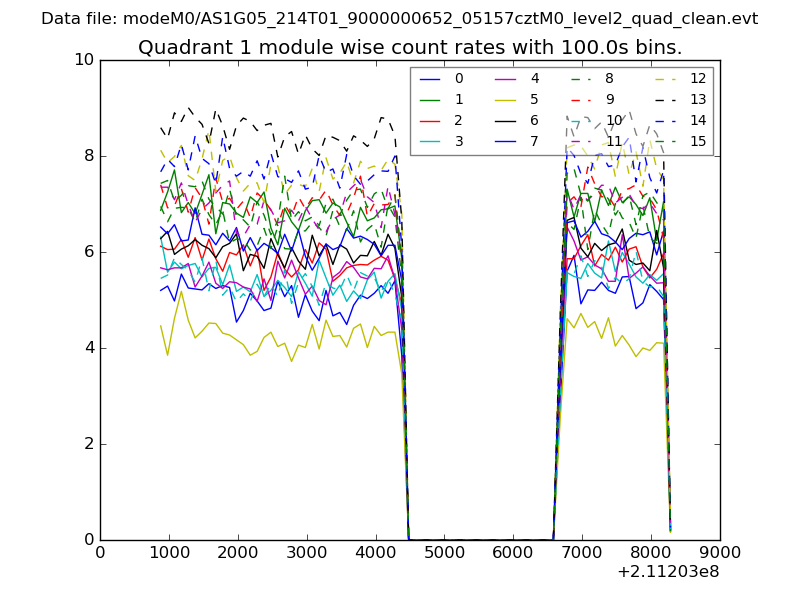
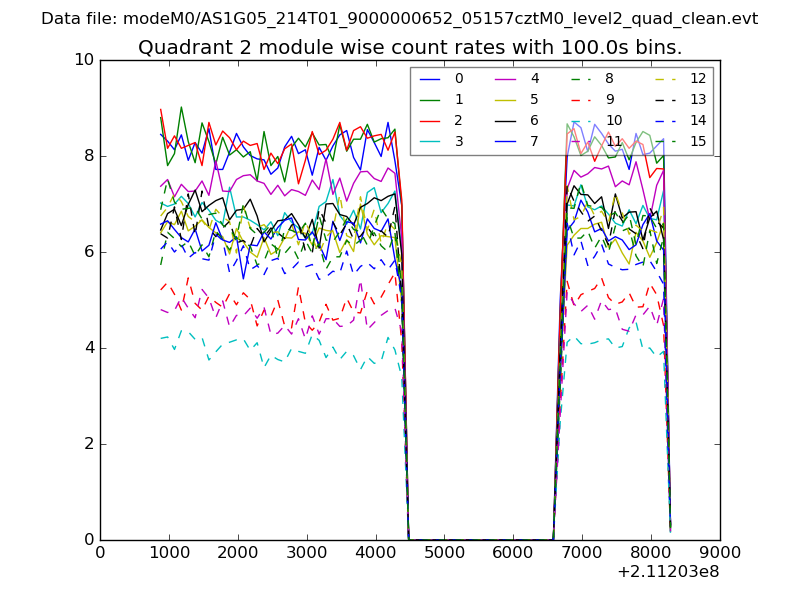
| Filename | modeM0/AS1G05_214T01_9000000652_05157cztM0_level2.evt | modeM0/AS1G05_214T01_9000000652_05157cztM0_level2_quad_clean.evt |
| Size (bytes) | 537,796,800 | 87,546,240 |
| Size | 512.9 MB | 83.5 MB |
| Events in quadrant A | 3,884,758 | 522,937 |
| Events in quadrant B | 4,033,934 | 527,611 |
| Events in quadrant C | 3,834,242 | 534,314 |
| Events in quadrant D | 3,988,822 | 508,443 |
| Mode SS | |||
|---|---|---|---|
| Quadrant | BADHDUFLAG | Total packets | Discarded packets |
| A | 0 | 162 | 0 |
| B | 0 | 162 | 0 |
| C | 0 | 162 | 0 |
| D | 0 | 162 | 0 |
| Mode M0 | |||
|---|---|---|---|
| Quadrant | BADHDUFLAG | Total packets | Discarded packets |
| A | 0 | 17046 | 4 |
| B | 0 | 17168 | 3 |
| C | 0 | 16823 | 3 |
| D | 0 | 17465 | 3 |
| Quadrant | Total seconds | Saturated seconds | Saturation percentage |
|---|---|---|---|
| A | 8019 | 328 | 4.090286% |
| B | 8019 | 327 | 4.077815% |
| C | 8019 | 163 | 2.032672% |
| D | 8020 | 239 | 2.980050% |
Noise dominated data is calculated using 1-second bins in cleaned event files. If a bin has >2000 counts, and if more than 50% of those come from <1% of pixels, then it is considered to be noise-dominated and hence unusable.
| Quadrant | # 1 sec bins | Bins with >0 counts | Bins with >2000 counts | High rate bins dominated by noise | Noise dominated (total time) | Noise dominated (detector-on time) | Marked lightcurve |
|---|---|---|---|---|---|---|---|
| A | 8104 | 8021 | 15 | 15 | 0.19% | 0.19% | 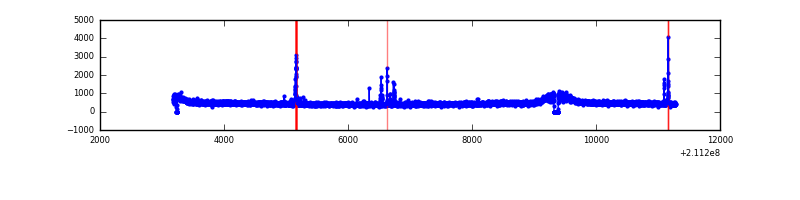 |
| B | 8104 | 8021 | 9 | 9 | 0.11% | 0.11% | 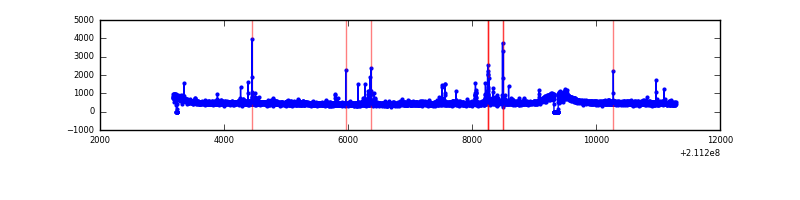 |
| C | 8104 | 8021 | 0 | 0 | 0.00% | 0.00% | 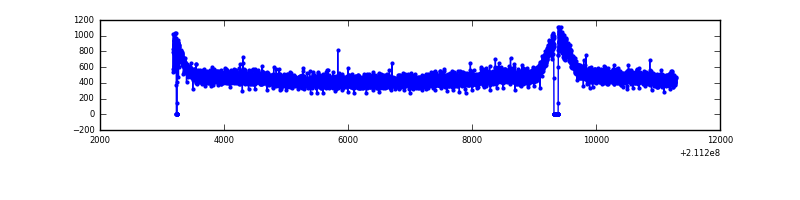 |
| D | 8105 | 8022 | 20 | 20 | 0.25% | 0.25% | 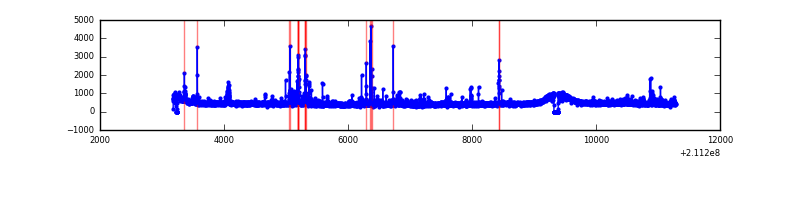 |
Top three noisy pixels from each quadrant. If the there are fewer than three noisy pixels in the level2.evt file, extra rows are filled as -1
| Pixel properties | Quadrant properties | ||||||
|---|---|---|---|---|---|---|---|
| Quadrant | DetID | PixID | Counts | Sigma | Mean | Median | Sigma |
| A | 0 | 50 | 107143 | 521.48 | 981 | 956 | 203.6 |
| A | 12 | 194 | 9851 | 43.68 | 981 | 956 | 203.6 |
| A | 0 | 226 | 9584 | 42.37 | 981 | 956 | 203.6 |
| B | 4 | 48 | 69339 | 353.16 | 988 | 961 | 193.6 |
| B | 15 | 204 | 35338 | 177.55 | 988 | 961 | 193.6 |
| B | 0 | 219 | 32190 | 161.29 | 988 | 961 | 193.6 |
| C | 1 | 16 | 81155 | 357.0 | 961 | 965 | 224.6 |
| C | 13 | 61 | 7581 | 29.45 | 961 | 965 | 224.6 |
| C | 14 | 67 | 2750 | 7.95 | 961 | 965 | 224.6 |
| D | 13 | 53 | 130634 | 543.27 | 964 | 934 | 238.7 |
| D | 10 | 15 | 55847 | 230.01 | 964 | 934 | 238.7 |
| D | 2 | 136 | 54504 | 224.39 | 964 | 934 | 238.7 |
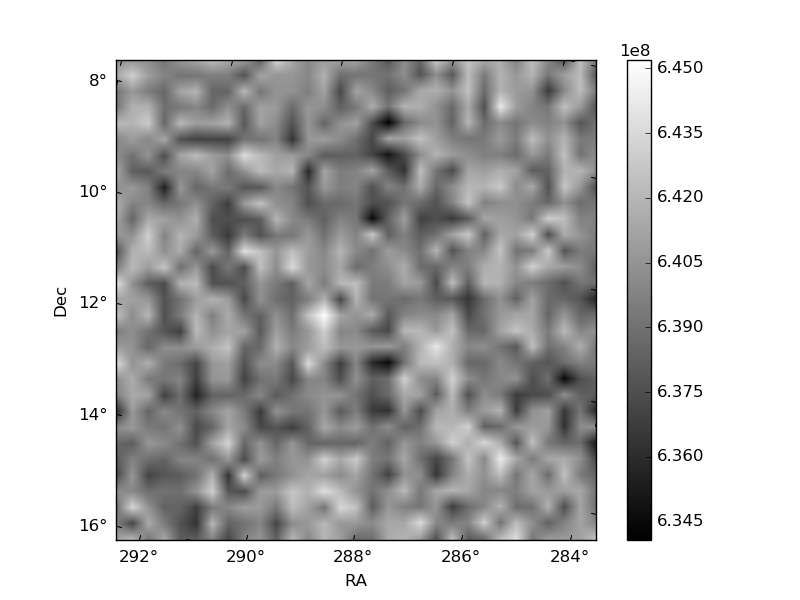
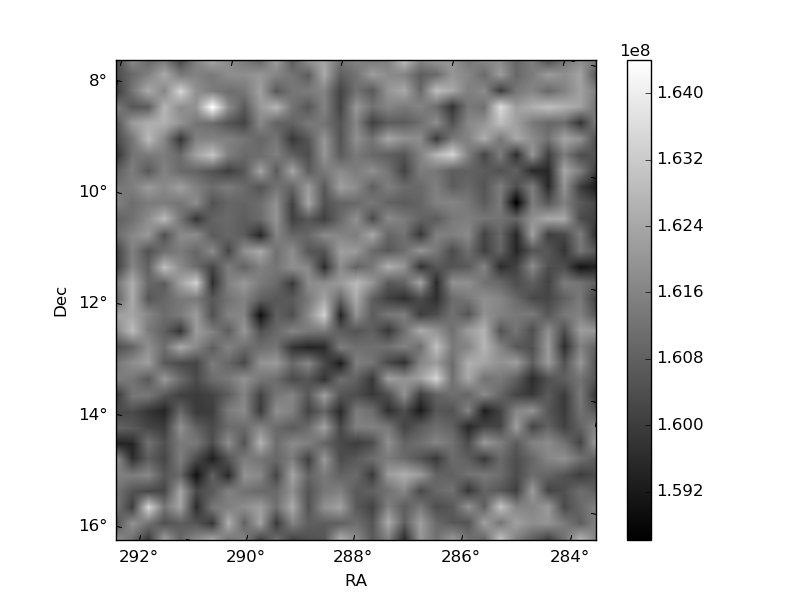
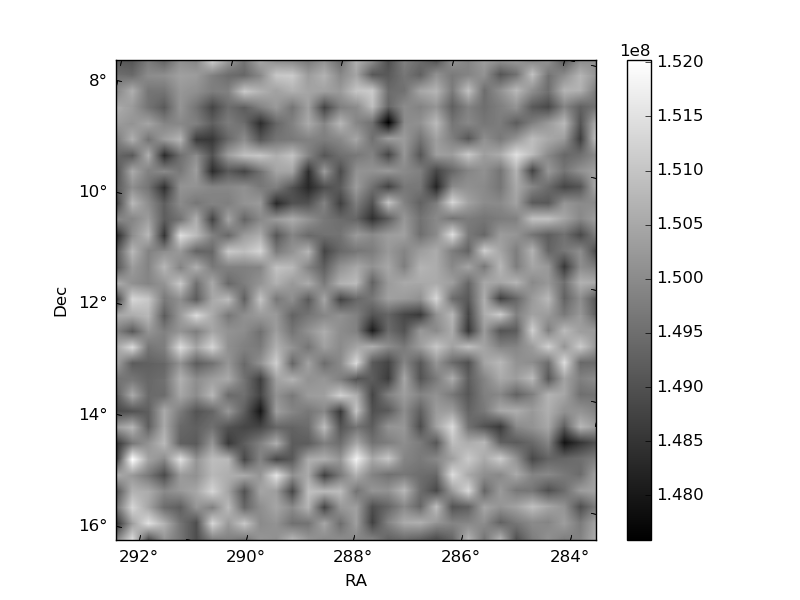
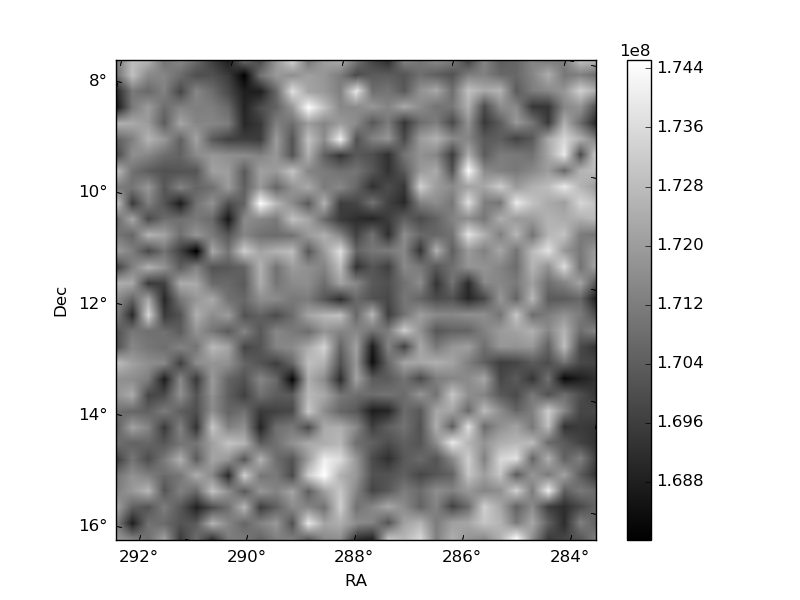
Histogram calculated using DETX and DETY for each event in the final _common_clean file
| Quadrant A | 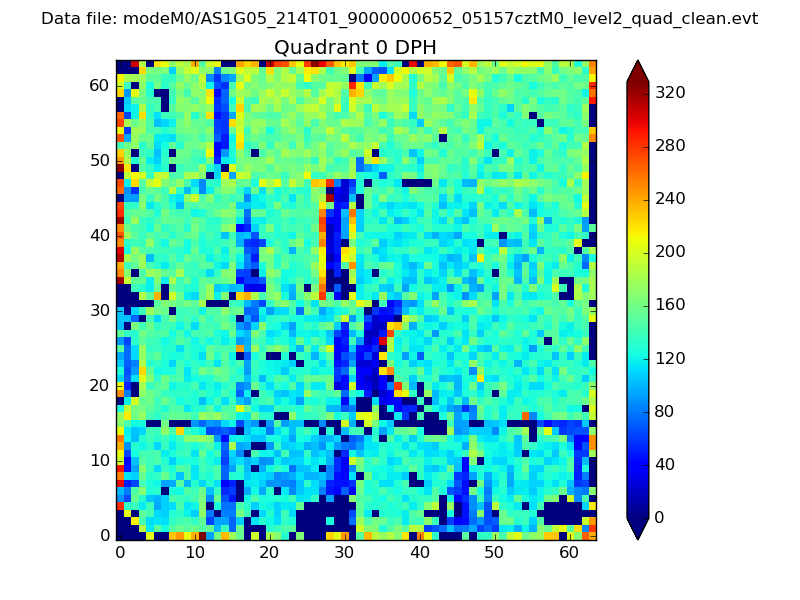 |
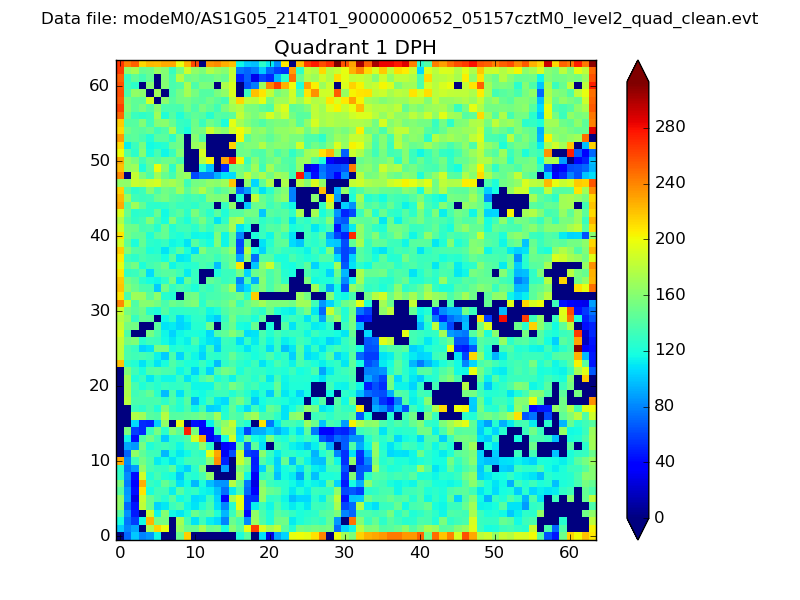 |
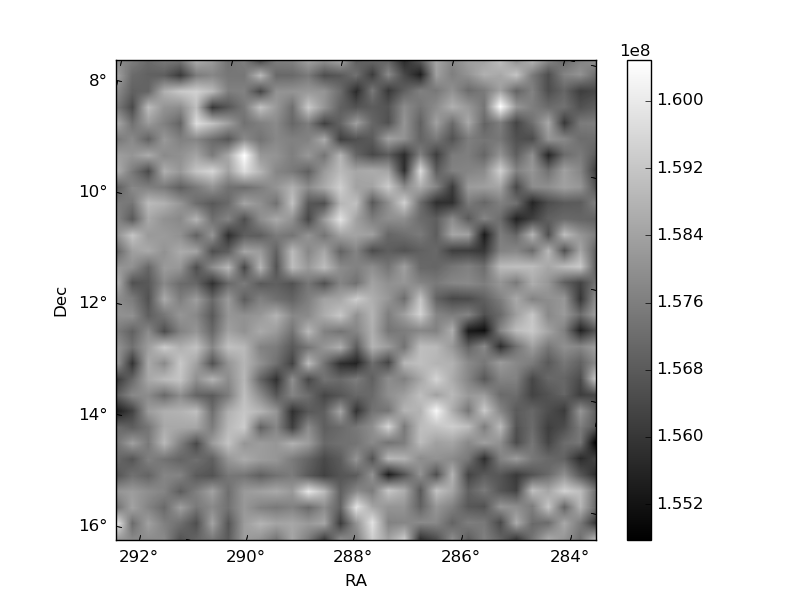
Quadrant B |
|---|---|---|---|
| Quadrant D | 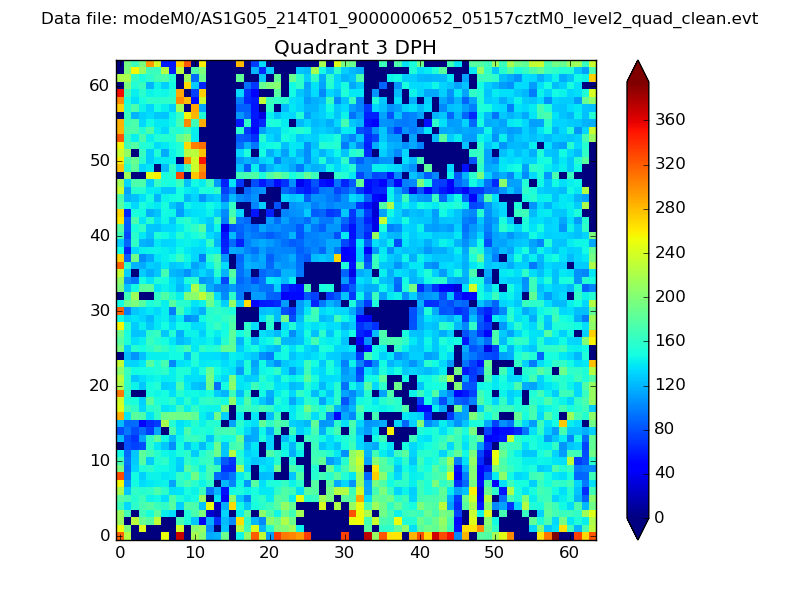 |
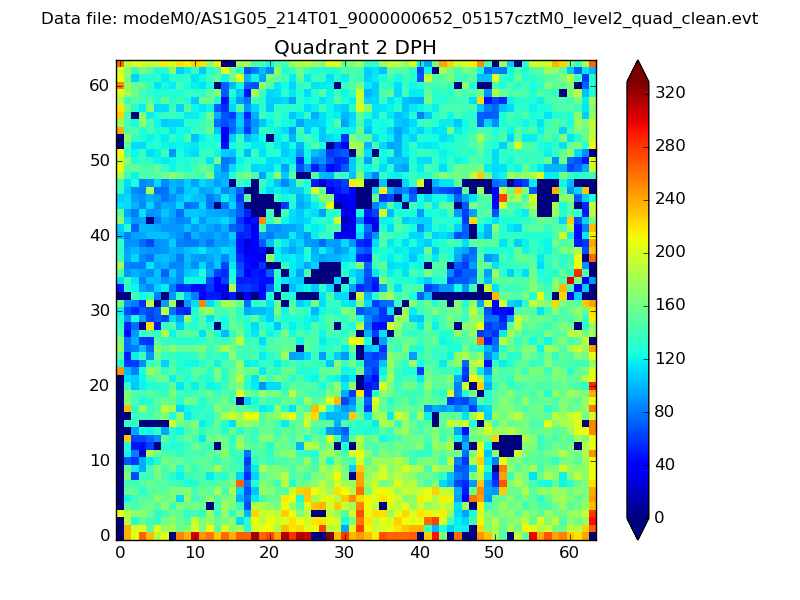 |
Quadrant C |
| Plot type | Count rate plots | Images |
|---|---|---|
| Comparison with Poisson distribution Blue bars denote a histogram of data divided into 1 sec bins. Red curve is a Poisson curve with rate = median count rate of data. |
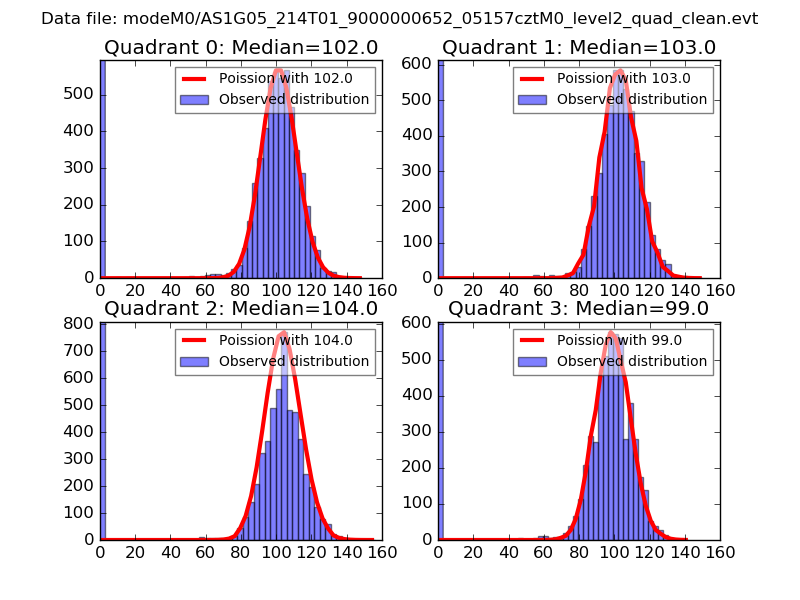 |
 |
| Quadrant-wise count rates Data is divided into 100 sec bins |
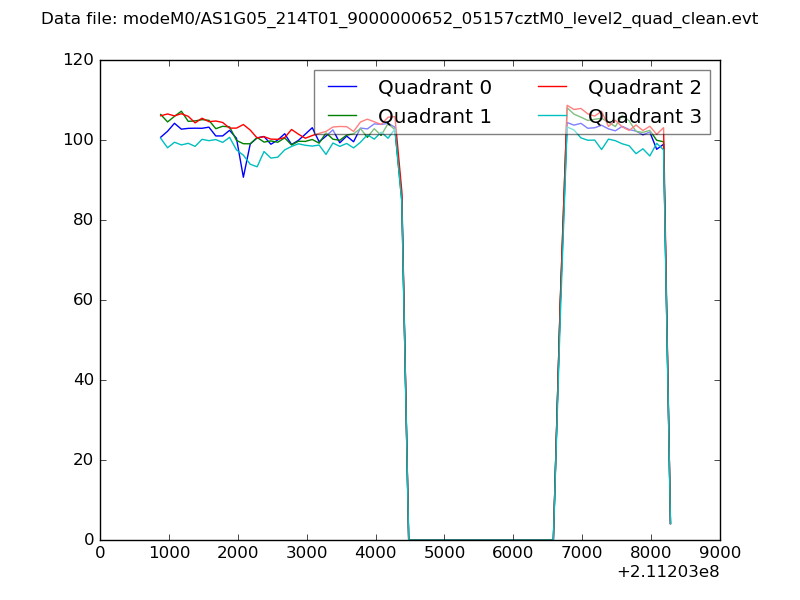 |
|
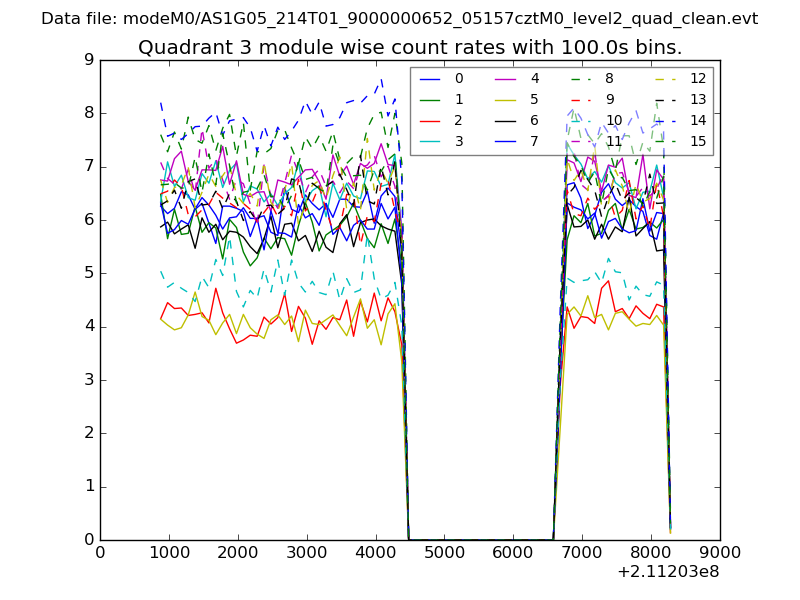
| Module-wise count rates for Quadrant A Data is divided into 100 sec bins |
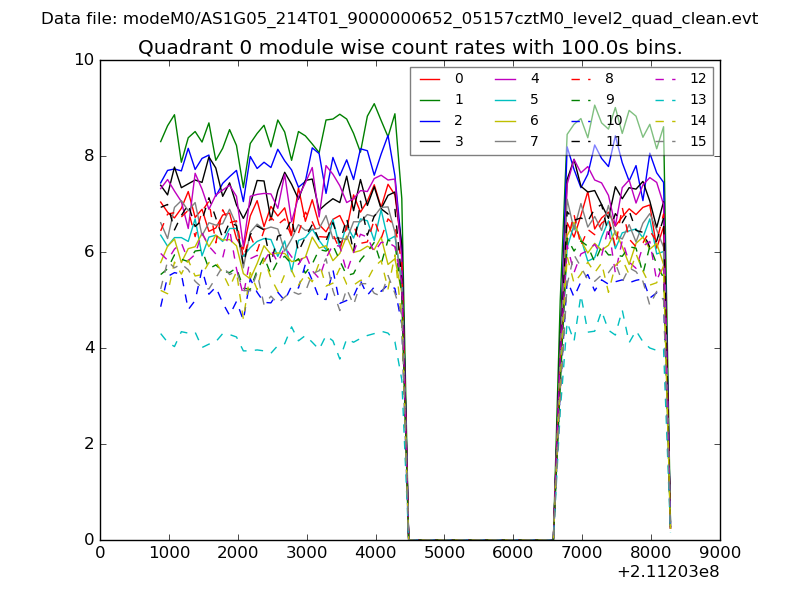 |
 |
| Module-wise count rates for Quadrant B Data is divided into 100 sec bins |
 |
 |
| Module-wise count rates for Quadrant C Data is divided into 100 sec bins |
 |
 |
| Module-wise count rates for Quadrant D Data is divided into 100 sec bins |
 |
 |
| Parameter | Plot |
|---|---|
| CZT HV Monitor | 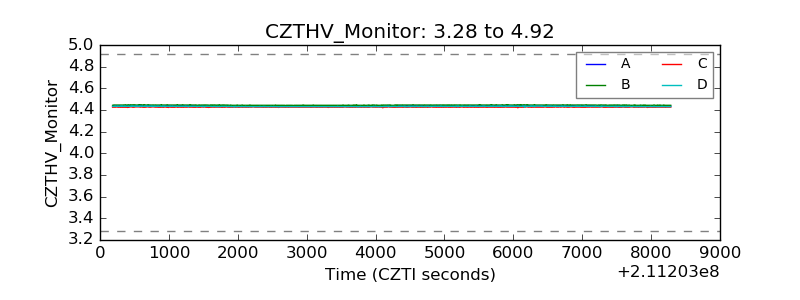 |
| D_VDD | 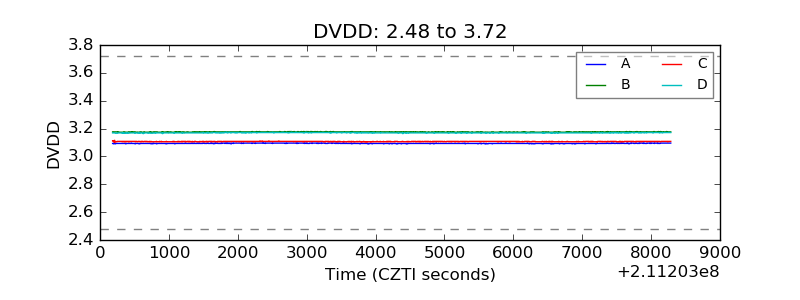 |
| Temperature 1 | 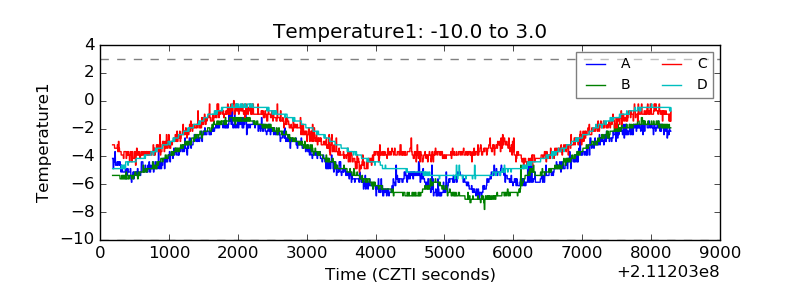 |
| Veto HV Monitor | 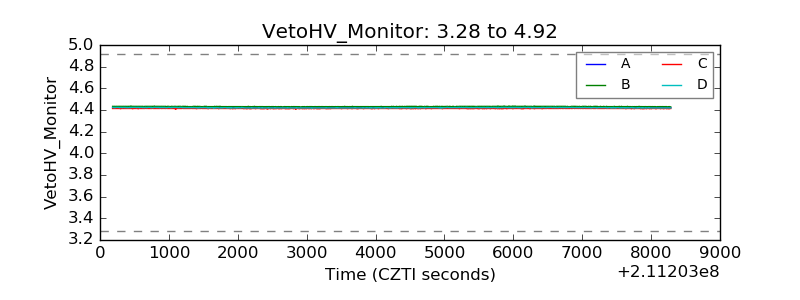 |
| Veto LLD | 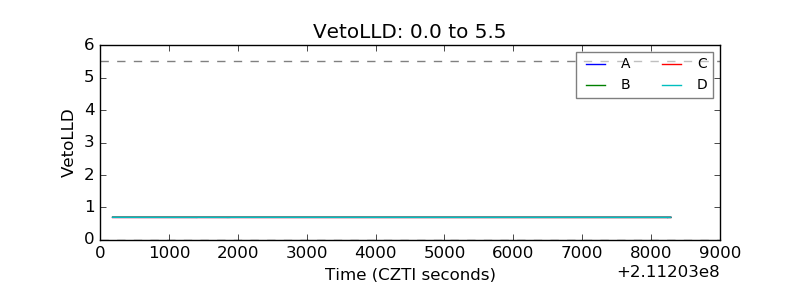 |
| Alpha Counter | 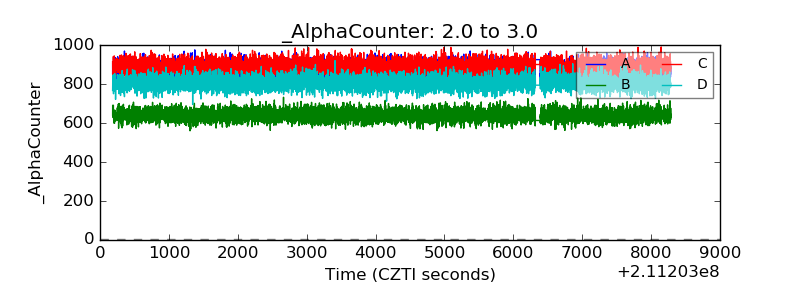 |
| _CPM_Rate | 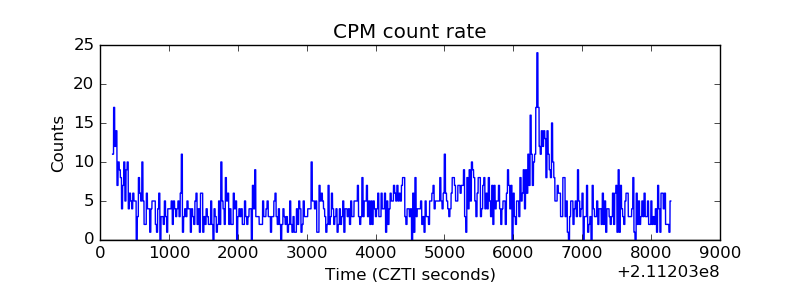 |
| CZT Counter | 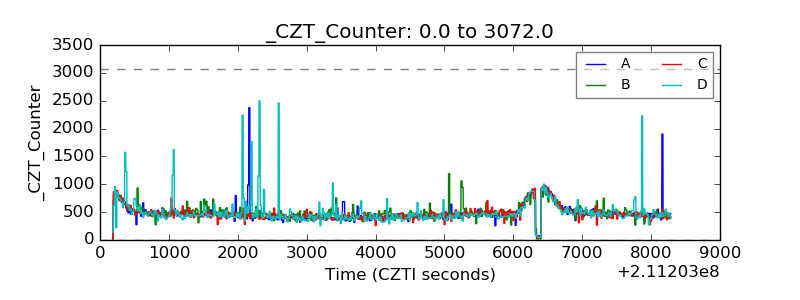 |
| +2.5 Volts monitor |  |
| +5 Volts monitor |  |
| _ROLL_ROT | 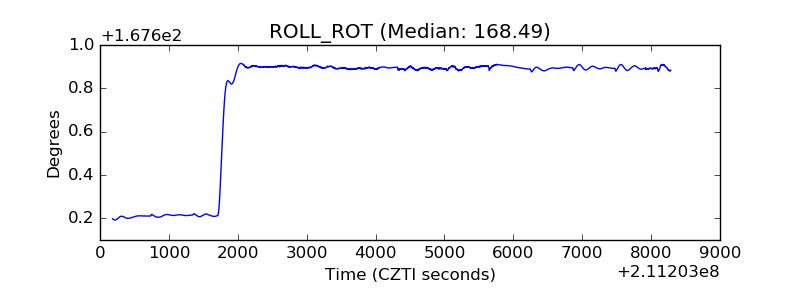 |
| _Roll_DEC |  |
| _Roll_RA | 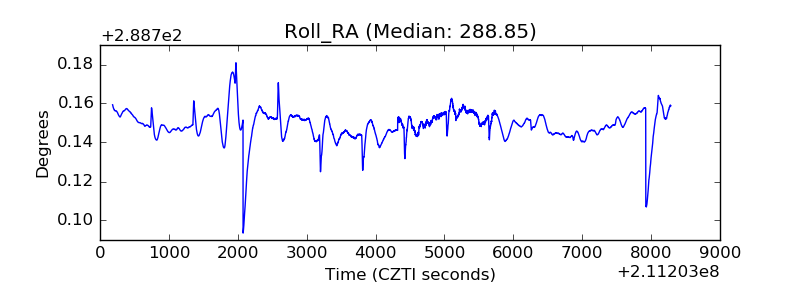 |
| Veto Counter | 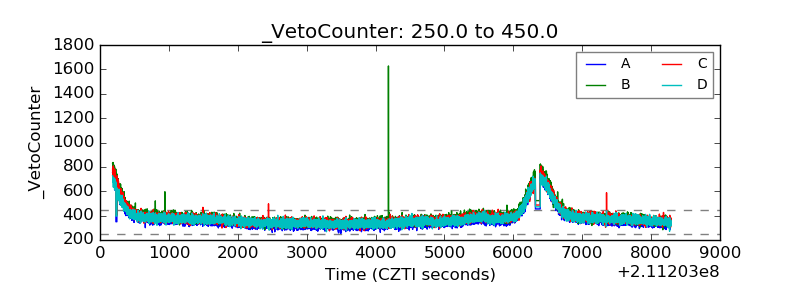 |