| Param | Original file | Final file |
|---|---|---|
| Filename | modeM0/AS1G05_214T01_9000000652_05162cztM0_level2.evt | modeM0/AS1G05_214T01_9000000652_05162cztM0_level2_quad_clean.evt |
| Size (bytes) | 470,139,840 | 78,189,120 |
| Size | 448.4 MB | 74.6 MB |
| Events in quadrant A | 3,142,668 | 479,458 |
| Events in quadrant B | 3,411,110 | 482,939 |
| Events in quadrant C | 2,992,233 | 488,439 |
| Events in quadrant D | 4,233,365 | 446,135 |
| Mode SS | |||
|---|---|---|---|
| Quadrant | BADHDUFLAG | Total packets | Discarded packets |
| A | 0 | 140 | 0 |
| B | 0 | 140 | 0 |
| C | 0 | 140 | 0 |
| D | 0 | 140 | 0 |
| Mode M9 | |||
|---|---|---|---|
| Quadrant | BADHDUFLAG | Total packets | Discarded packets |
| A | 0 | 13 | 0 |
| B | 0 | 13 | 0 |
| C | 0 | 13 | 0 |
| D | 0 | 14 | 0 |
| Mode M0 | |||
|---|---|---|---|
| Quadrant | BADHDUFLAG | Total packets | Discarded packets |
| A | 0 | 14038 | 3 |
| B | 0 | 14620 | 2 |
| C | 0 | 13635 | 2 |
| D | 0 | 17511 | 2 |
| Quadrant | Total seconds | Saturated seconds | Saturation percentage |
|---|---|---|---|
| A | 6741 | 39 | 0.578549% |
| B | 6741 | 42 | 0.623053% |
| C | 6741 | 13 | 0.192850% |
| D | 6741 | 360 | 5.340454% |
Noise dominated data is calculated using 1-second bins in cleaned event files. If a bin has >2000 counts, and if more than 50% of those come from <1% of pixels, then it is considered to be noise-dominated and hence unusable.
| Quadrant | # 1 sec bins | Bins with >0 counts | Bins with >2000 counts | High rate bins dominated by noise | Noise dominated (total time) | Noise dominated (detector-on time) | Marked lightcurve |
|---|---|---|---|---|---|---|---|
| A | 7736 | 6742 | 16 | 16 | 0.21% | 0.24% | 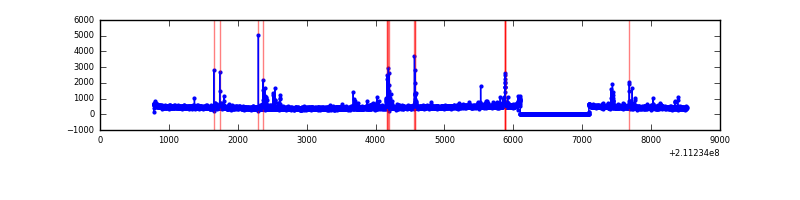 |
| B | 7736 | 6742 | 11 | 11 | 0.14% | 0.16% | 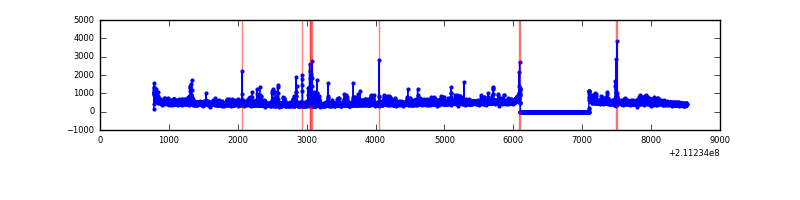 |
| C | 7736 | 6742 | 0 | 0 | 0.00% | 0.00% | 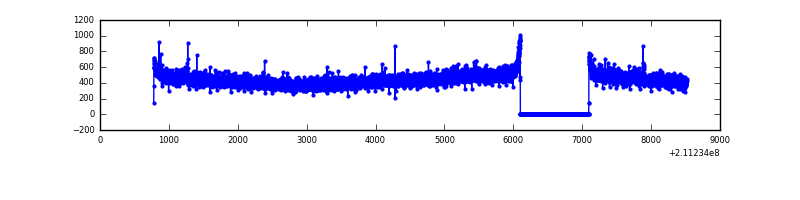 |
| D | 7736 | 6742 | 289 | 289 | 3.74% | 4.29% | 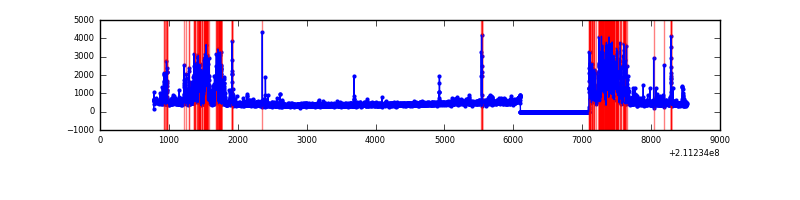 |
Top three noisy pixels from each quadrant. If the there are fewer than three noisy pixels in the level2.evt file, extra rows are filled as -1
| Pixel properties | Quadrant properties | ||||||
|---|---|---|---|---|---|---|---|
| Quadrant | DetID | PixID | Counts | Sigma | Mean | Median | Sigma |
| A | 4 | 2 | 98689 | 614.95 | 774 | 755 | 159.3 |
| A | 0 | 50 | 63881 | 396.38 | 774 | 755 | 159.3 |
| A | 12 | 194 | 7594 | 42.94 | 774 | 755 | 159.3 |
| B | 4 | 80 | 199451 | 1318.57 | 786 | 767 | 150.7 |
| B | 4 | 48 | 69913 | 458.89 | 786 | 767 | 150.7 |
| B | 15 | 54 | 58717 | 384.59 | 786 | 767 | 150.7 |
| C | 1 | 16 | 22900 | 124.94 | 760 | 765 | 177.2 |
| C | 13 | 61 | 6107 | 30.15 | 760 | 765 | 177.2 |
| C | 12 | 4 | 2216 | 8.19 | 760 | 765 | 177.2 |
| D | 2 | 33 | 1251602 | 6840.93 | 739 | 717 | 182.9 |
| D | 2 | 136 | 49484 | 266.7 | 739 | 717 | 182.9 |
| D | 2 | 14 | 48212 | 259.74 | 739 | 717 | 182.9 |
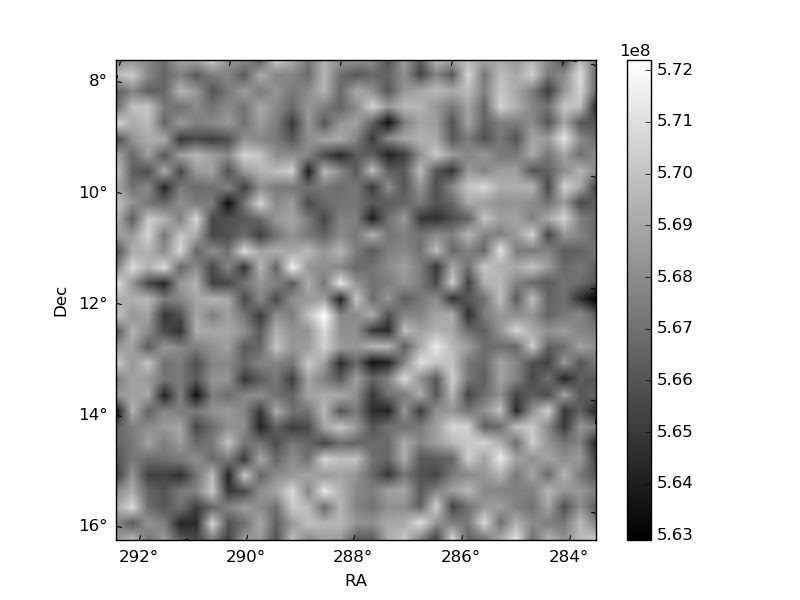
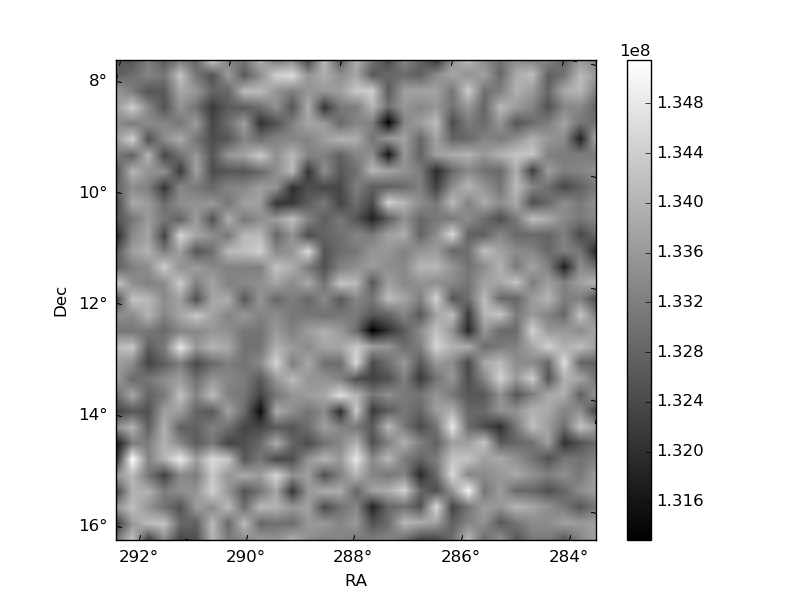
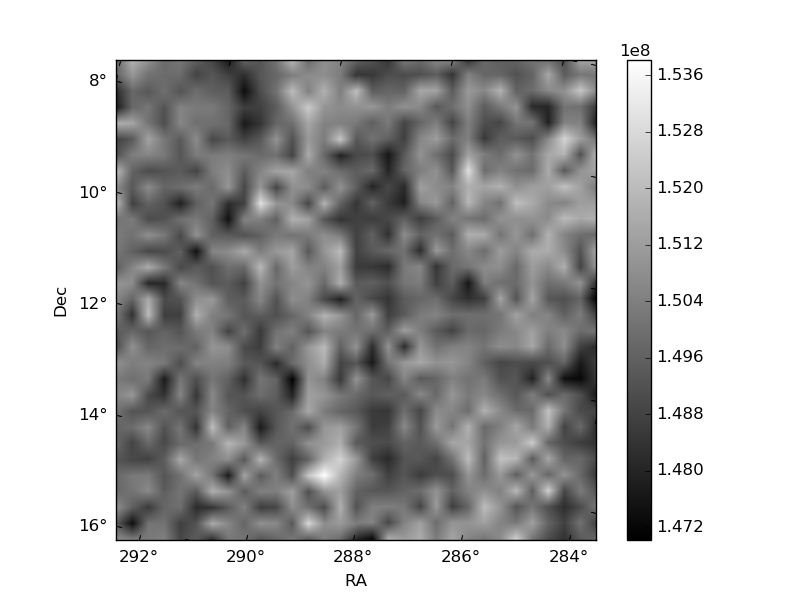
Histogram calculated using DETX and DETY for each event in the final _common_clean file
| Quadrant A | 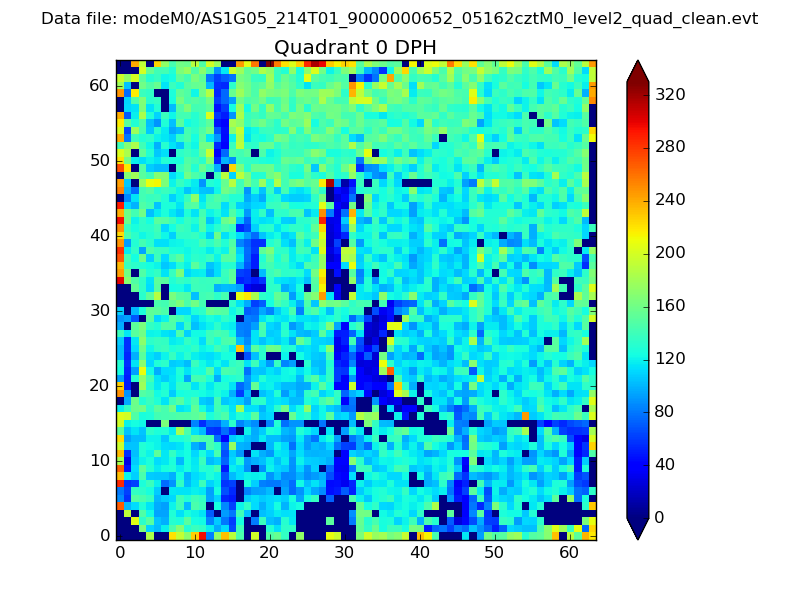 |
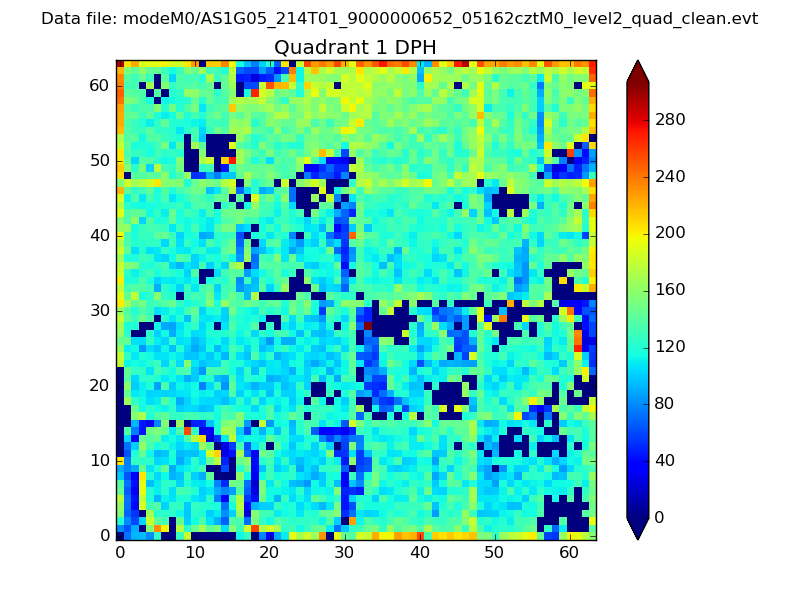 |
Quadrant B |
|---|---|---|---|
| Quadrant D | 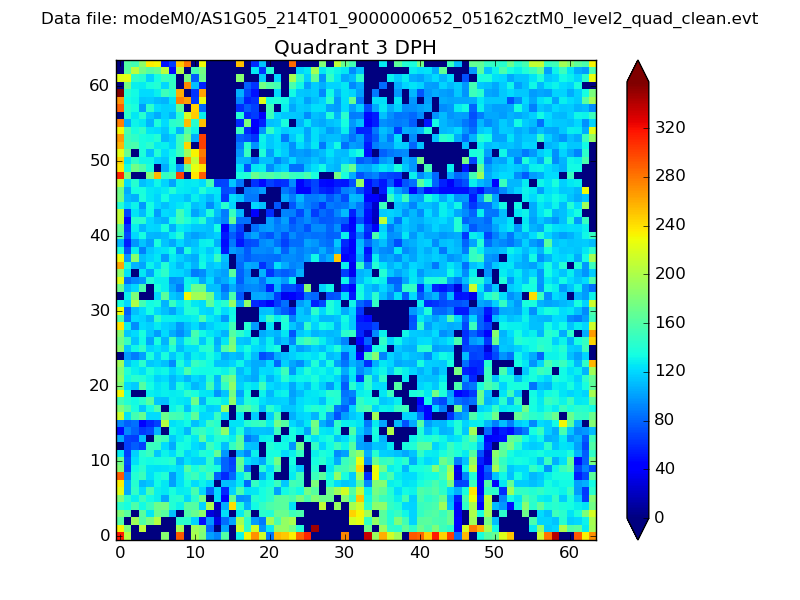 |
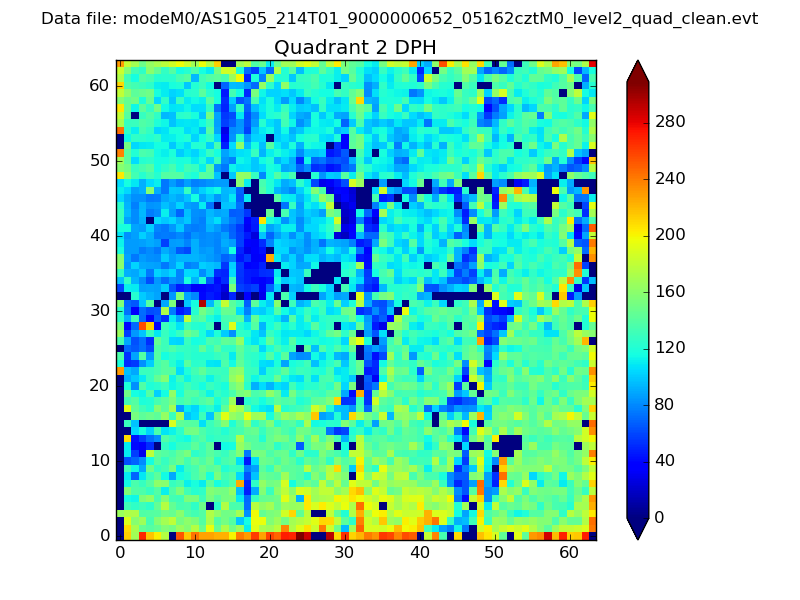 |
Quadrant C |
| Plot type | Count rate plots | Images |
|---|---|---|
| Comparison with Poisson distribution Blue bars denote a histogram of data divided into 1 sec bins. Red curve is a Poisson curve with rate = median count rate of data. |
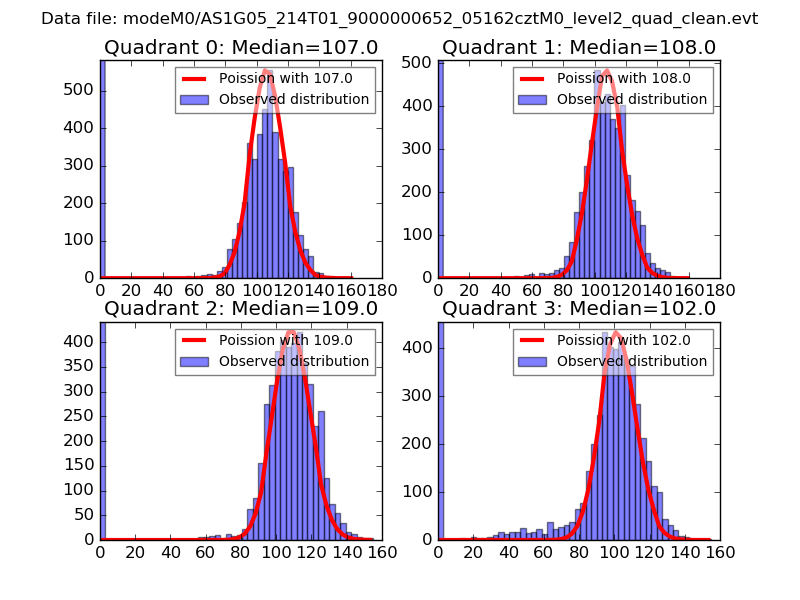 |
 |
| Quadrant-wise count rates Data is divided into 100 sec bins |
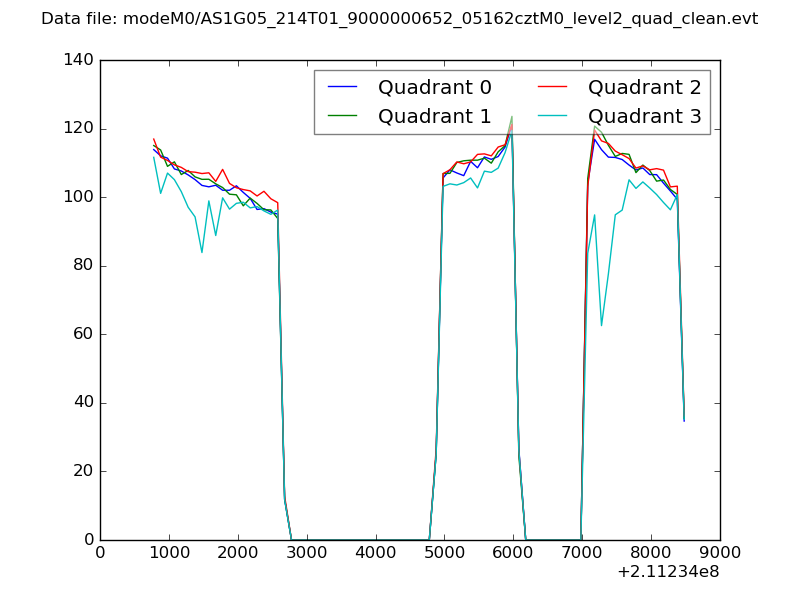 |
|
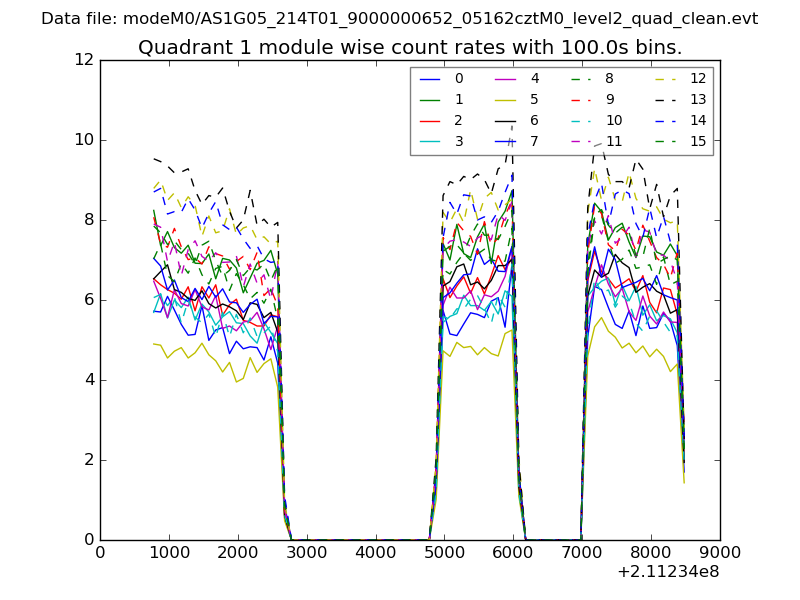
| Module-wise count rates for Quadrant A Data is divided into 100 sec bins |
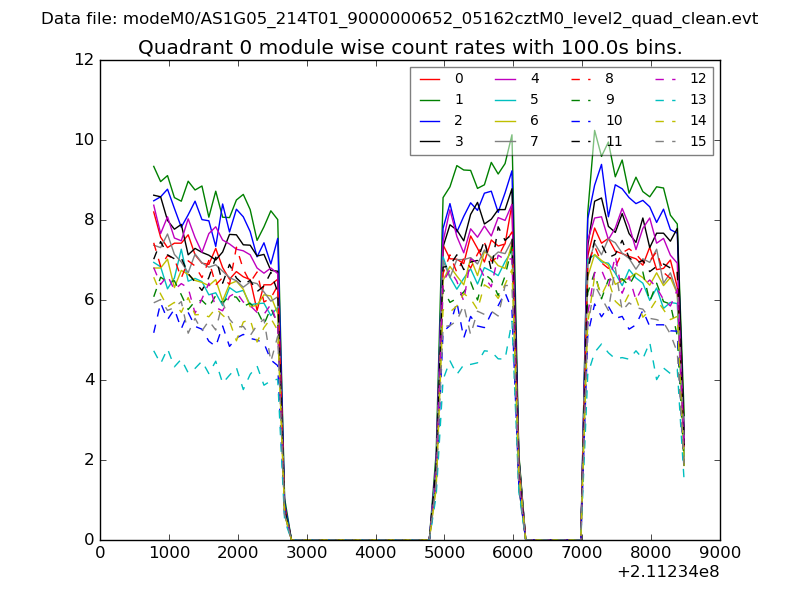 |
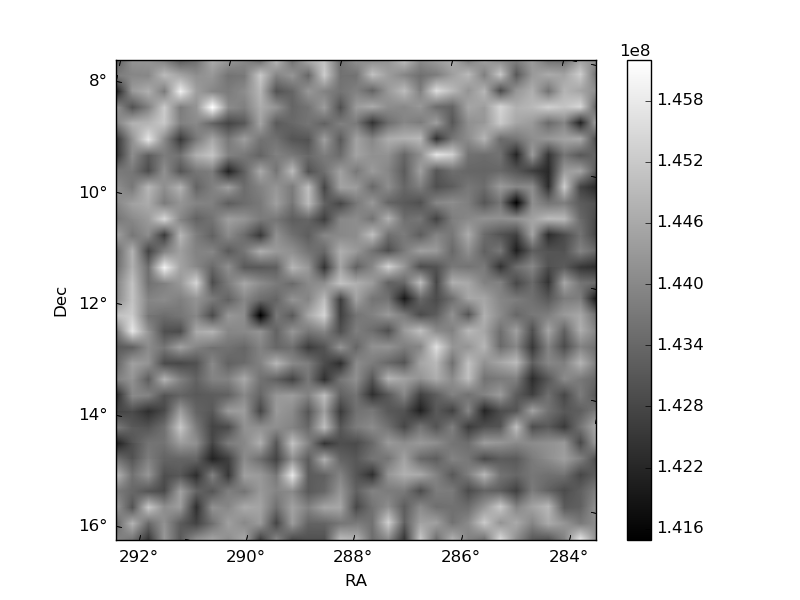 |
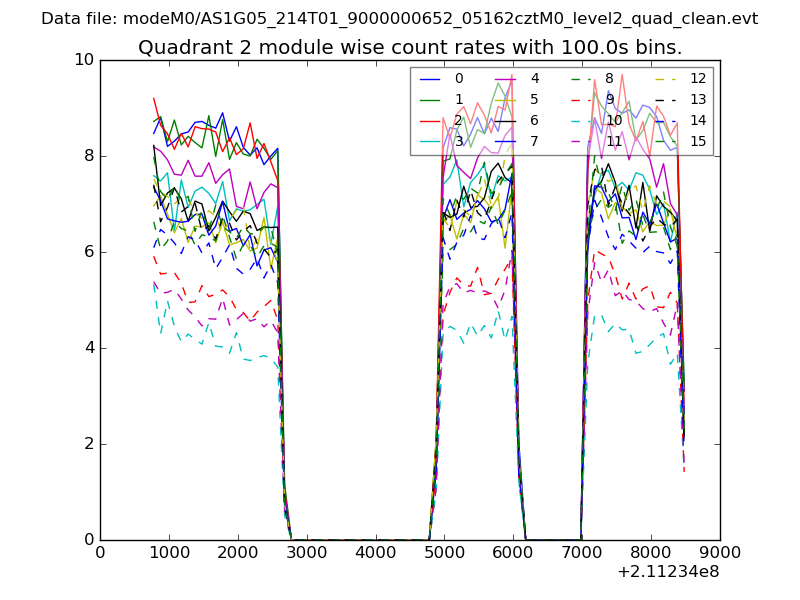
| Module-wise count rates for Quadrant B Data is divided into 100 sec bins |
 |
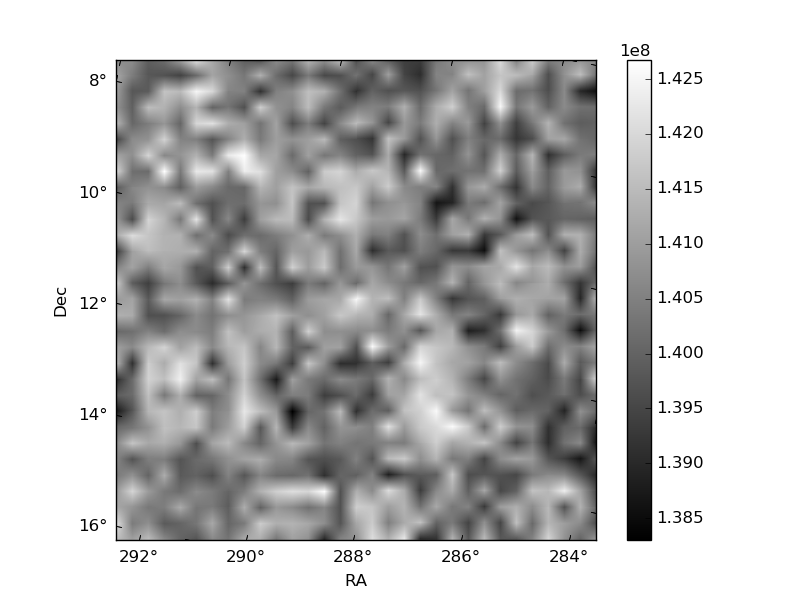 |
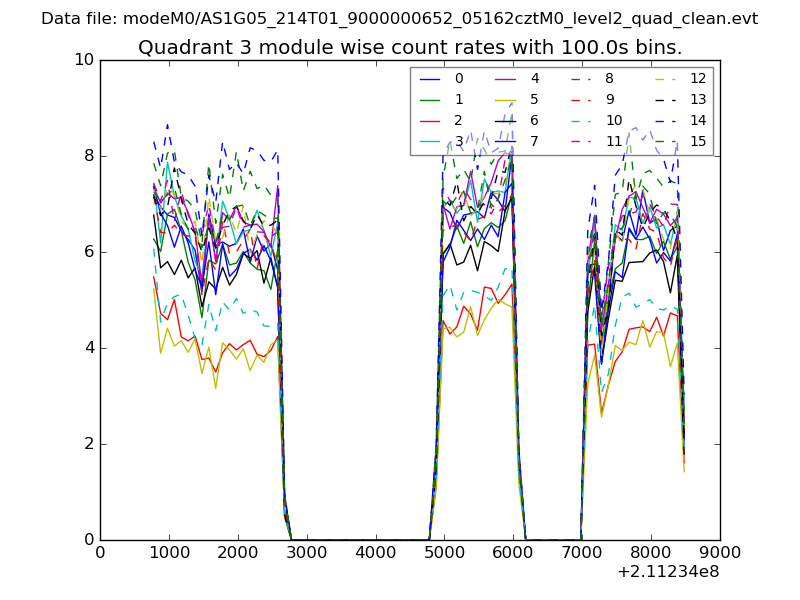
| Module-wise count rates for Quadrant C Data is divided into 100 sec bins |
 |
 |
| Module-wise count rates for Quadrant D Data is divided into 100 sec bins |
 |
 |
| Parameter | Plot |
|---|---|
| CZT HV Monitor | 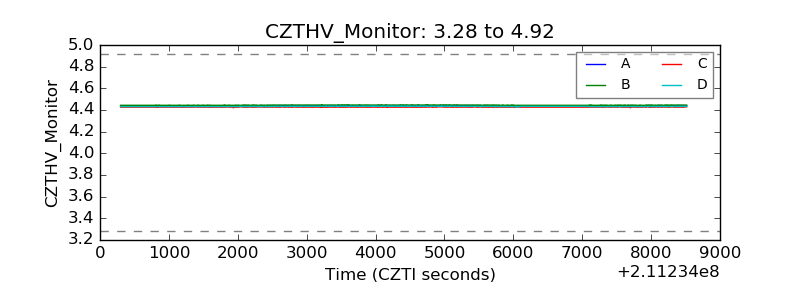 |
| D_VDD | 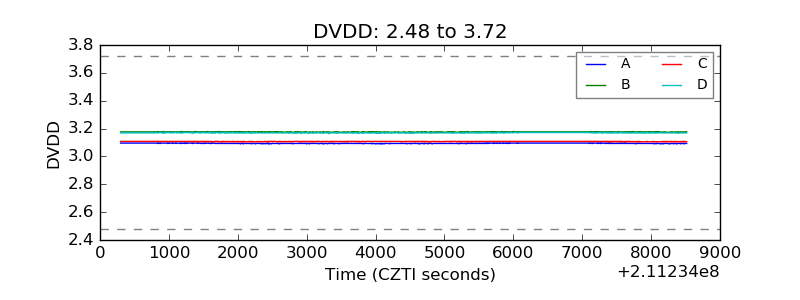 |
| Temperature 1 | 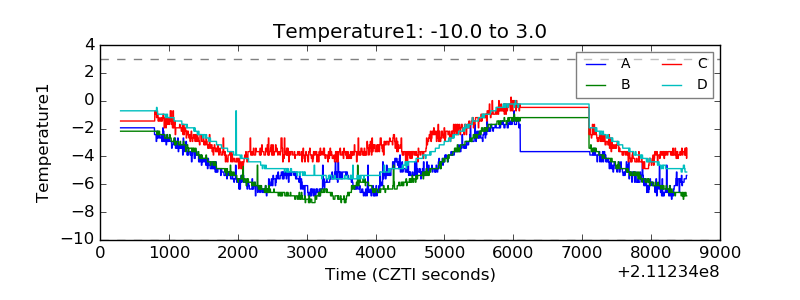 |
| Veto HV Monitor | 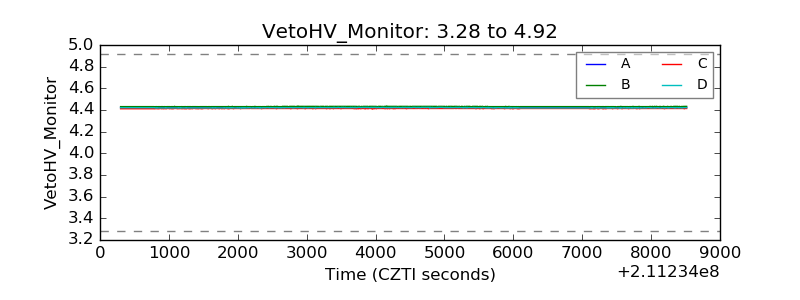 |
| Veto LLD | 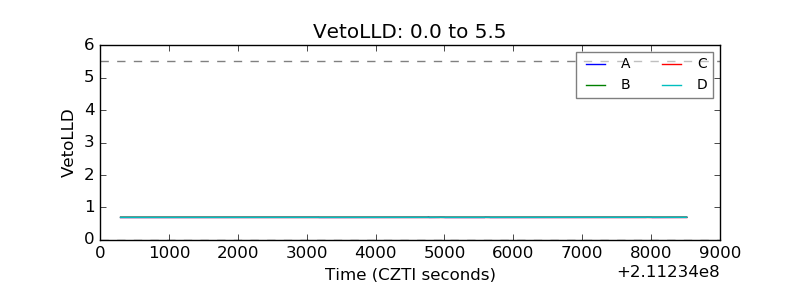 |
| Alpha Counter | 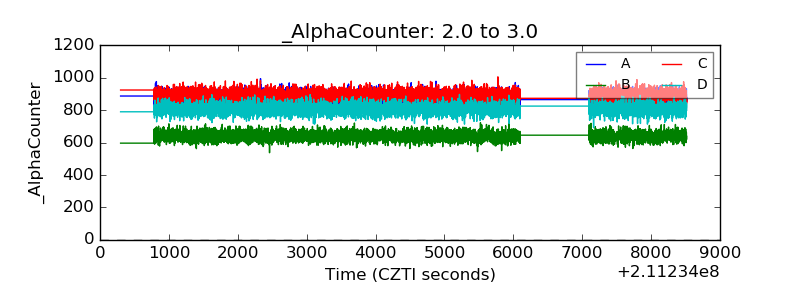 |
| _CPM_Rate | 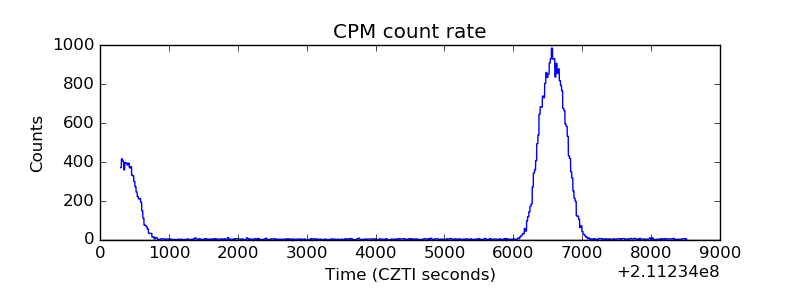 |
| CZT Counter | 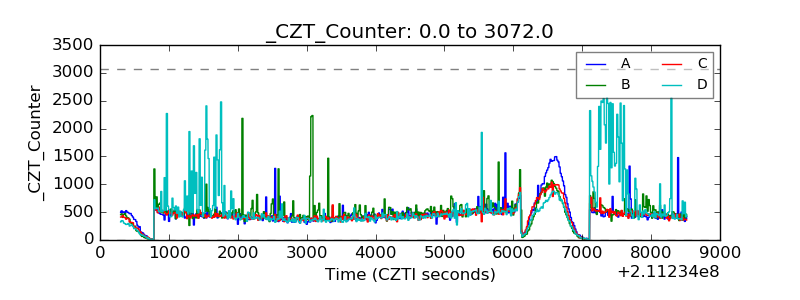 |
| +2.5 Volts monitor | 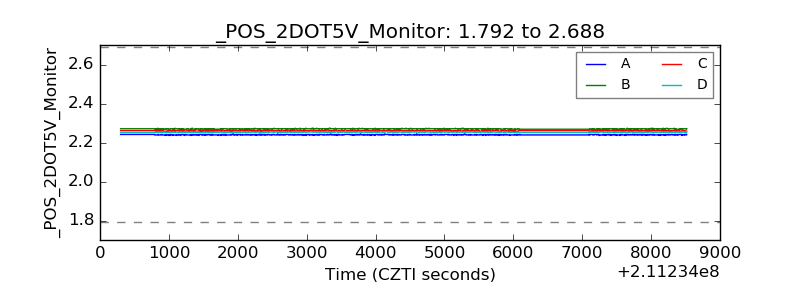 |
| +5 Volts monitor |  |
| _ROLL_ROT | 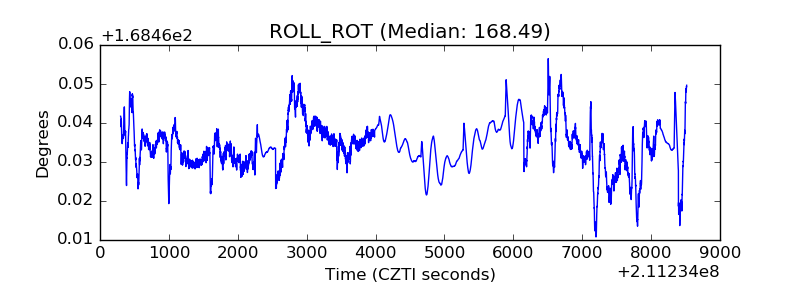 |
| _Roll_DEC | 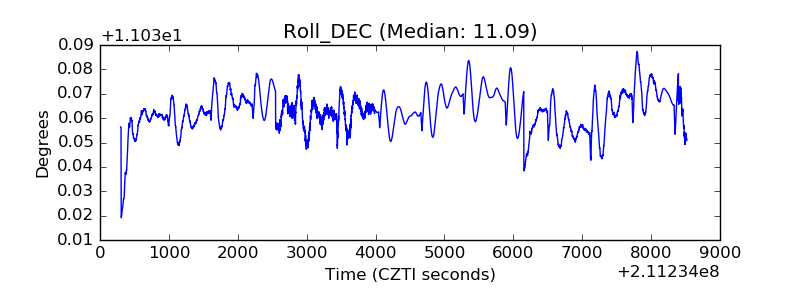 |
| _Roll_RA | 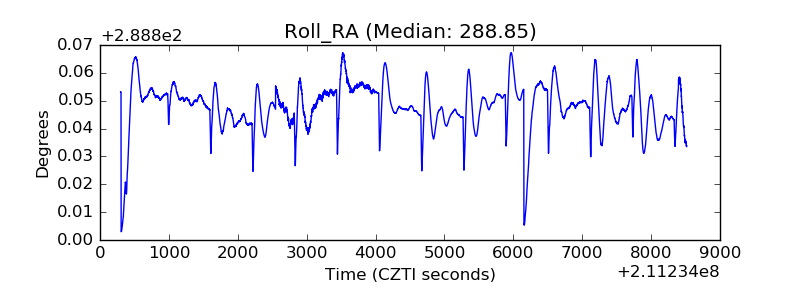 |
| Veto Counter | 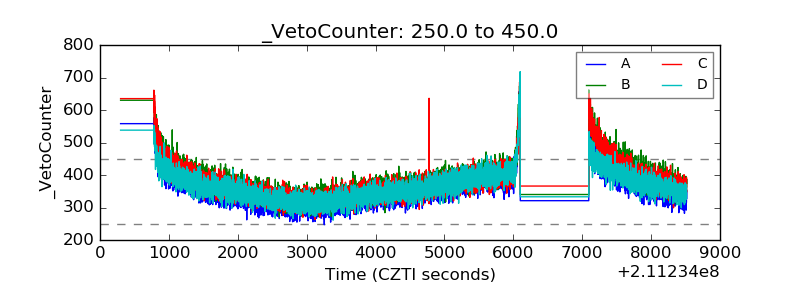 |