| Param | Original file | Final file |
|---|---|---|
| Filename | modeM0/AS1G05_214T01_9000000652_05164cztM0_level2.evt | modeM0/AS1G05_214T01_9000000652_05164cztM0_level2_quad_clean.evt |
| Size (bytes) | 435,438,720 | 71,910,720 |
| Size | 415.3 MB | 68.6 MB |
| Events in quadrant A | 2,957,974 | 438,834 |
| Events in quadrant B | 3,150,992 | 444,010 |
| Events in quadrant C | 2,872,697 | 444,622 |
| Events in quadrant D | 3,772,101 | 405,062 |
| Mode SS | |||
|---|---|---|---|
| Quadrant | BADHDUFLAG | Total packets | Discarded packets |
| A | 0 | 130 | 0 |
| B | 0 | 130 | 0 |
| C | 0 | 130 | 0 |
| D | 0 | 130 | 0 |
| Mode M9 | |||
|---|---|---|---|
| Quadrant | BADHDUFLAG | Total packets | Discarded packets |
| A | 0 | 11 | 0 |
| B | 0 | 11 | 0 |
| C | 0 | 11 | 0 |
| D | 0 | 11 | 0 |
| Mode M0 | |||
|---|---|---|---|
| Quadrant | BADHDUFLAG | Total packets | Discarded packets |
| A | 0 | 13163 | 3 |
| B | 0 | 13495 | 2 |
| C | 0 | 12905 | 2 |
| D | 0 | 15856 | 2 |
| Quadrant | Total seconds | Saturated seconds | Saturation percentage |
|---|---|---|---|
| A | 6372 | 31 | 0.486503% |
| B | 6372 | 36 | 0.564972% |
| C | 6372 | 19 | 0.298180% |
| D | 6373 | 268 | 4.205241% |
Noise dominated data is calculated using 1-second bins in cleaned event files. If a bin has >2000 counts, and if more than 50% of those come from <1% of pixels, then it is considered to be noise-dominated and hence unusable.
| Quadrant | # 1 sec bins | Bins with >0 counts | Bins with >2000 counts | High rate bins dominated by noise | Noise dominated (total time) | Noise dominated (detector-on time) | Marked lightcurve |
|---|---|---|---|---|---|---|---|
| A | 7477 | 6373 | 5 | 5 | 0.07% | 0.08% | 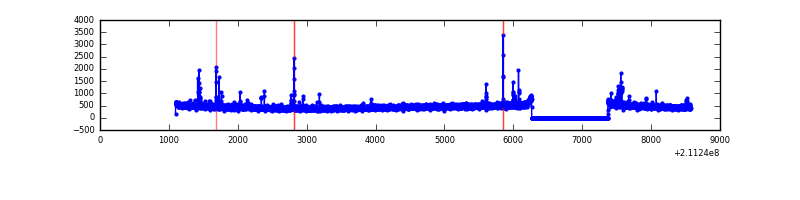 |
| B | 7477 | 6373 | 5 | 5 | 0.07% | 0.08% | 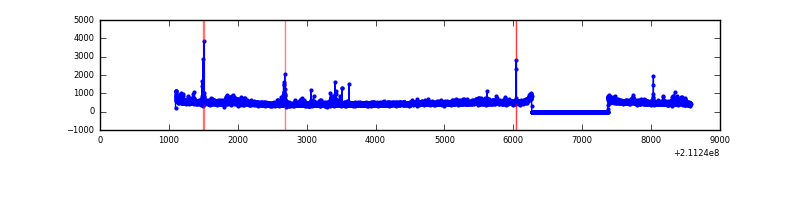 |
| C | 7477 | 6373 | 0 | 0 | 0.00% | 0.00% | 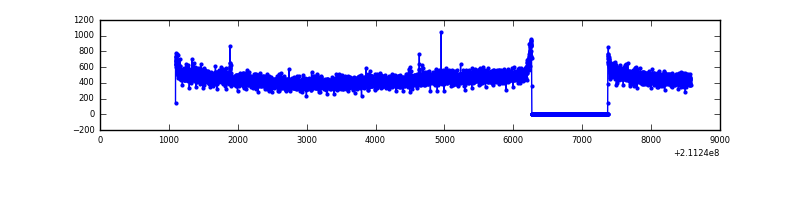 |
| D | 7478 | 6374 | 200 | 200 | 2.67% | 3.14% | 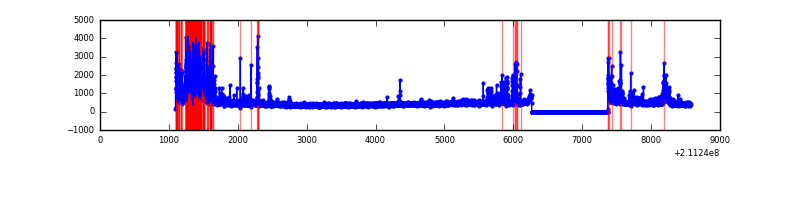 |
Top three noisy pixels from each quadrant. If the there are fewer than three noisy pixels in the level2.evt file, extra rows are filled as -1
| Pixel properties | Quadrant properties | ||||||
|---|---|---|---|---|---|---|---|
| Quadrant | DetID | PixID | Counts | Sigma | Mean | Median | Sigma |
| A | 0 | 50 | 69466 | 450.56 | 744 | 727 | 152.6 |
| A | 4 | 2 | 23919 | 152.02 | 744 | 727 | 152.6 |
| A | 12 | 194 | 7433 | 43.96 | 744 | 727 | 152.6 |
| B | 4 | 48 | 96410 | 657.41 | 757 | 737 | 145.5 |
| B | 4 | 80 | 60148 | 408.24 | 757 | 737 | 145.5 |
| B | 0 | 219 | 27483 | 183.78 | 757 | 737 | 145.5 |
| C | 1 | 16 | 26664 | 152.15 | 729 | 734 | 170.4 |
| C | 13 | 61 | 5892 | 30.27 | 729 | 734 | 170.4 |
| C | 0 | 207 | 2517 | 10.46 | 729 | 734 | 170.4 |
| D | 2 | 33 | 739469 | 4237.81 | 710 | 689 | 174.3 |
| D | 12 | 233 | 109798 | 625.87 | 710 | 689 | 174.3 |
| D | 13 | 53 | 79882 | 454.27 | 710 | 689 | 174.3 |
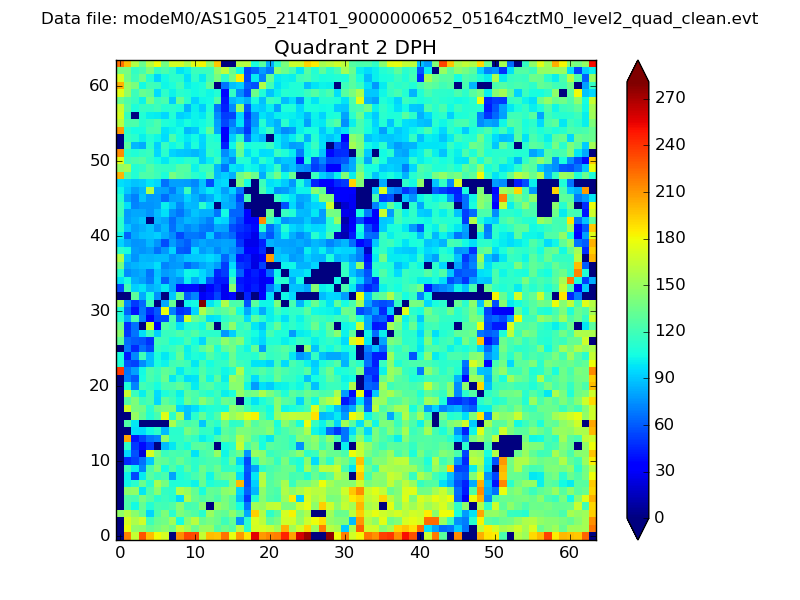
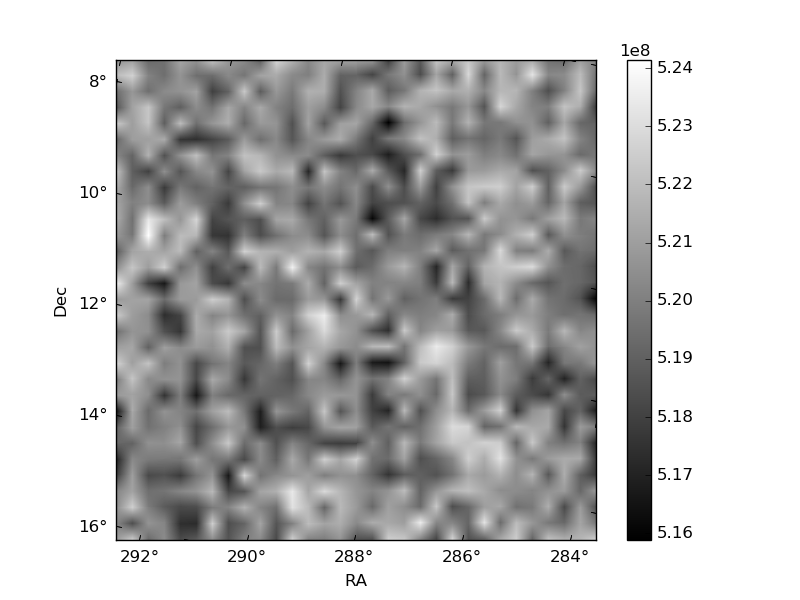
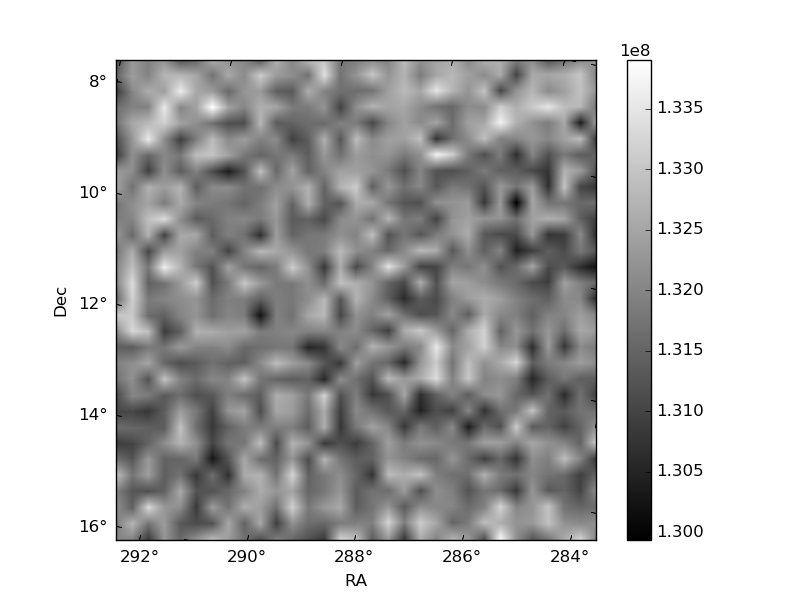
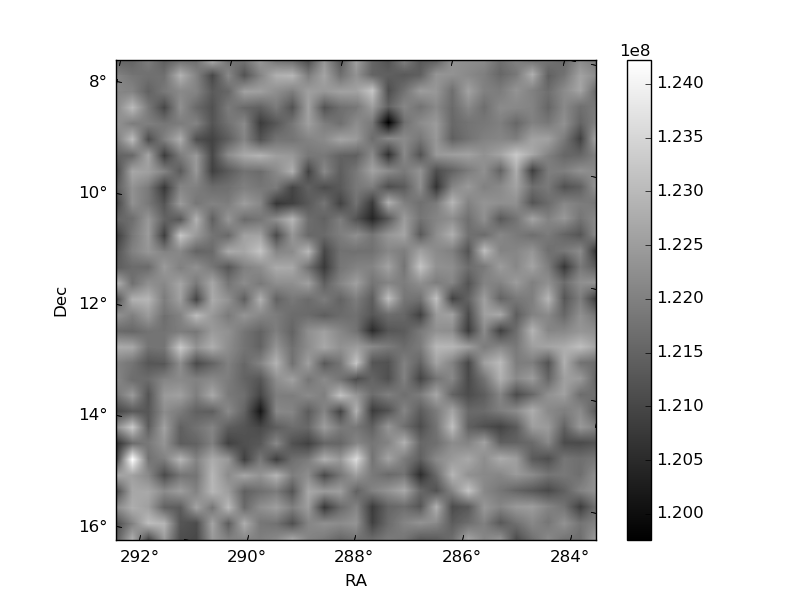
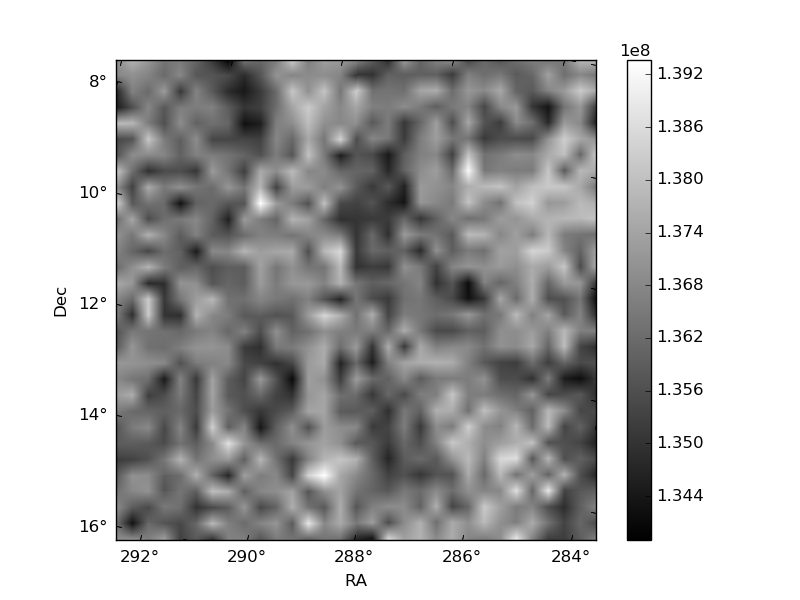
Histogram calculated using DETX and DETY for each event in the final _common_clean file
| Quadrant A | 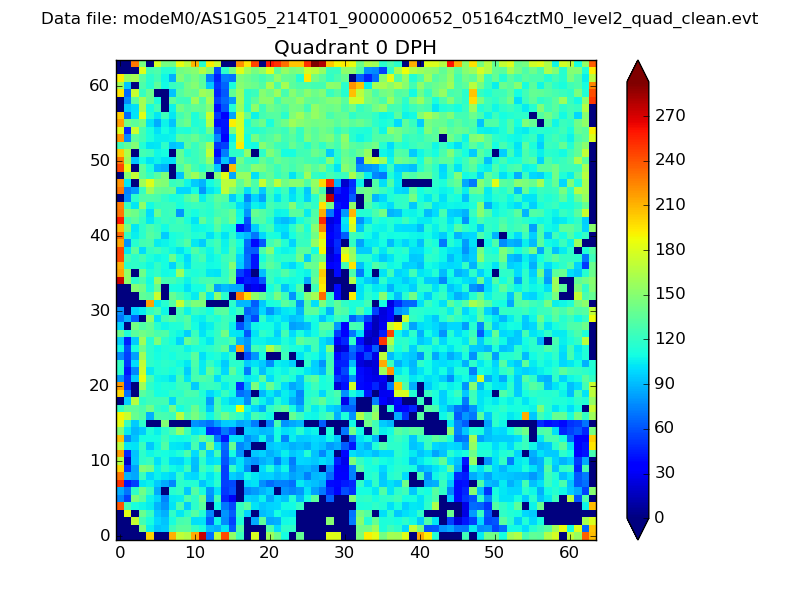 |
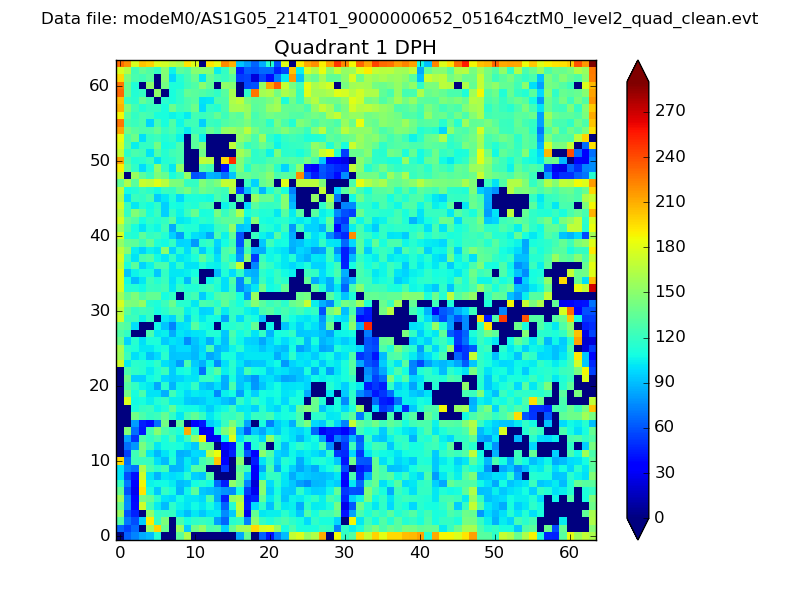 |
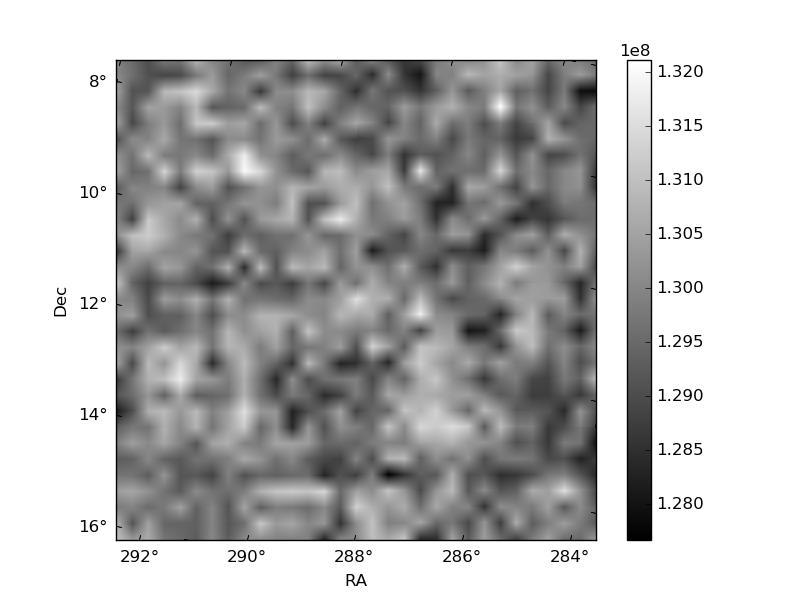
Quadrant B |
|---|---|---|---|
| Quadrant D | 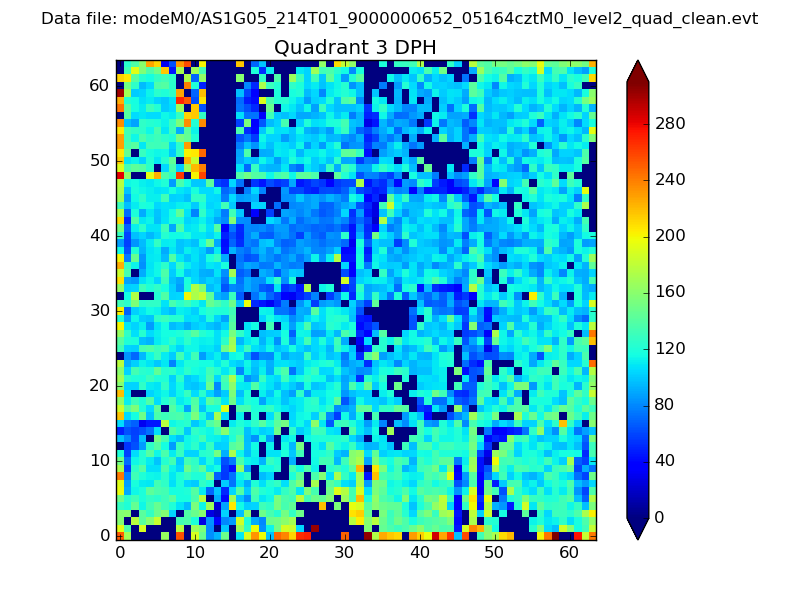 |
 |
Quadrant C |
| Plot type | Count rate plots | Images |
|---|---|---|
| Comparison with Poisson distribution Blue bars denote a histogram of data divided into 1 sec bins. Red curve is a Poisson curve with rate = median count rate of data. |
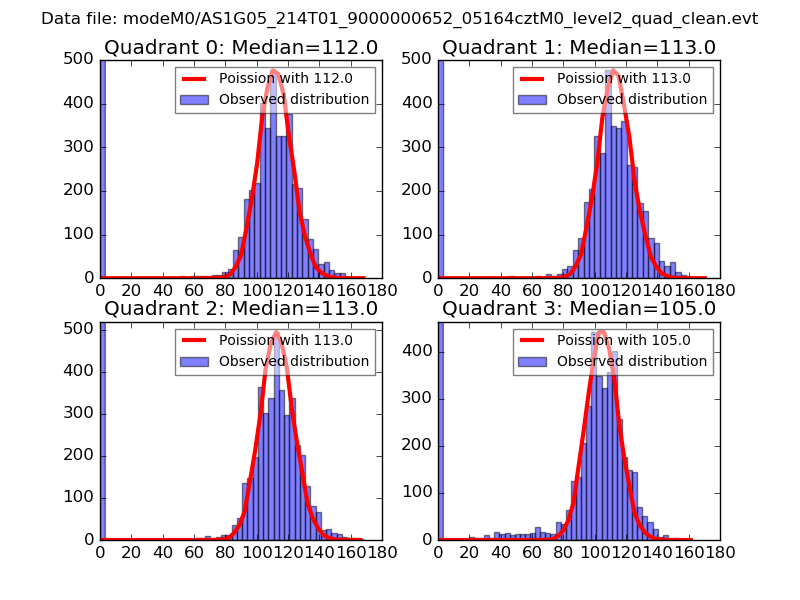 |
 |
| Quadrant-wise count rates Data is divided into 100 sec bins |
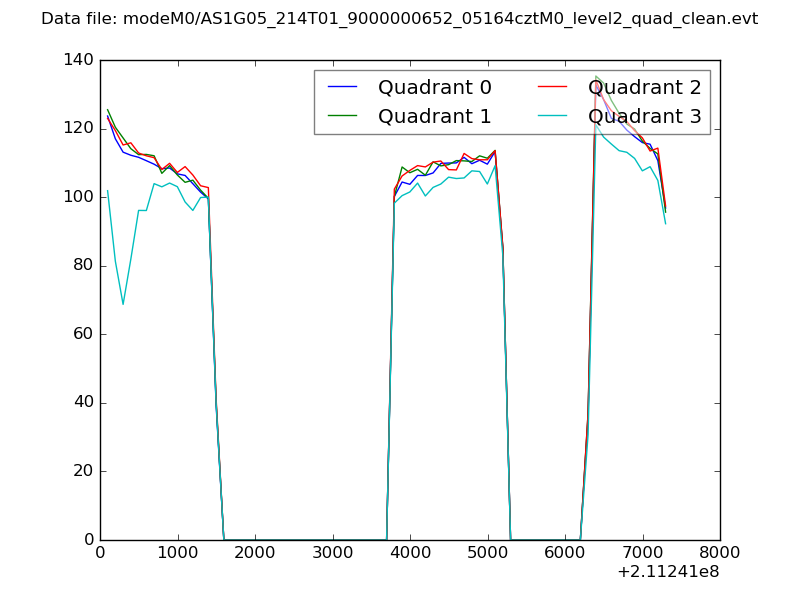 |
|
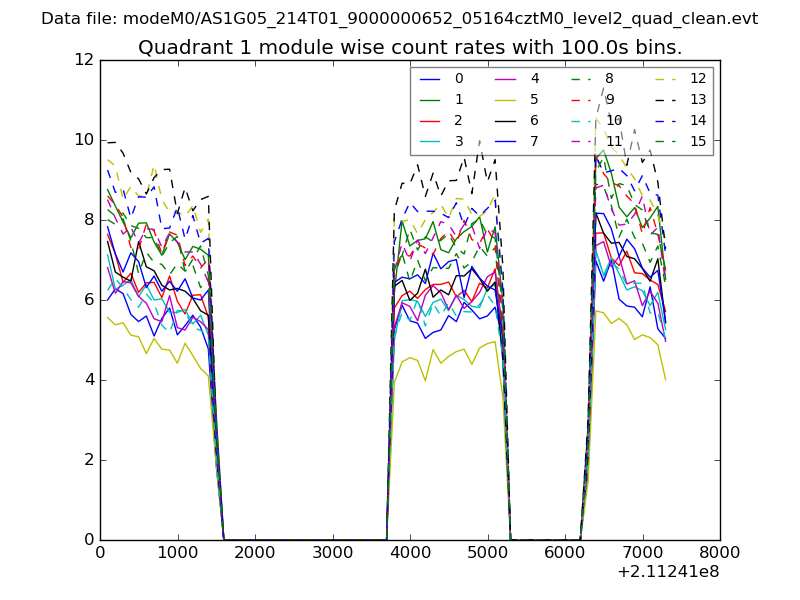
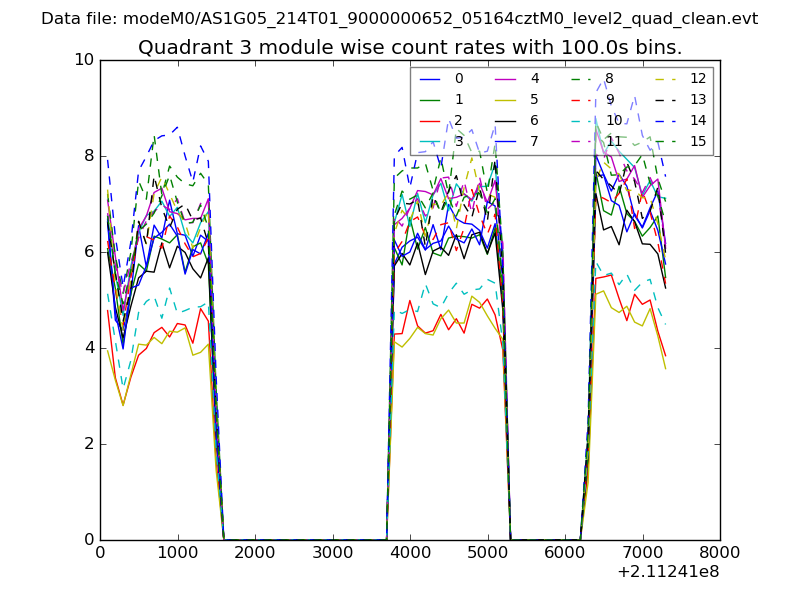
| Module-wise count rates for Quadrant A Data is divided into 100 sec bins |
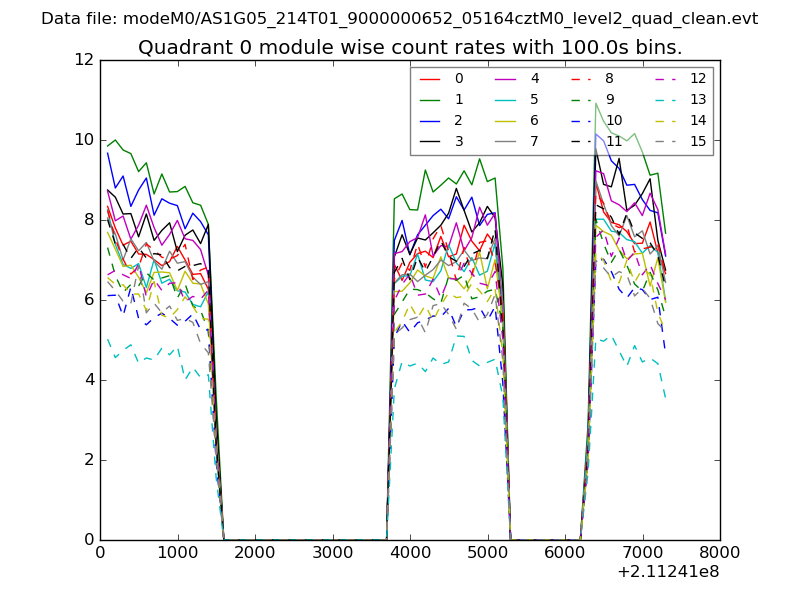 |
 |
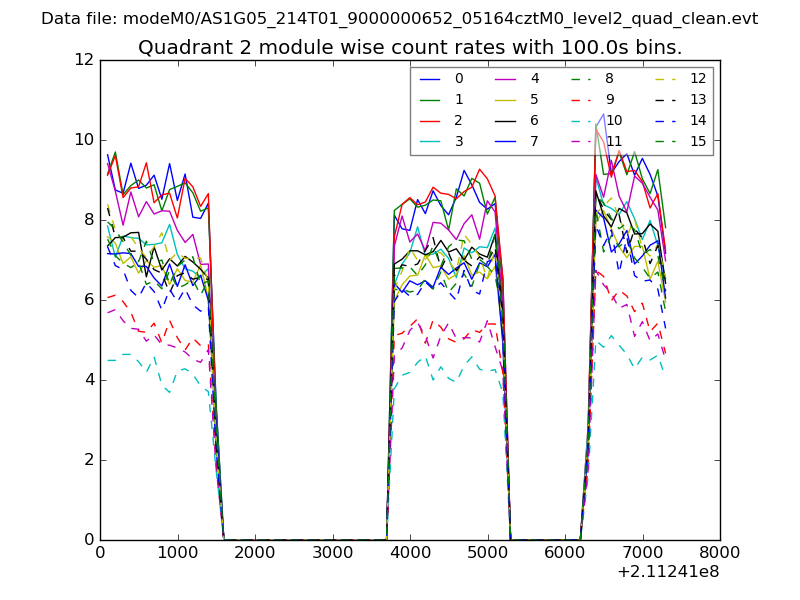
| Module-wise count rates for Quadrant B Data is divided into 100 sec bins |
 |
 |
| Module-wise count rates for Quadrant C Data is divided into 100 sec bins |
 |
 |
| Module-wise count rates for Quadrant D Data is divided into 100 sec bins |
 |
 |
| Parameter | Plot |
|---|---|
| CZT HV Monitor | 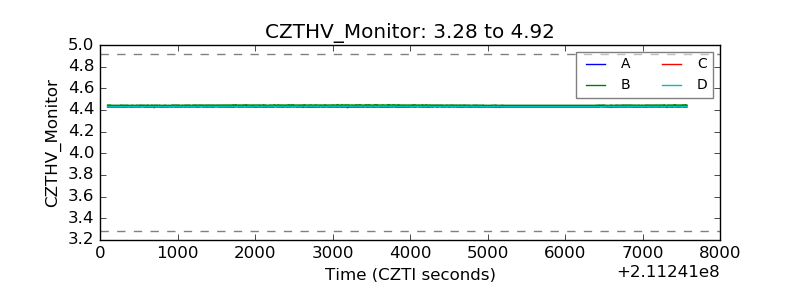 |
| D_VDD | 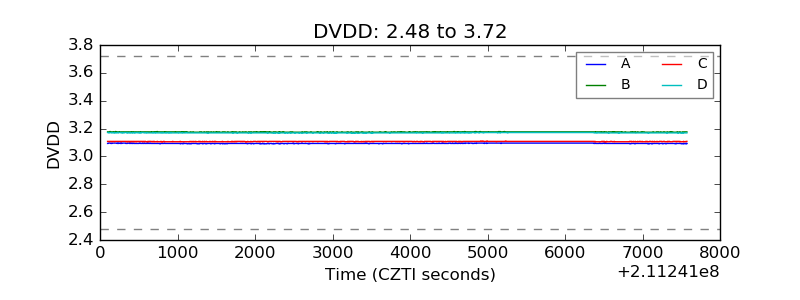 |
| Temperature 1 | 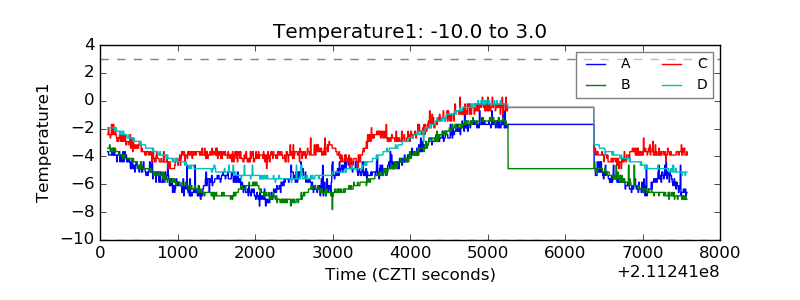 |
| Veto HV Monitor | 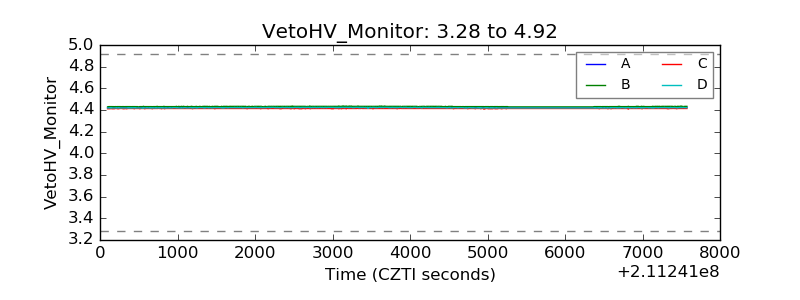 |
| Veto LLD | 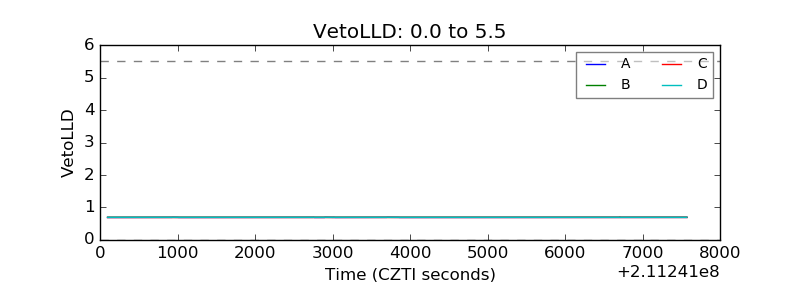 |
| Alpha Counter | 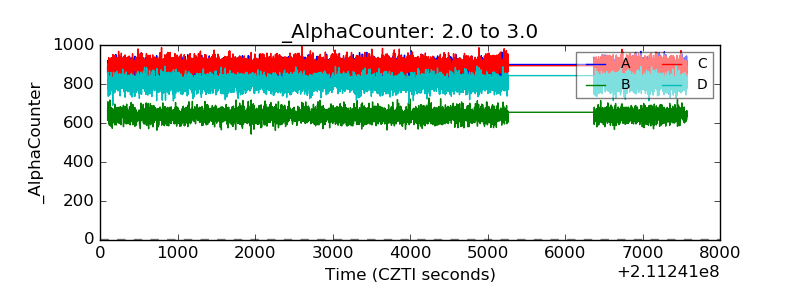 |
| _CPM_Rate | 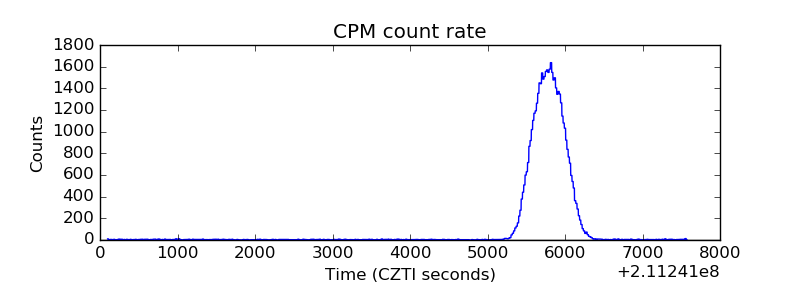 |
| CZT Counter | 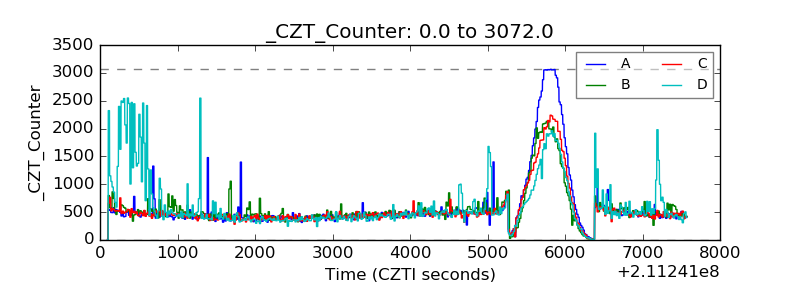 |
| +2.5 Volts monitor |  |
| +5 Volts monitor |  |
| _ROLL_ROT | 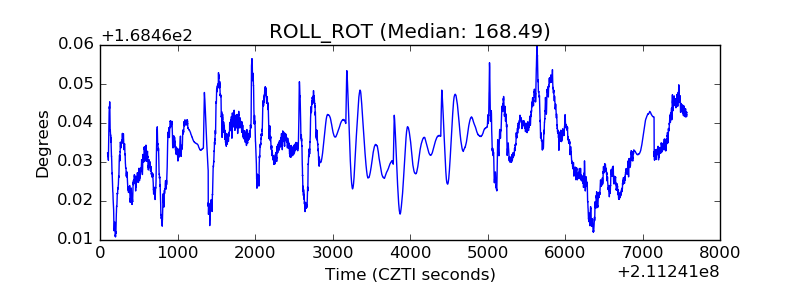 |
| _Roll_DEC | 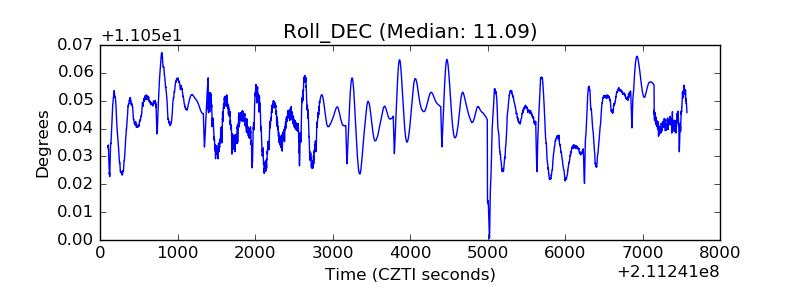 |
| _Roll_RA | 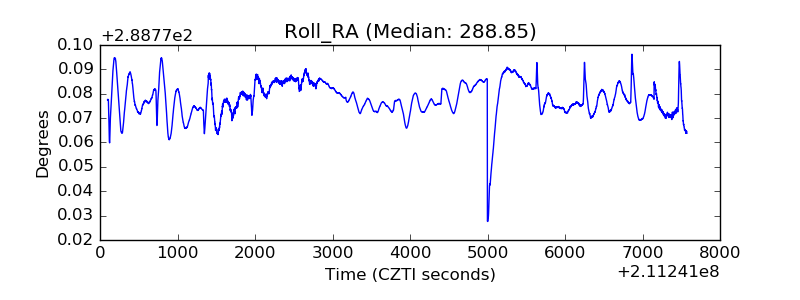 |
| Veto Counter | 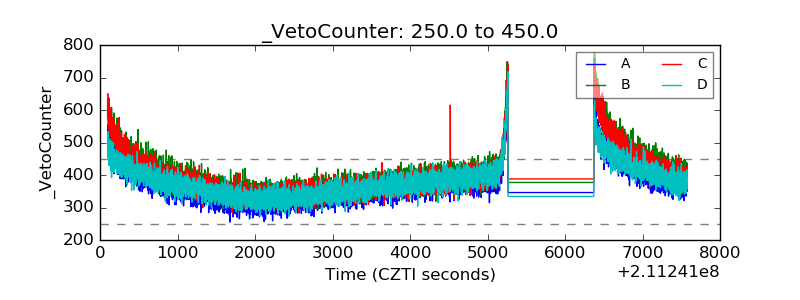 |