| Param | Original file | Final file |
|---|---|---|
| Filename | modeM0/AS1G05_214T01_9000000652_05166cztM0_level2.evt | modeM0/AS1G05_214T01_9000000652_05166cztM0_level2_quad_clean.evt |
| Size (bytes) | 476,709,120 | 59,791,680 |
| Size | 454.6 MB | 57.0 MB |
| Events in quadrant A | 3,316,208 | 341,458 |
| Events in quadrant B | 3,469,441 | 350,556 |
| Events in quadrant C | 3,083,117 | 347,431 |
| Events in quadrant D | 4,123,790 | 314,080 |
| Mode SS | |||
|---|---|---|---|
| Quadrant | BADHDUFLAG | Total packets | Discarded packets |
| A | 0 | 132 | 0 |
| B | 0 | 132 | 0 |
| C | 0 | 132 | 0 |
| D | 0 | 132 | 0 |
| Mode M9 | |||
|---|---|---|---|
| Quadrant | BADHDUFLAG | Total packets | Discarded packets |
| A | 0 | 19 | 0 |
| B | 0 | 19 | 0 |
| C | 0 | 19 | 0 |
| D | 0 | 20 | 0 |
| Mode M0 | |||
|---|---|---|---|
| Quadrant | BADHDUFLAG | Total packets | Discarded packets |
| A | 0 | 14030 | 3 |
| B | 0 | 14399 | 2 |
| C | 0 | 13361 | 2 |
| D | 0 | 16813 | 2 |
| Quadrant | Total seconds | Saturated seconds | Saturation percentage |
|---|---|---|---|
| A | 6550 | 49 | 0.748092% |
| B | 6550 | 43 | 0.656489% |
| C | 6550 | 11 | 0.167939% |
| D | 6550 | 176 | 2.687023% |
Noise dominated data is calculated using 1-second bins in cleaned event files. If a bin has >2000 counts, and if more than 50% of those come from <1% of pixels, then it is considered to be noise-dominated and hence unusable.
| Quadrant | # 1 sec bins | Bins with >0 counts | Bins with >2000 counts | High rate bins dominated by noise | Noise dominated (total time) | Noise dominated (detector-on time) | Marked lightcurve |
|---|---|---|---|---|---|---|---|
| A | 7840 | 6551 | 19 | 19 | 0.24% | 0.29% | 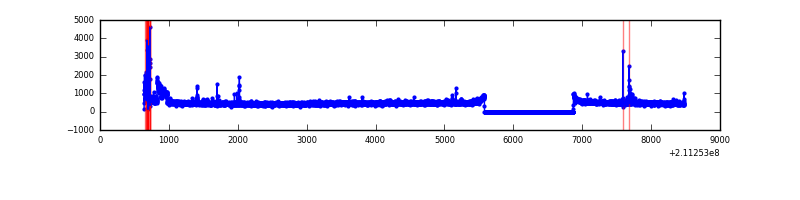 |
| B | 7840 | 6551 | 3 | 3 | 0.04% | 0.05% | 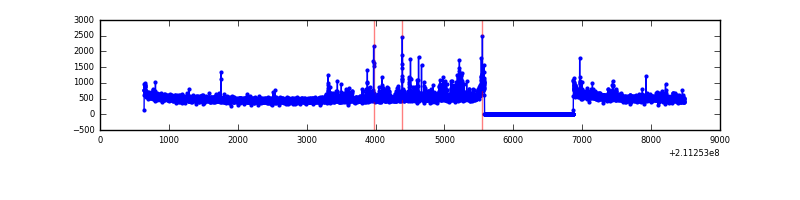 |
| C | 7840 | 6551 | 0 | 0 | 0.00% | 0.00% | 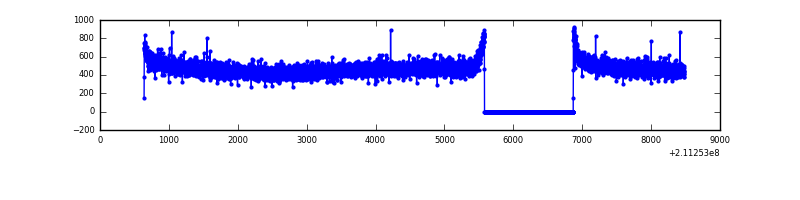 |
| D | 7840 | 6551 | 169 | 169 | 2.16% | 2.58% | 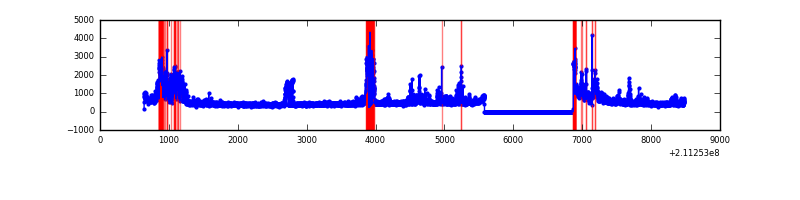 |
Top three noisy pixels from each quadrant. If the there are fewer than three noisy pixels in the level2.evt file, extra rows are filled as -1
| Pixel properties | Quadrant properties | ||||||
|---|---|---|---|---|---|---|---|
| Quadrant | DetID | PixID | Counts | Sigma | Mean | Median | Sigma |
| A | 0 | 247 | 92844 | 556.98 | 807 | 791 | 165.3 |
| A | 4 | 2 | 92373 | 554.13 | 807 | 791 | 165.3 |
| A | 0 | 226 | 17810 | 102.98 | 807 | 791 | 165.3 |
| B | 4 | 80 | 203087 | 1288.82 | 826 | 810 | 156.9 |
| B | 15 | 204 | 50762 | 318.27 | 826 | 810 | 156.9 |
| B | 0 | 219 | 17848 | 108.56 | 826 | 810 | 156.9 |
| C | 1 | 16 | 14685 | 76.33 | 786 | 794 | 182.0 |
| C | 13 | 61 | 6473 | 31.21 | 786 | 794 | 182.0 |
| C | 3 | 202 | 2032 | 6.8 | 786 | 794 | 182.0 |
| D | 13 | 53 | 806552 | 4310.74 | 765 | 743 | 186.9 |
| D | 2 | 33 | 307070 | 1638.72 | 765 | 743 | 186.9 |
| D | 2 | 221 | 47454 | 249.88 | 765 | 743 | 186.9 |
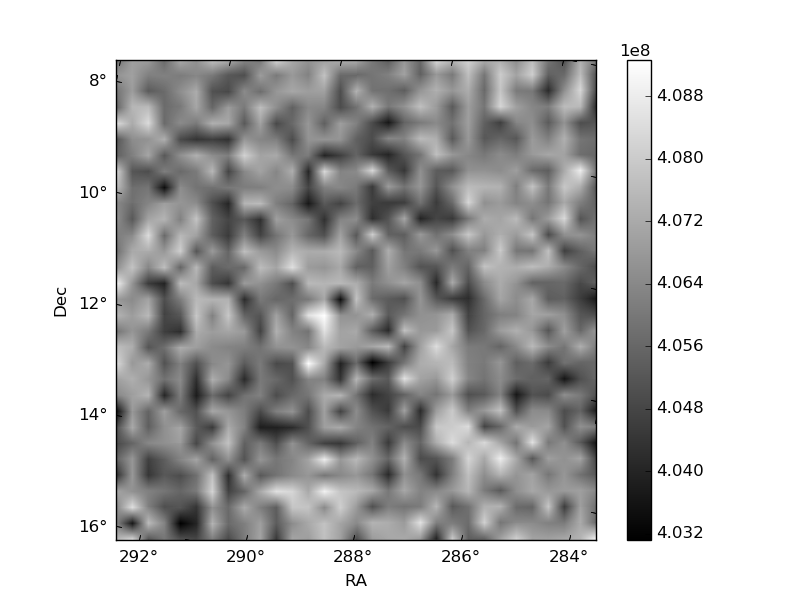
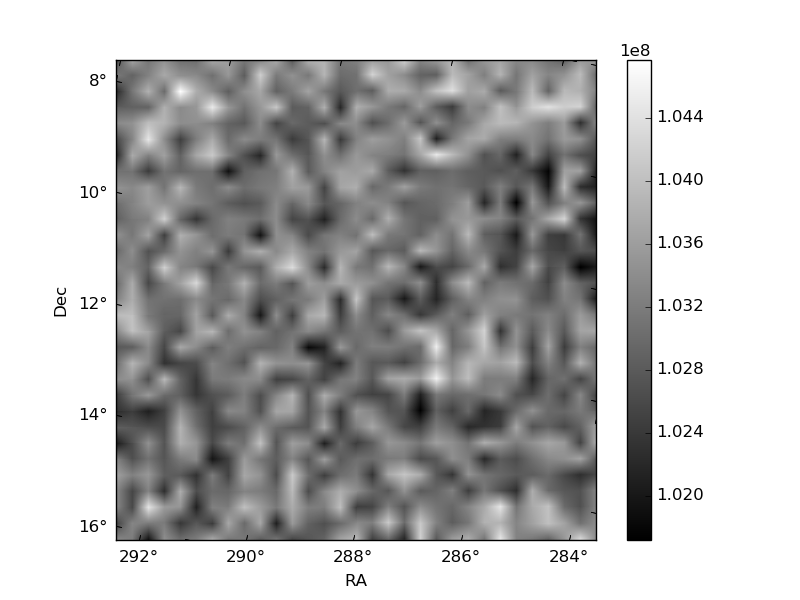
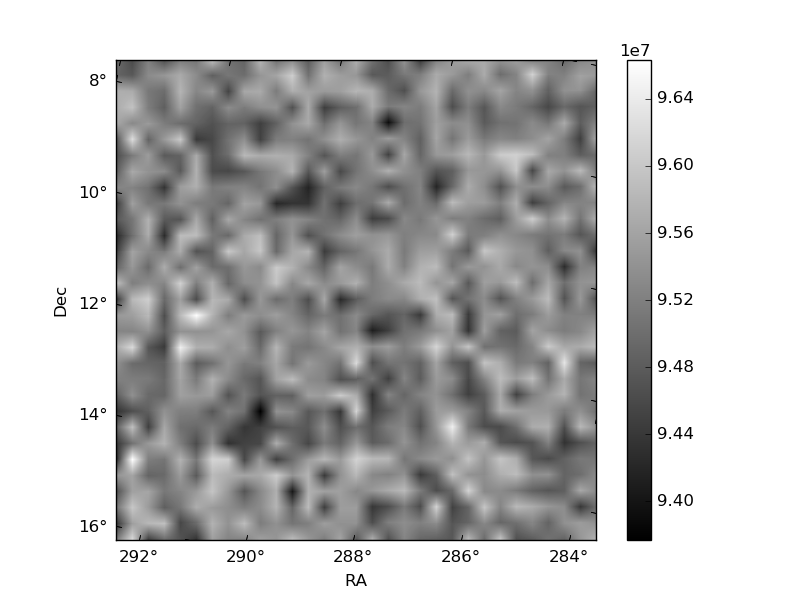
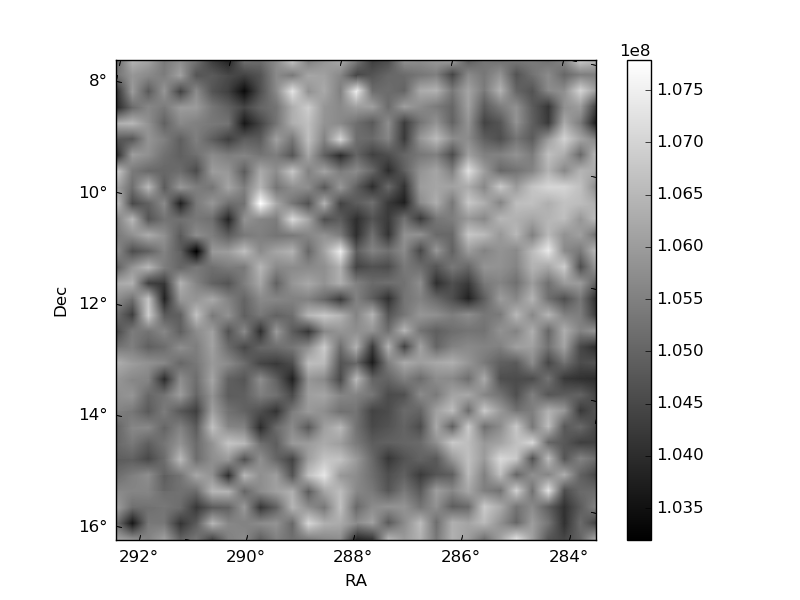
Histogram calculated using DETX and DETY for each event in the final _common_clean file
| Quadrant A | 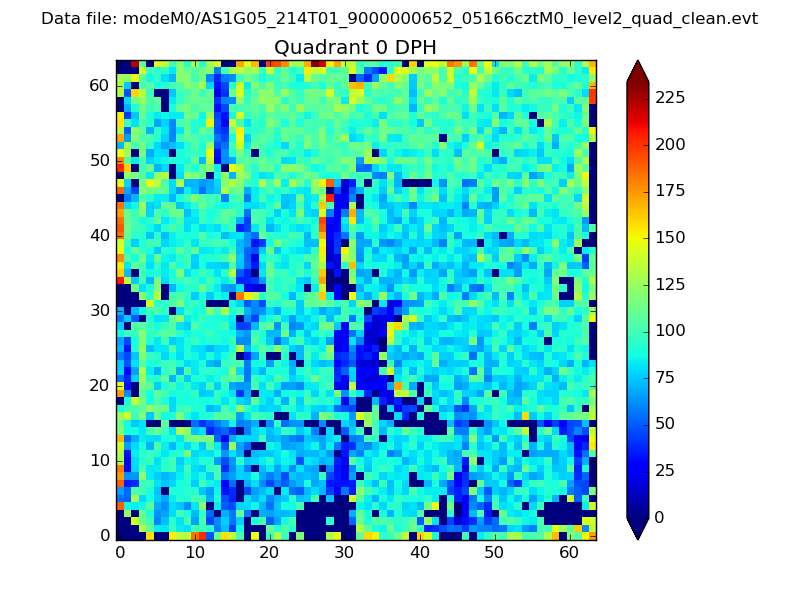 |
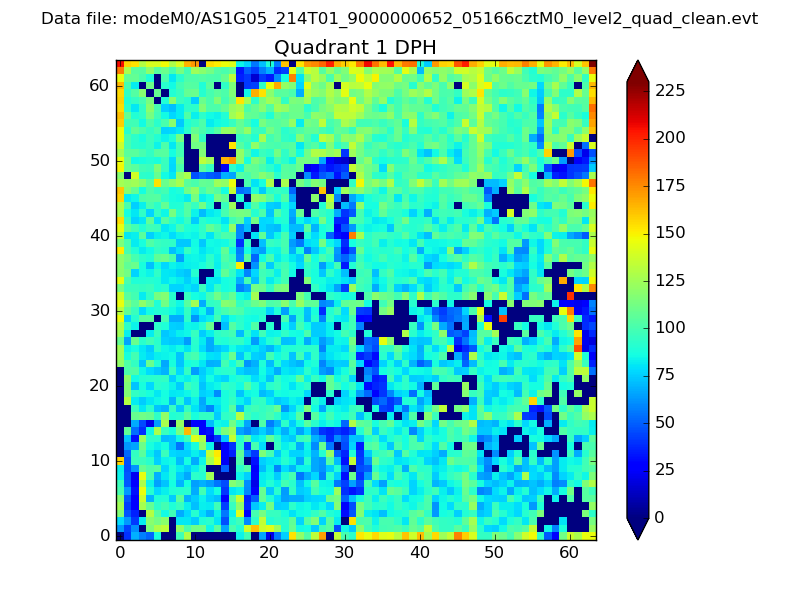 |
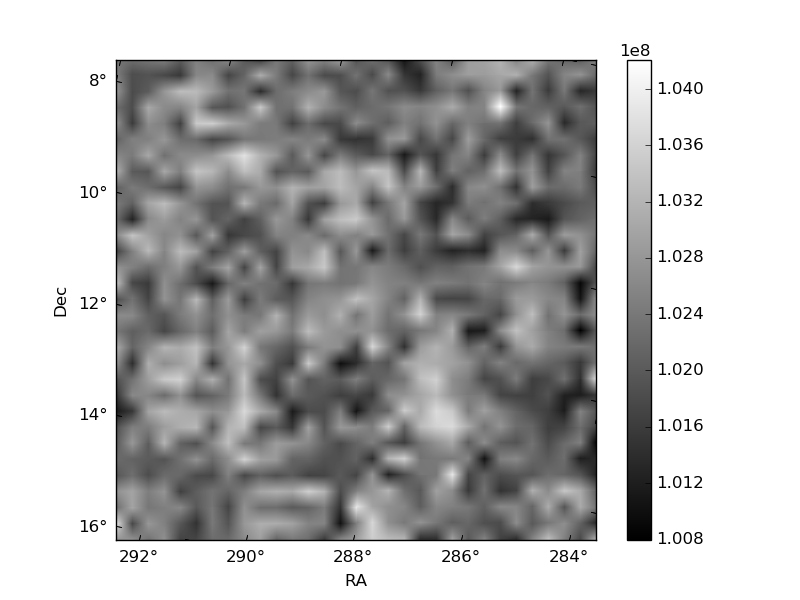
Quadrant B |
|---|---|---|---|
| Quadrant D | 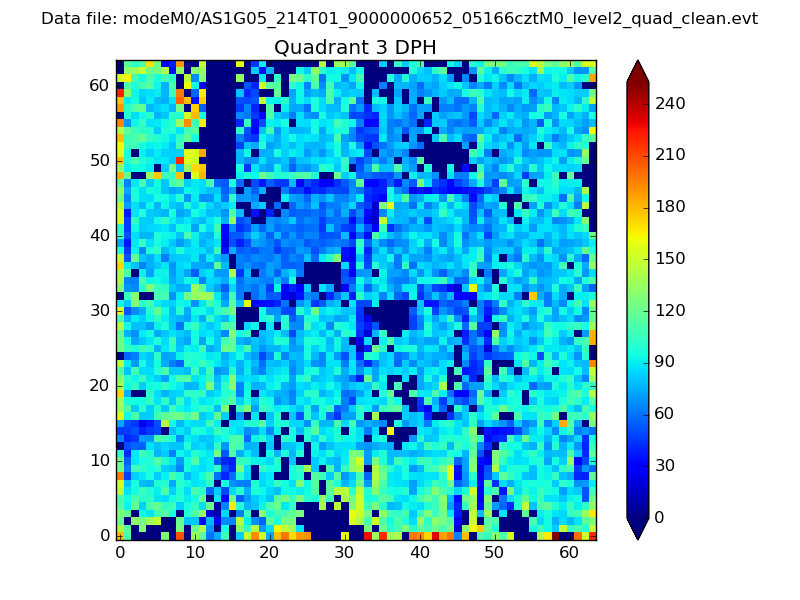 |
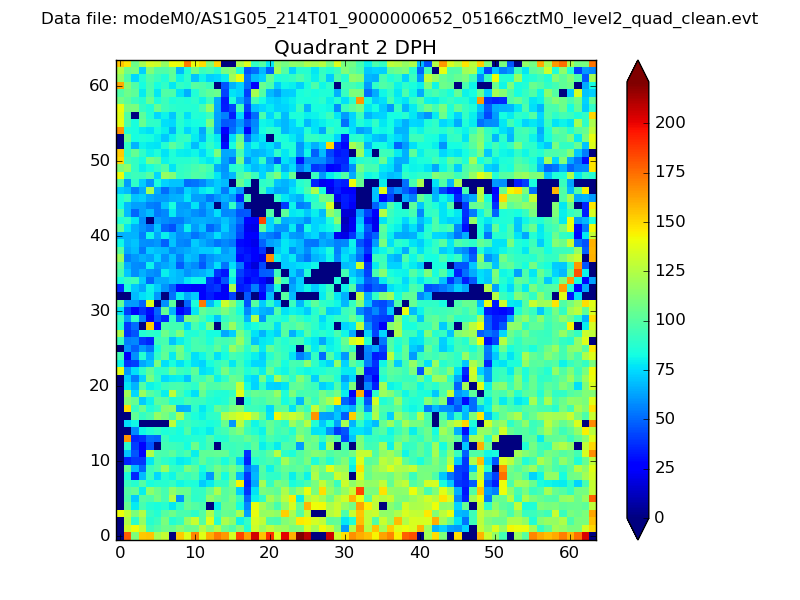 |
Quadrant C |
| Plot type | Count rate plots | Images |
|---|---|---|
| Comparison with Poisson distribution Blue bars denote a histogram of data divided into 1 sec bins. Red curve is a Poisson curve with rate = median count rate of data. |
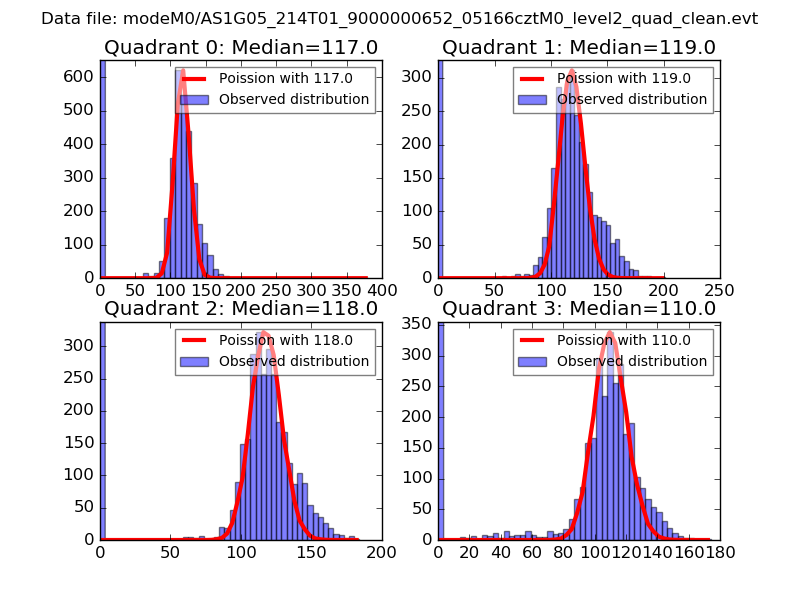 |
 |
| Quadrant-wise count rates Data is divided into 100 sec bins |
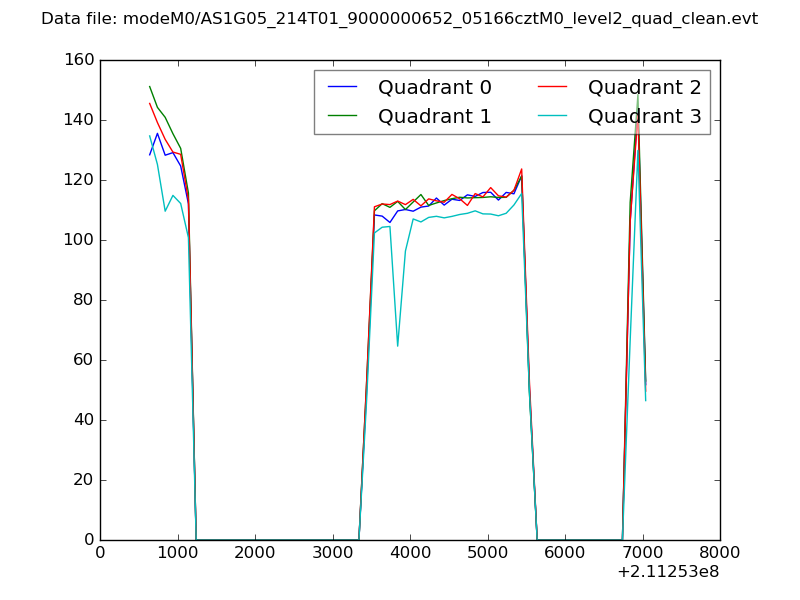 |
|
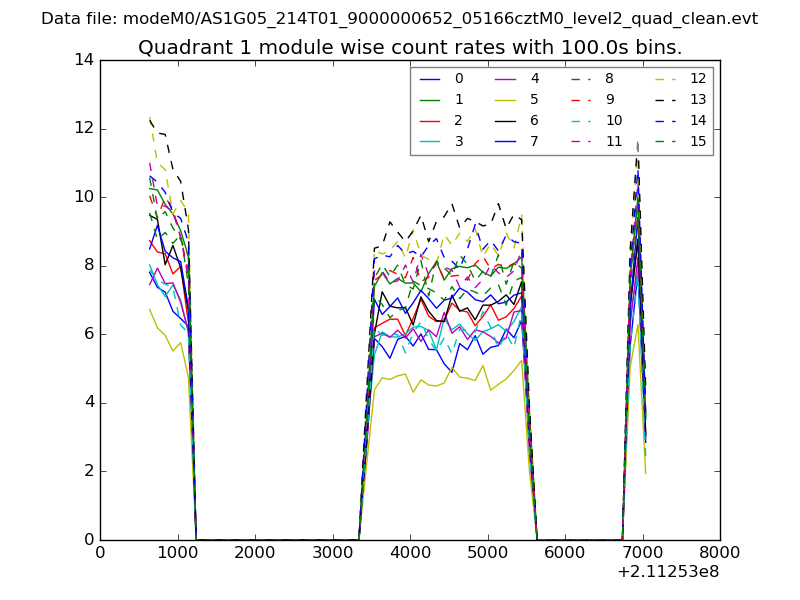
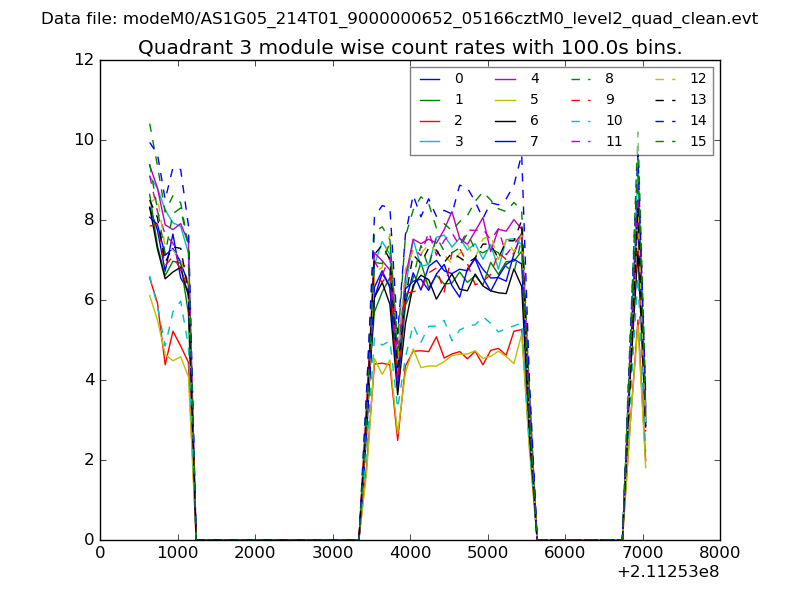
| Module-wise count rates for Quadrant A Data is divided into 100 sec bins |
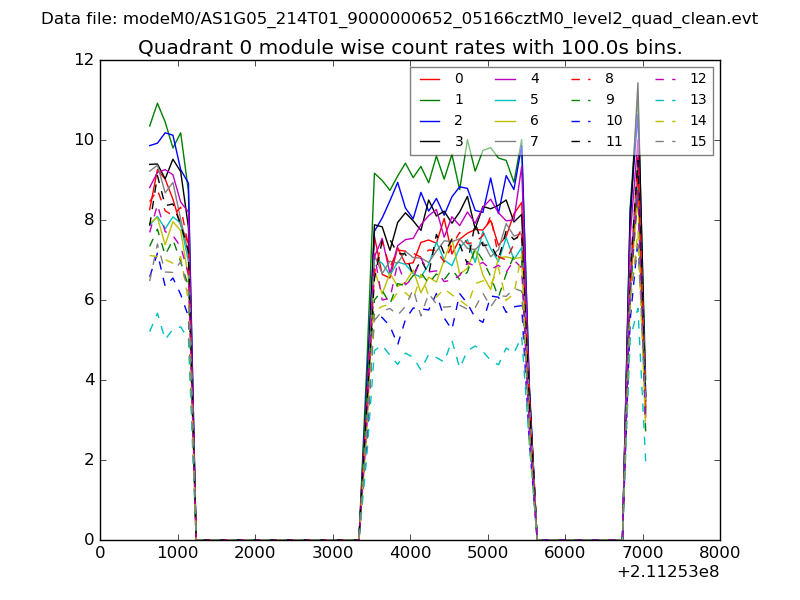 |
 |
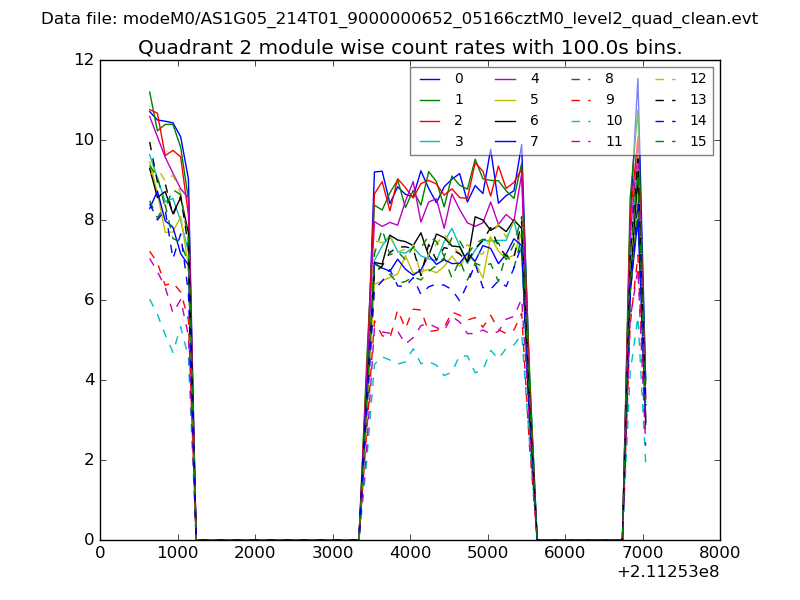
| Module-wise count rates for Quadrant B Data is divided into 100 sec bins |
 |
 |
| Module-wise count rates for Quadrant C Data is divided into 100 sec bins |
 |
 |
| Module-wise count rates for Quadrant D Data is divided into 100 sec bins |
 |
 |
| Parameter | Plot |
|---|---|
| CZT HV Monitor | 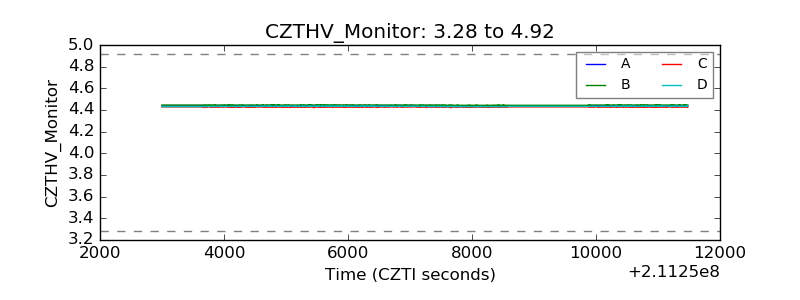 |
| D_VDD | 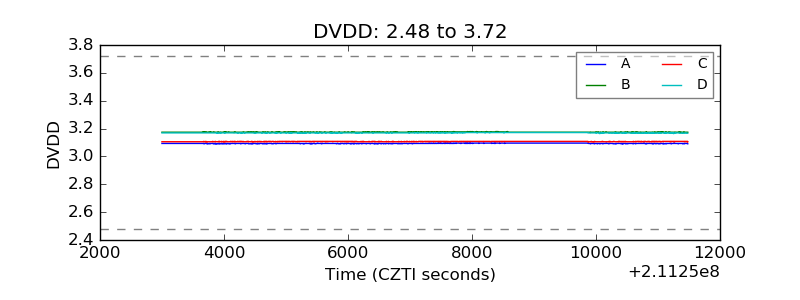 |
| Temperature 1 | 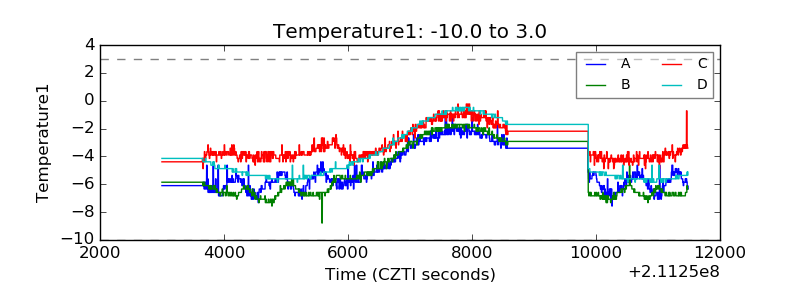 |
| Veto HV Monitor | 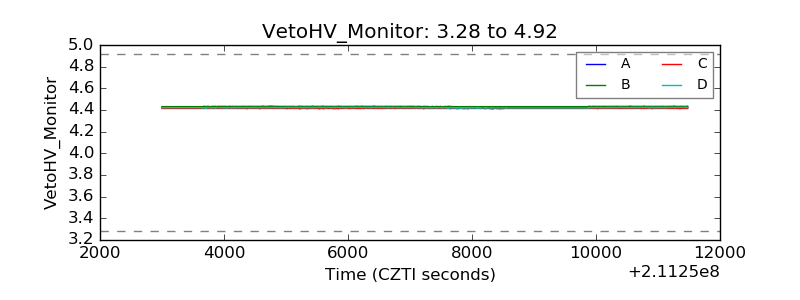 |
| Veto LLD | 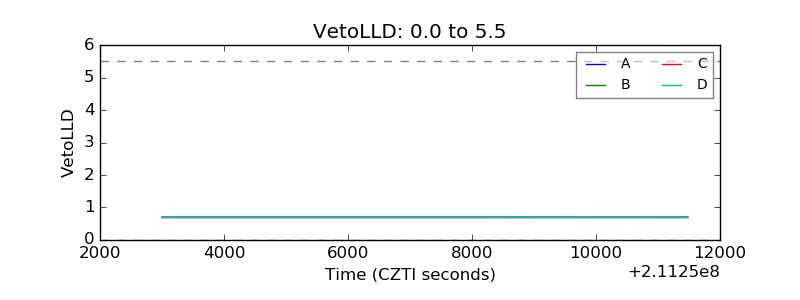 |
| Alpha Counter | 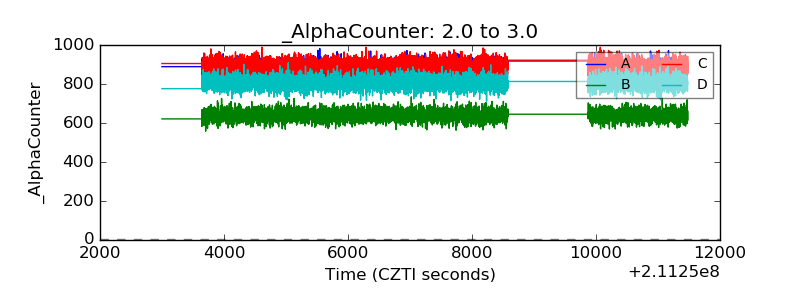 |
| _CPM_Rate | 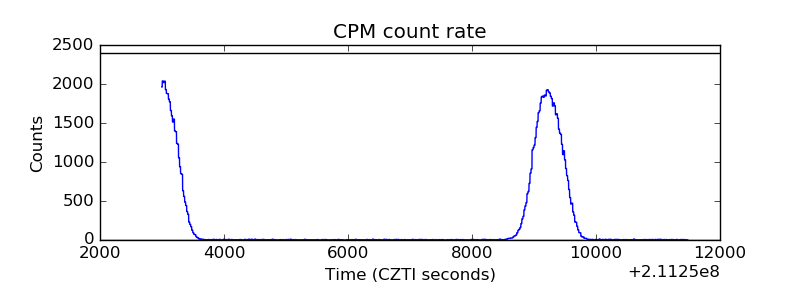 |
| CZT Counter | 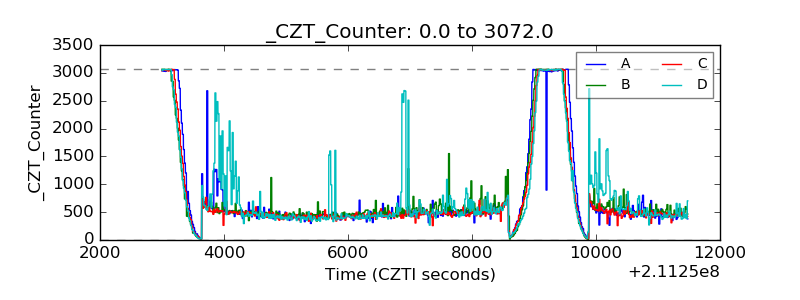 |
| +2.5 Volts monitor |  |
| +5 Volts monitor |  |
| _ROLL_ROT | 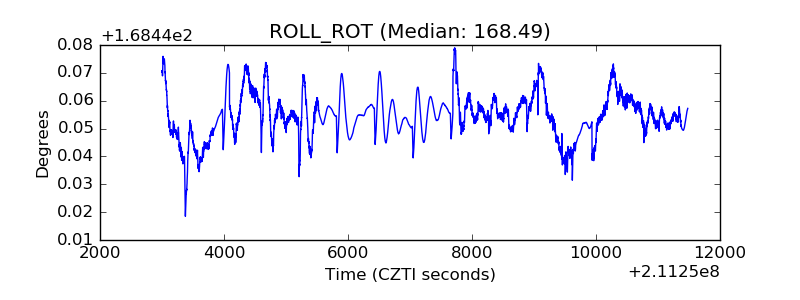 |
| _Roll_DEC | 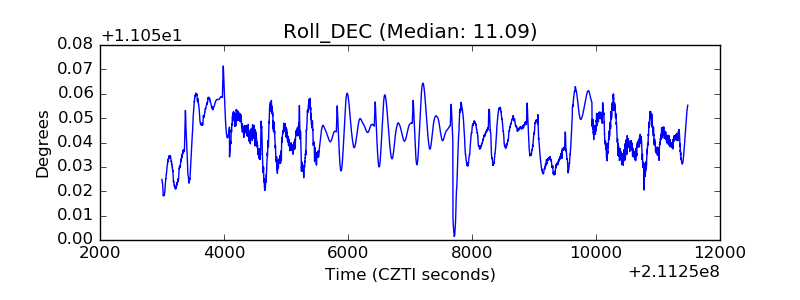 |
| _Roll_RA | 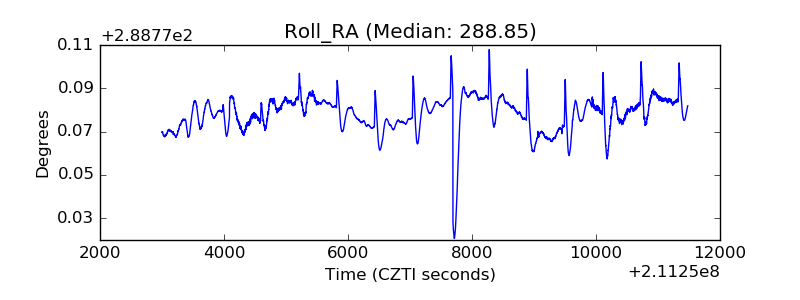 |
| Veto Counter | 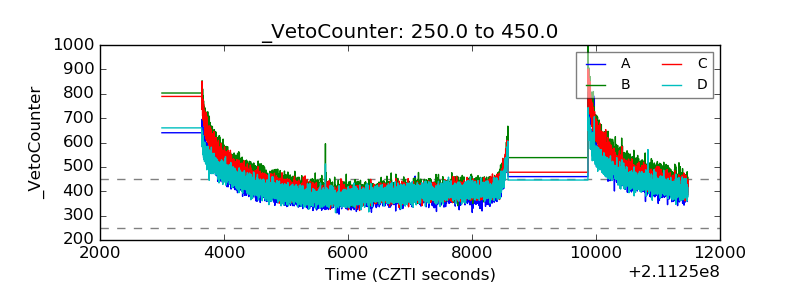 |