| Param | Original file | Final file |
|---|---|---|
| Filename | modeM0/AS1G05_214T01_9000000652_05167cztM0_level2.evt | modeM0/AS1G05_214T01_9000000652_05167cztM0_level2_quad_clean.evt |
| Size (bytes) | 458,167,680 | 56,142,720 |
| Size | 436.9 MB | 53.5 MB |
| Events in quadrant A | 3,237,341 | 314,357 |
| Events in quadrant B | 3,532,140 | 319,827 |
| Events in quadrant C | 3,129,681 | 315,798 |
| Events in quadrant D | 3,535,152 | 296,393 |
| Mode SS | |||
|---|---|---|---|
| Quadrant | BADHDUFLAG | Total packets | Discarded packets |
| A | 0 | 132 | 0 |
| B | 0 | 132 | 0 |
| C | 0 | 132 | 0 |
| D | 0 | 132 | 0 |
| Mode M9 | |||
|---|---|---|---|
| Quadrant | BADHDUFLAG | Total packets | Discarded packets |
| A | 0 | 14 | 0 |
| B | 0 | 14 | 0 |
| C | 0 | 14 | 0 |
| D | 0 | 15 | 0 |
| Mode M0 | |||
|---|---|---|---|
| Quadrant | BADHDUFLAG | Total packets | Discarded packets |
| A | 0 | 13596 | 3 |
| B | 0 | 14300 | 2 |
| C | 0 | 13413 | 2 |
| D | 0 | 14876 | 2 |
| Quadrant | Total seconds | Saturated seconds | Saturation percentage |
|---|---|---|---|
| A | 6495 | 84 | 1.293303% |
| B | 6495 | 84 | 1.293303% |
| C | 6495 | 53 | 0.816012% |
| D | 6495 | 130 | 2.001540% |
Noise dominated data is calculated using 1-second bins in cleaned event files. If a bin has >2000 counts, and if more than 50% of those come from <1% of pixels, then it is considered to be noise-dominated and hence unusable.
| Quadrant | # 1 sec bins | Bins with >0 counts | Bins with >2000 counts | High rate bins dominated by noise | Noise dominated (total time) | Noise dominated (detector-on time) | Marked lightcurve |
|---|---|---|---|---|---|---|---|
| A | 7765 | 6496 | 6 | 6 | 0.08% | 0.09% | 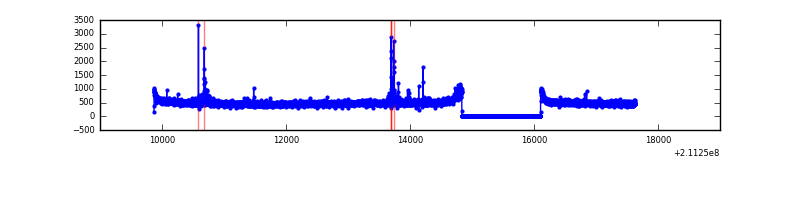 |
| B | 7765 | 6496 | 0 | 0 | 0.00% | 0.00% | 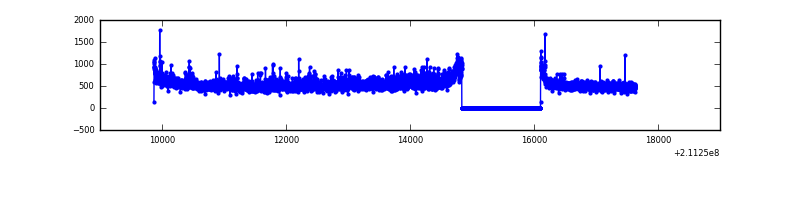 |
| C | 7765 | 6496 | 0 | 0 | 0.00% | 0.00% | 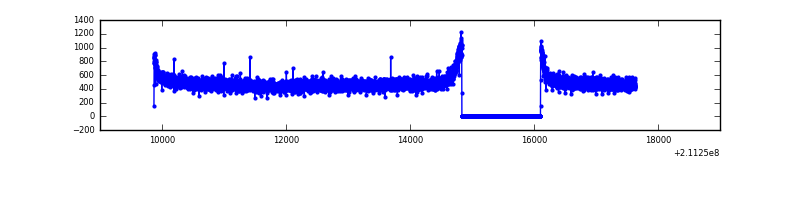 |
| D | 7765 | 6496 | 74 | 74 | 0.95% | 1.14% | 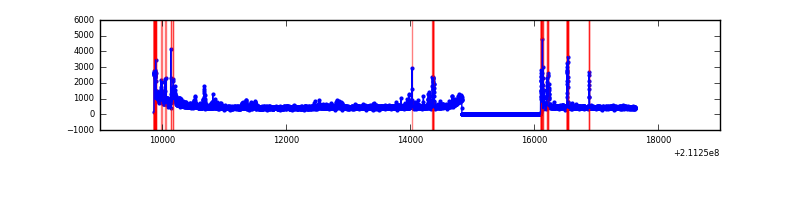 |
Top three noisy pixels from each quadrant. If the there are fewer than three noisy pixels in the level2.evt file, extra rows are filled as -1
| Pixel properties | Quadrant properties | ||||||
|---|---|---|---|---|---|---|---|
| Quadrant | DetID | PixID | Counts | Sigma | Mean | Median | Sigma |
| A | 0 | 50 | 32538 | 191.11 | 823 | 807 | 166.0 |
| A | 4 | 2 | 24111 | 140.36 | 823 | 807 | 166.0 |
| A | 13 | 251 | 10609 | 59.04 | 823 | 807 | 166.0 |
| B | 15 | 204 | 157974 | 986.49 | 839 | 821 | 159.3 |
| B | 4 | 80 | 104037 | 647.91 | 839 | 821 | 159.3 |
| B | 12 | 111 | 14199 | 83.98 | 839 | 821 | 159.3 |
| C | 1 | 16 | 21737 | 113.45 | 796 | 803 | 184.5 |
| C | 13 | 61 | 6542 | 31.1 | 796 | 803 | 184.5 |
| C | 14 | 67 | 2396 | 8.63 | 796 | 803 | 184.5 |
| D | 13 | 53 | 295735 | 1541.52 | 783 | 761 | 191.4 |
| D | 2 | 33 | 115390 | 599.04 | 783 | 761 | 191.4 |
| D | 13 | 105 | 77059 | 398.73 | 783 | 761 | 191.4 |
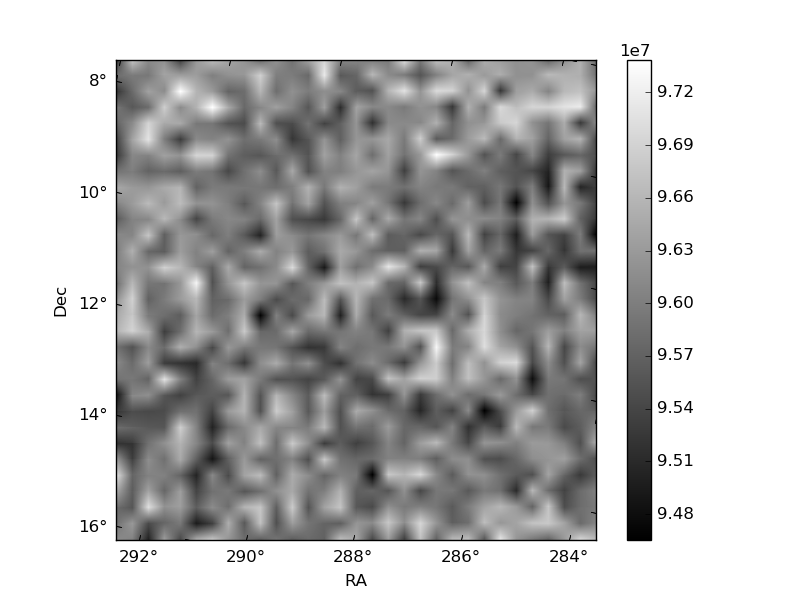
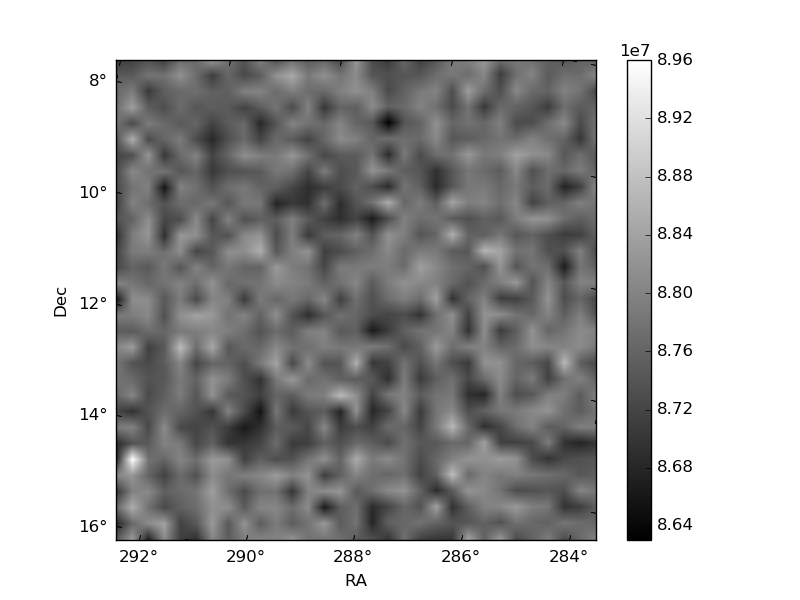
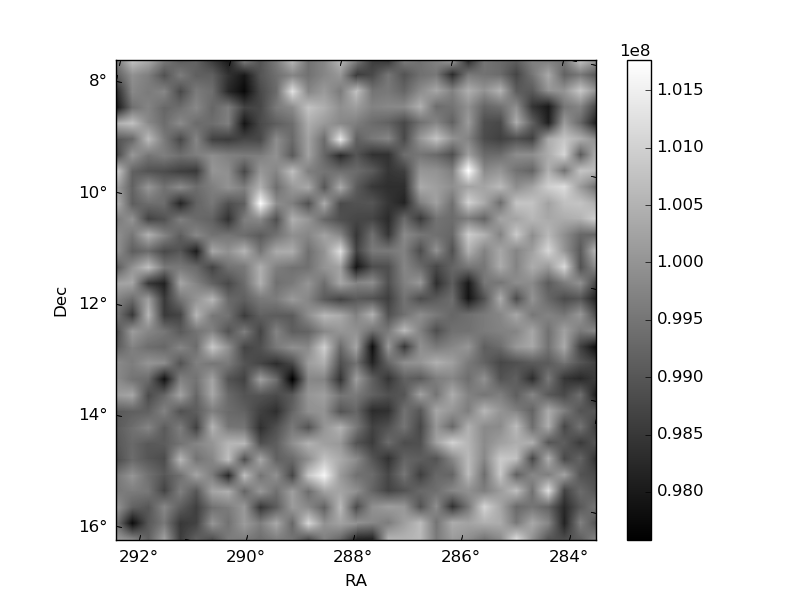
Histogram calculated using DETX and DETY for each event in the final _common_clean file
| Quadrant A | 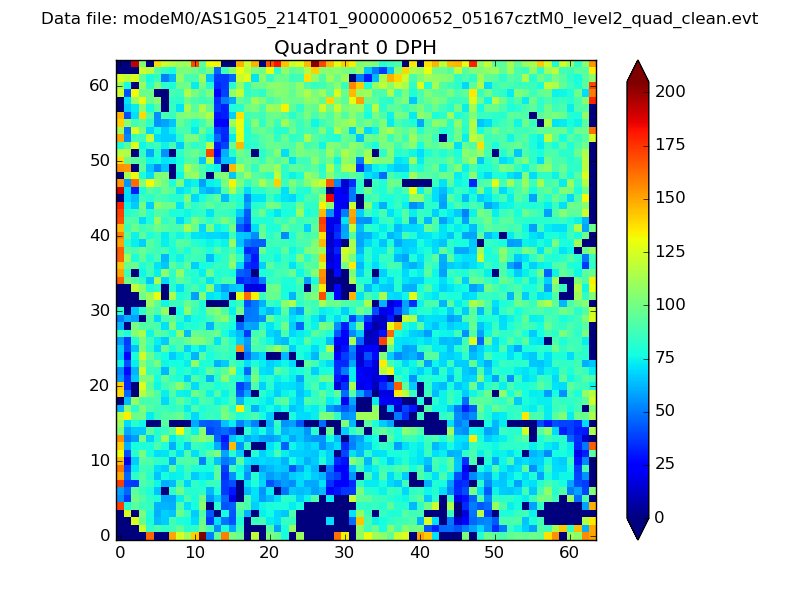 |
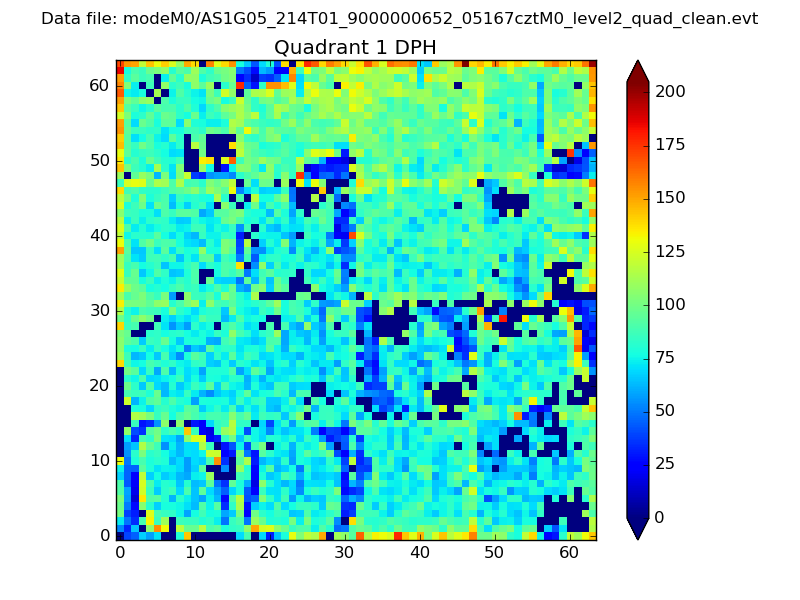 |
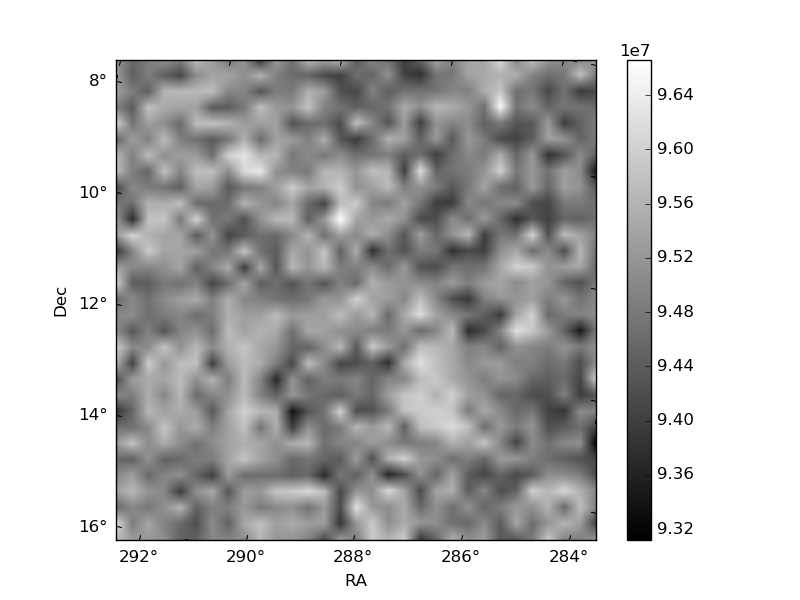
Quadrant B |
|---|---|---|---|
| Quadrant D | 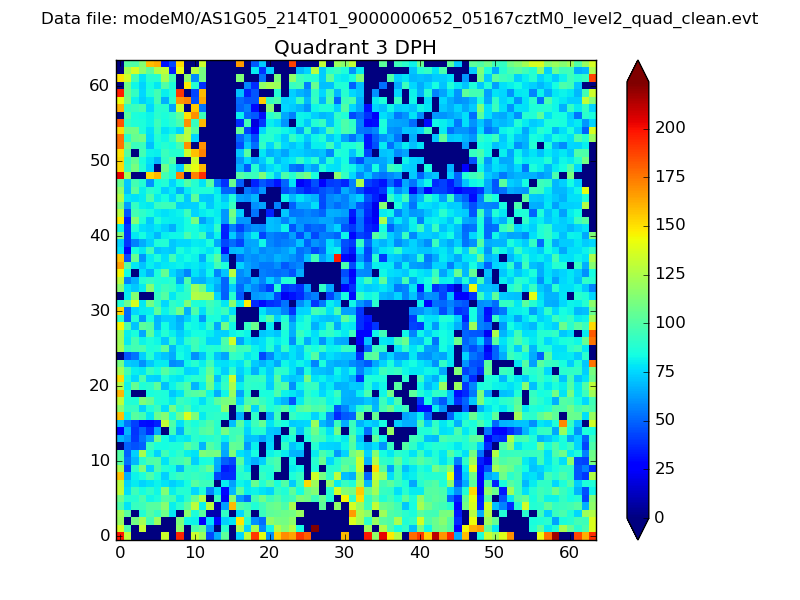 |
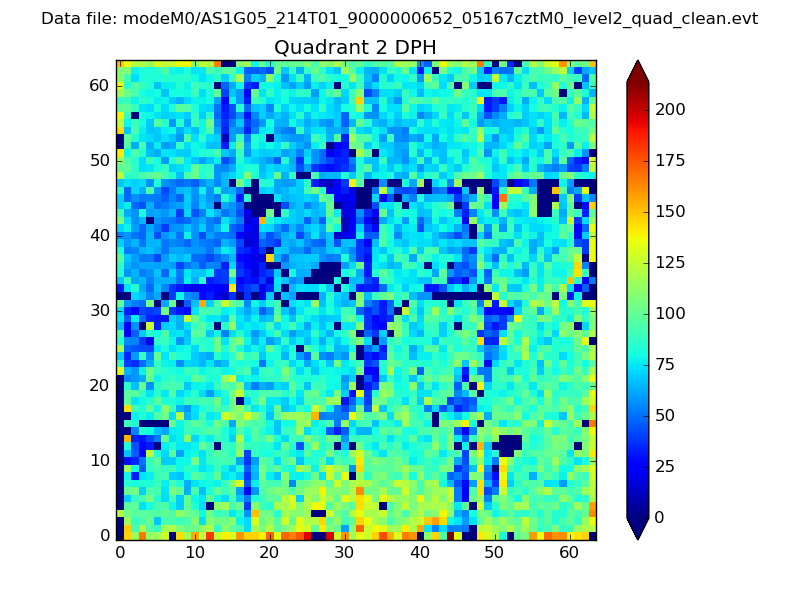 |
Quadrant C |
| Plot type | Count rate plots | Images |
|---|---|---|
| Comparison with Poisson distribution Blue bars denote a histogram of data divided into 1 sec bins. Red curve is a Poisson curve with rate = median count rate of data. |
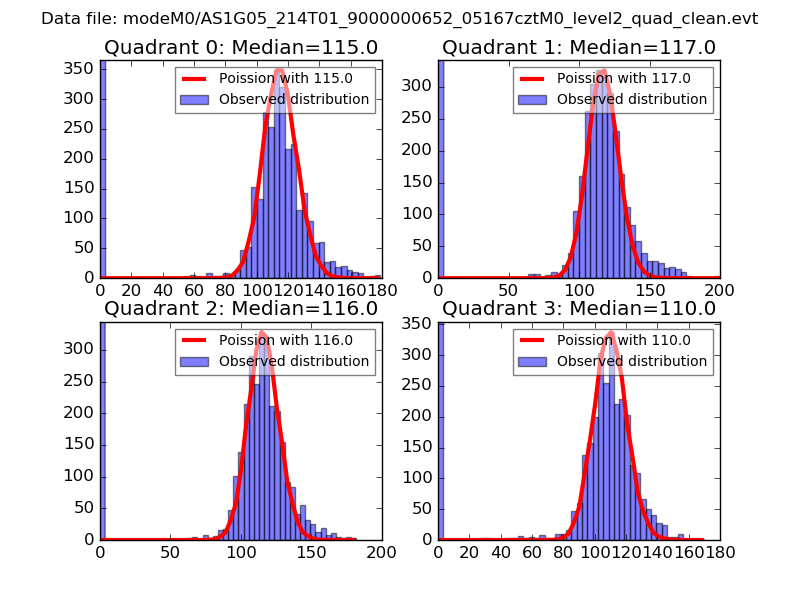 |
 |
| Quadrant-wise count rates Data is divided into 100 sec bins |
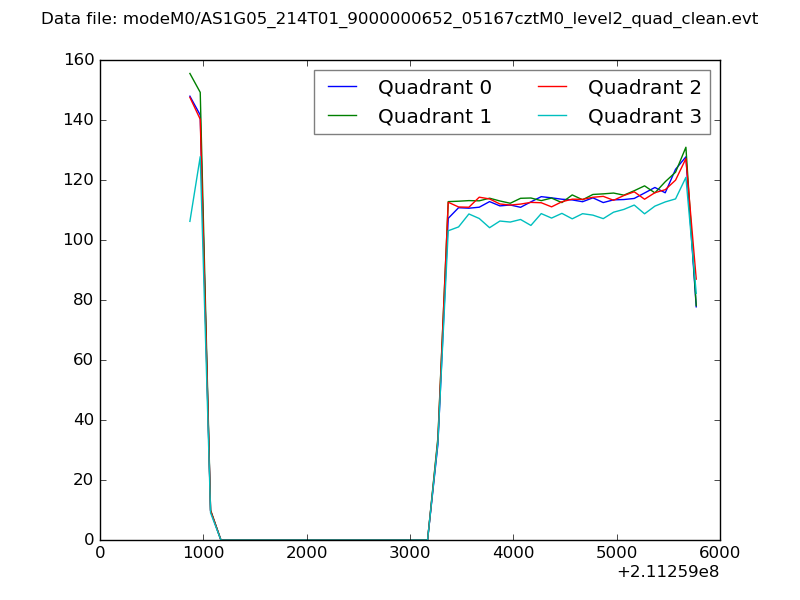 |
|
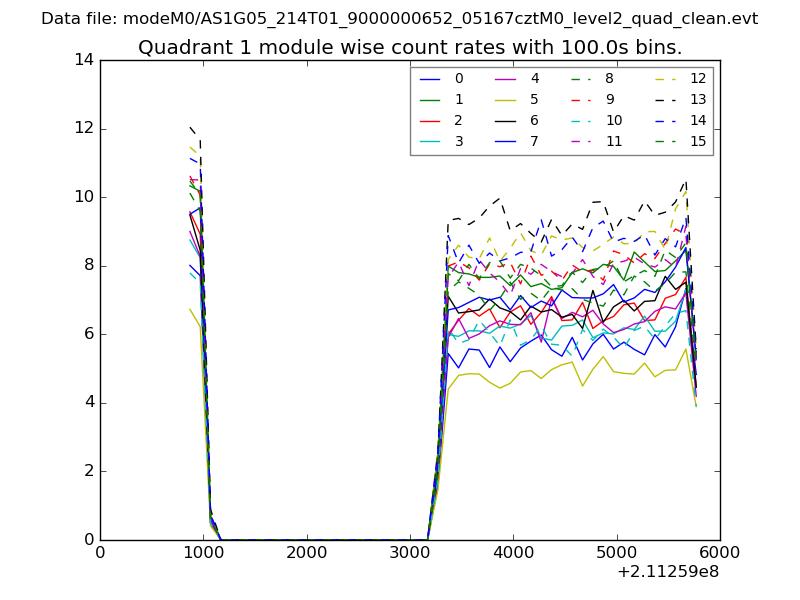
| Module-wise count rates for Quadrant A Data is divided into 100 sec bins |
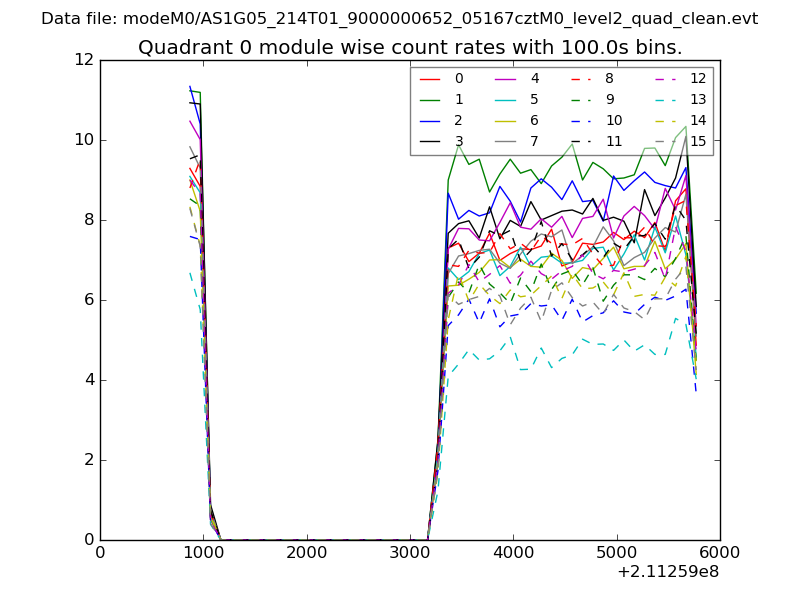 |
 |
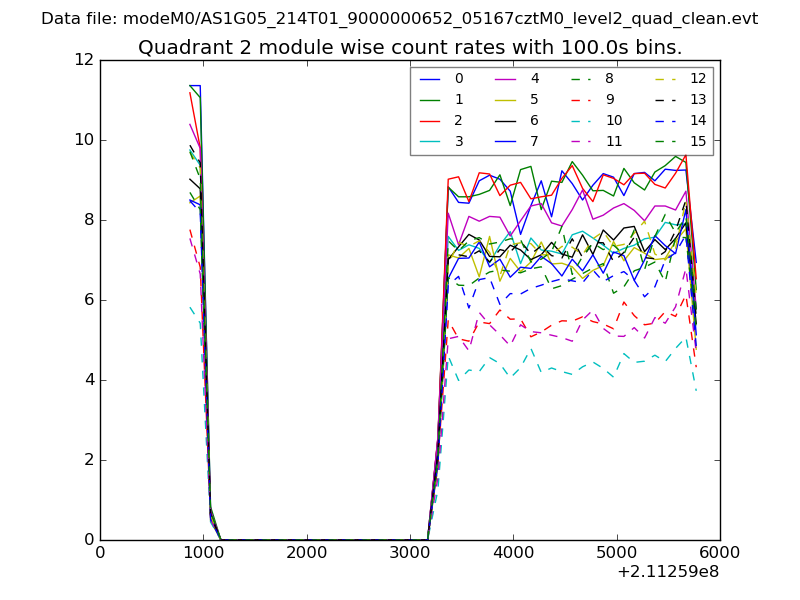
| Module-wise count rates for Quadrant B Data is divided into 100 sec bins |
 |
 |
| Module-wise count rates for Quadrant C Data is divided into 100 sec bins |
 |
 |
| Module-wise count rates for Quadrant D Data is divided into 100 sec bins |
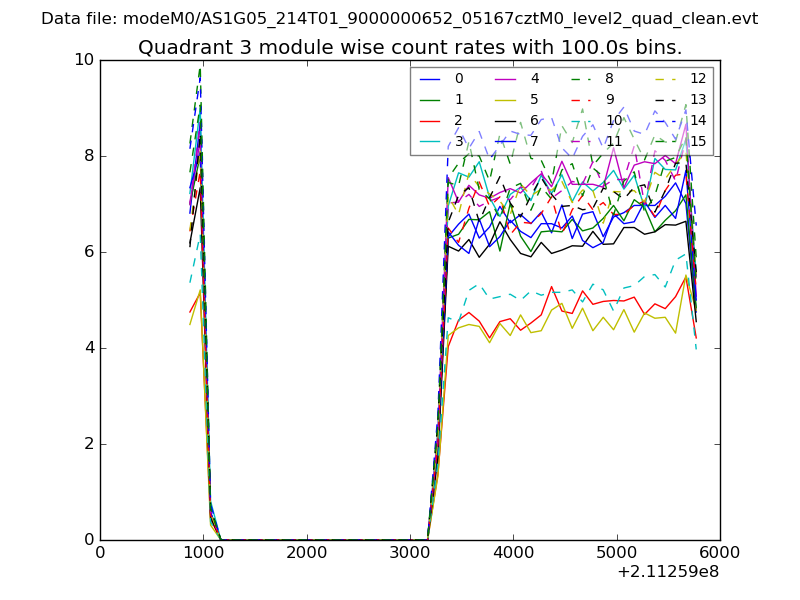 |
 |
| Parameter | Plot |
|---|---|
| CZT HV Monitor | 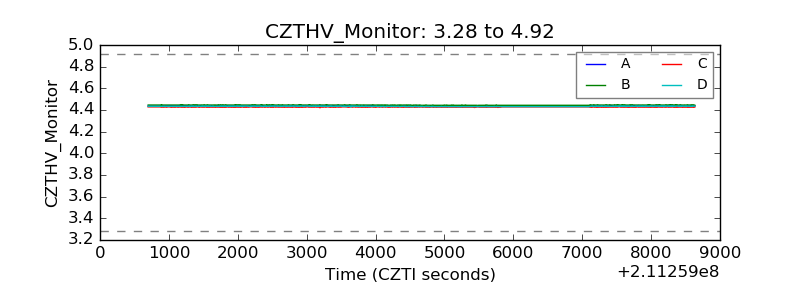 |
| D_VDD | 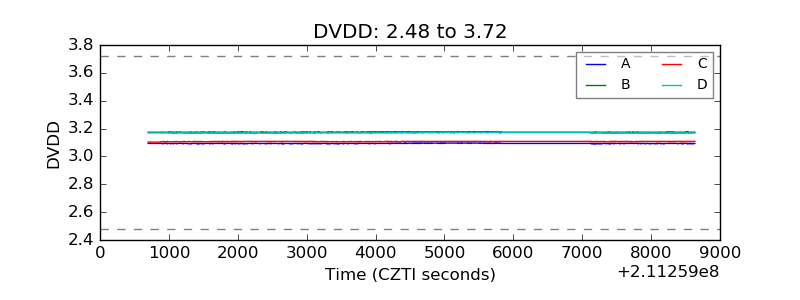 |
| Temperature 1 | 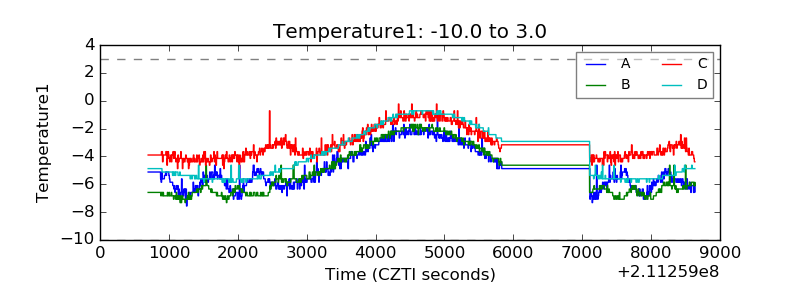 |
| Veto HV Monitor | 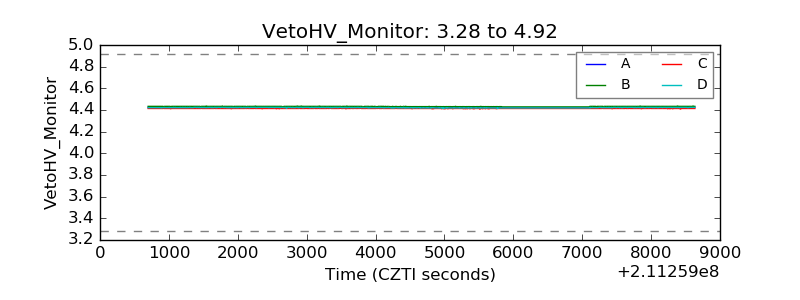 |
| Veto LLD | 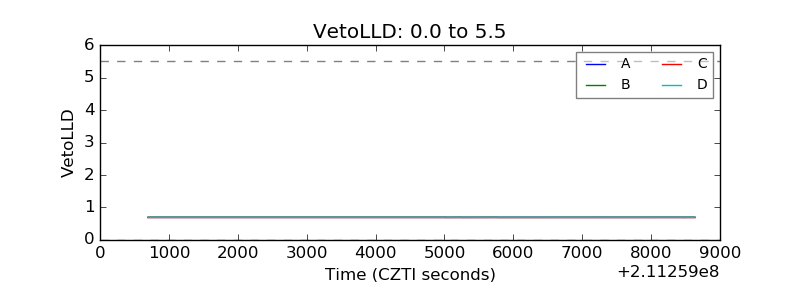 |
| Alpha Counter | 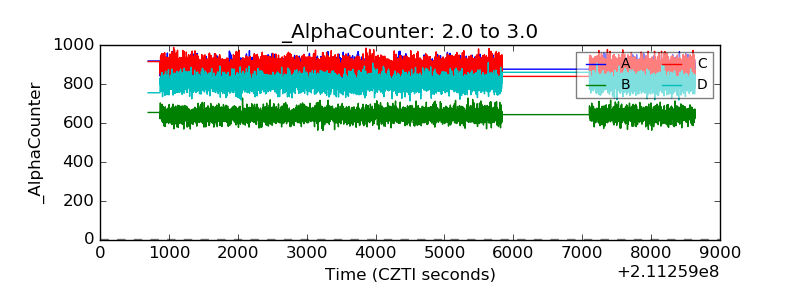 |
| _CPM_Rate | 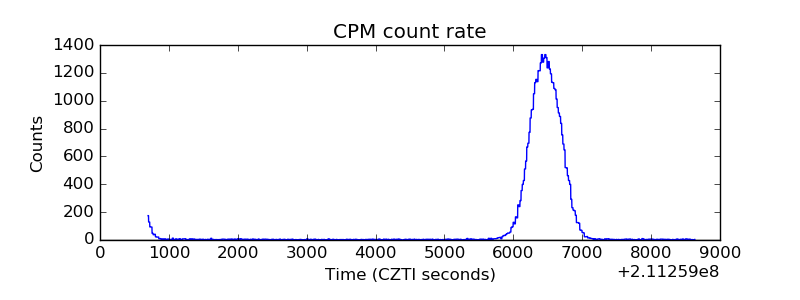 |
| CZT Counter | 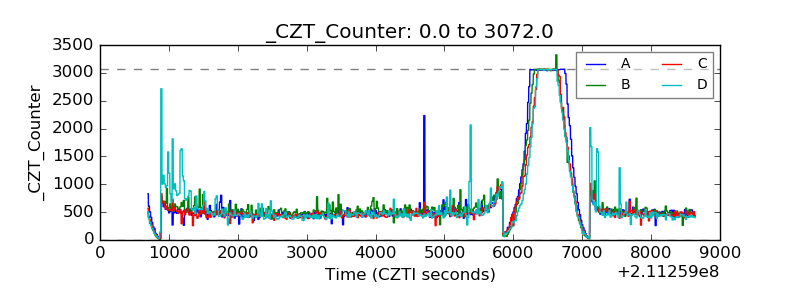 |
| +2.5 Volts monitor | 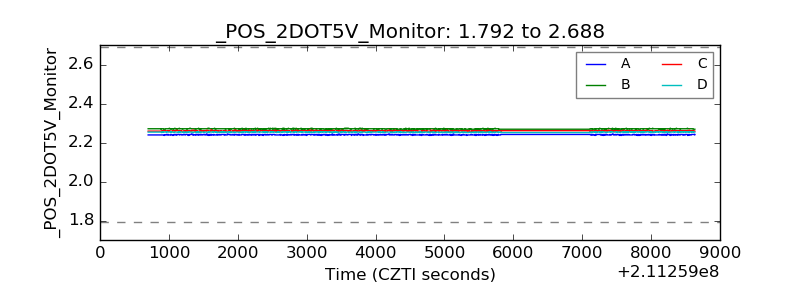 |
| +5 Volts monitor |  |
| _ROLL_ROT | 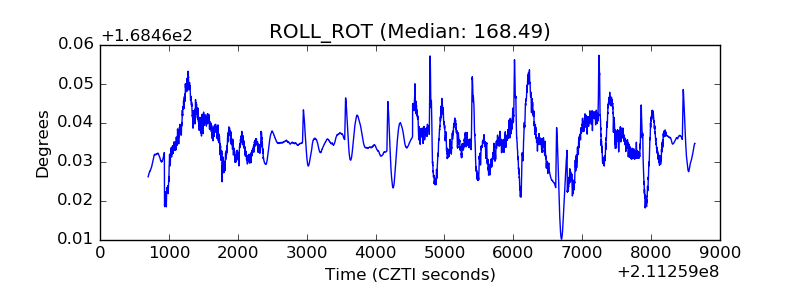 |
| _Roll_DEC | 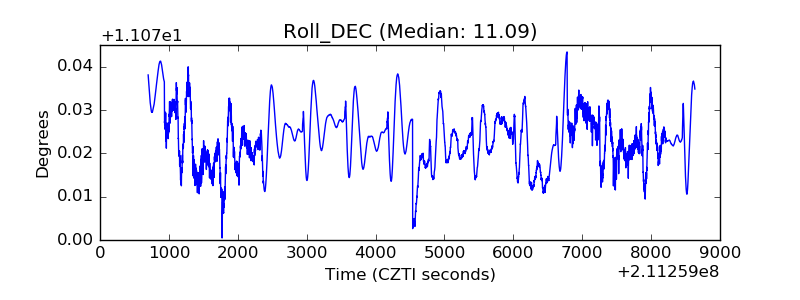 |
| _Roll_RA |  |
| Veto Counter | 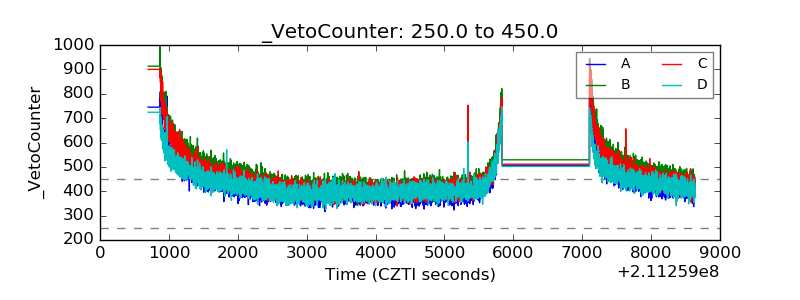 |