| Param | Original file | Final file |
|---|---|---|
| Filename | modeM0/AS1G05_214T01_9000000652_05168cztM0_level2.evt | modeM0/AS1G05_214T01_9000000652_05168cztM0_level2_quad_clean.evt |
| Size (bytes) | 437,431,680 | 58,608,000 |
| Size | 417.2 MB | 55.9 MB |
| Events in quadrant A | 3,216,146 | 334,777 |
| Events in quadrant B | 3,277,823 | 339,967 |
| Events in quadrant C | 3,101,596 | 337,018 |
| Events in quadrant D | 3,219,147 | 318,474 |
| Mode SS | |||
|---|---|---|---|
| Quadrant | BADHDUFLAG | Total packets | Discarded packets |
| A | 0 | 128 | 0 |
| B | 0 | 128 | 0 |
| C | 0 | 128 | 0 |
| D | 0 | 128 | 0 |
| Mode M9 | |||
|---|---|---|---|
| Quadrant | BADHDUFLAG | Total packets | Discarded packets |
| A | 0 | 20 | 0 |
| B | 0 | 20 | 0 |
| C | 0 | 20 | 0 |
| D | 0 | 21 | 0 |
| Mode M0 | |||
|---|---|---|---|
| Quadrant | BADHDUFLAG | Total packets | Discarded packets |
| A | 0 | 13521 | 3 |
| B | 0 | 13549 | 2 |
| C | 0 | 13259 | 2 |
| D | 0 | 13931 | 2 |
| Quadrant | Total seconds | Saturated seconds | Saturation percentage |
|---|---|---|---|
| A | 6368 | 119 | 1.868719% |
| B | 6368 | 122 | 1.915829% |
| C | 6368 | 71 | 1.114950% |
| D | 6368 | 126 | 1.978643% |
Noise dominated data is calculated using 1-second bins in cleaned event files. If a bin has >2000 counts, and if more than 50% of those come from <1% of pixels, then it is considered to be noise-dominated and hence unusable.
| Quadrant | # 1 sec bins | Bins with >0 counts | Bins with >2000 counts | High rate bins dominated by noise | Noise dominated (total time) | Noise dominated (detector-on time) | Marked lightcurve |
|---|---|---|---|---|---|---|---|
| A | 7568 | 6369 | 5 | 5 | 0.07% | 0.08% | 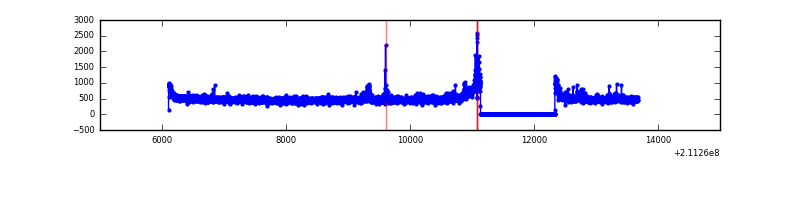 |
| B | 7568 | 6369 | 7 | 7 | 0.09% | 0.11% | 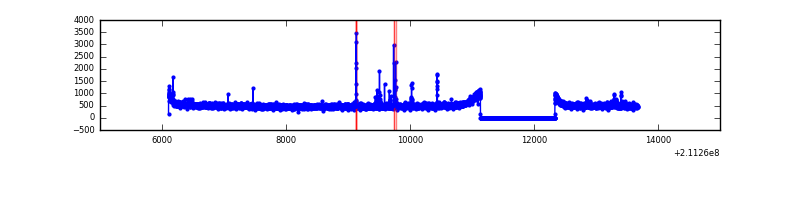 |
| C | 7568 | 6369 | 0 | 0 | 0.00% | 0.00% | 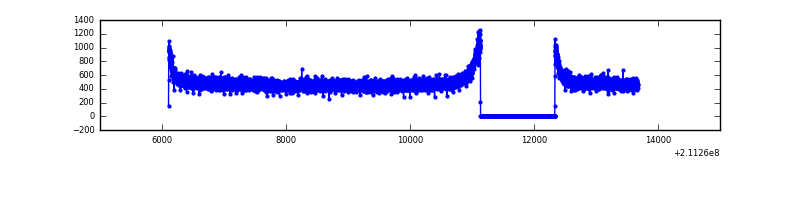 |
| D | 7568 | 6369 | 44 | 44 | 0.58% | 0.69% | 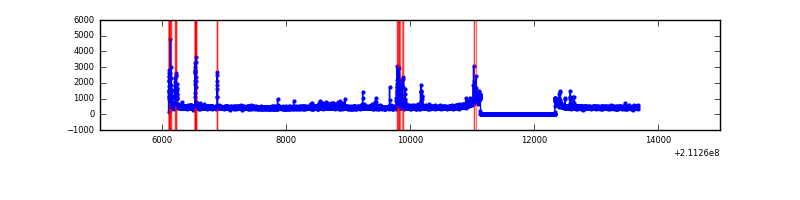 |
Top three noisy pixels from each quadrant. If the there are fewer than three noisy pixels in the level2.evt file, extra rows are filled as -1
| Pixel properties | Quadrant properties | ||||||
|---|---|---|---|---|---|---|---|
| Quadrant | DetID | PixID | Counts | Sigma | Mean | Median | Sigma |
| A | 0 | 247 | 66273 | 401.72 | 807 | 791 | 163.0 |
| A | 0 | 50 | 28186 | 168.07 | 807 | 791 | 163.0 |
| A | 0 | 226 | 14225 | 82.42 | 807 | 791 | 163.0 |
| B | 5 | 70 | 21088 | 129.21 | 821 | 802 | 157.0 |
| B | 4 | 239 | 16108 | 97.49 | 821 | 802 | 157.0 |
| B | 15 | 54 | 15636 | 94.48 | 821 | 802 | 157.0 |
| C | 1 | 16 | 50363 | 271.47 | 782 | 787 | 182.6 |
| C | 13 | 61 | 6434 | 30.92 | 782 | 787 | 182.6 |
| C | 14 | 67 | 2170 | 7.57 | 782 | 787 | 182.6 |
| D | 14 | 34 | 77021 | 399.38 | 775 | 752 | 191.0 |
| D | 13 | 105 | 75245 | 390.08 | 775 | 752 | 191.0 |
| D | 2 | 33 | 52436 | 270.64 | 775 | 752 | 191.0 |
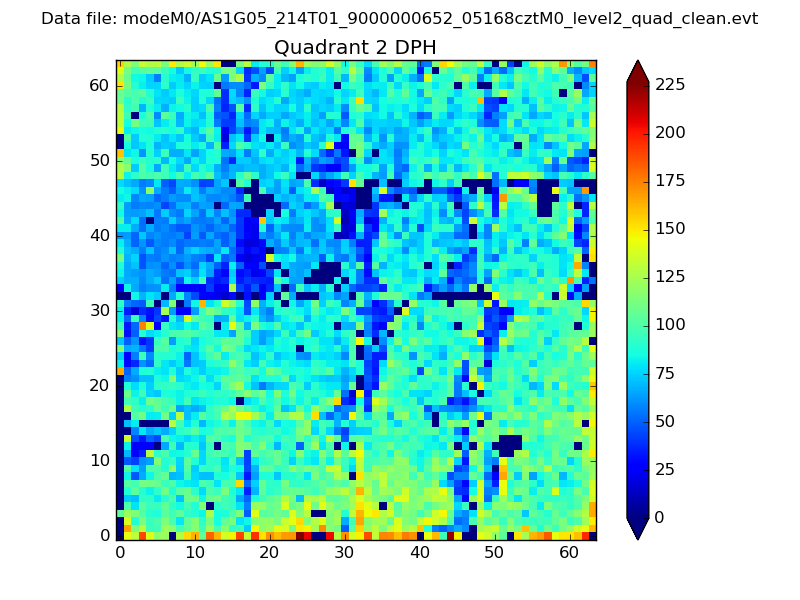
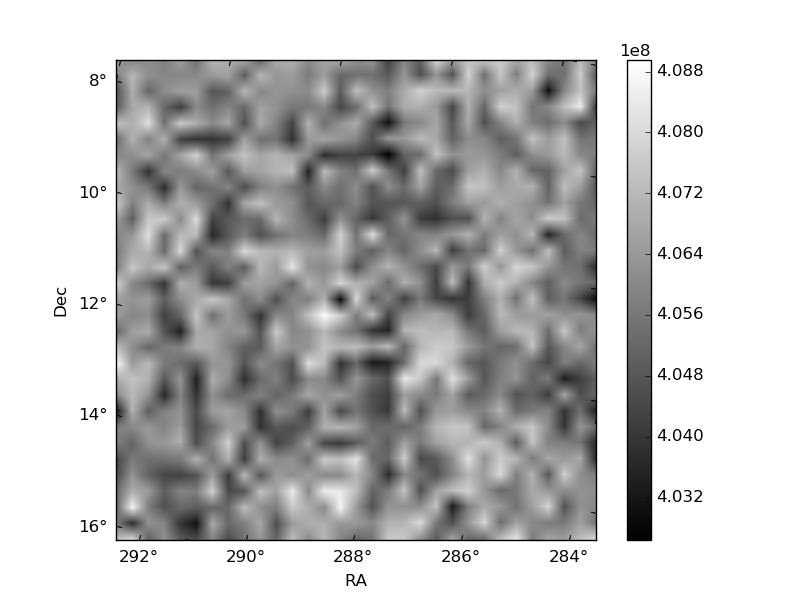
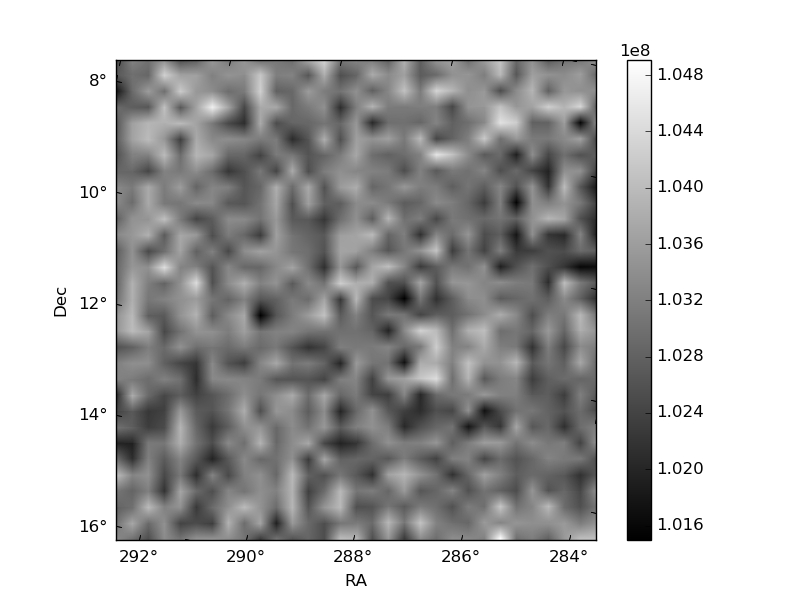
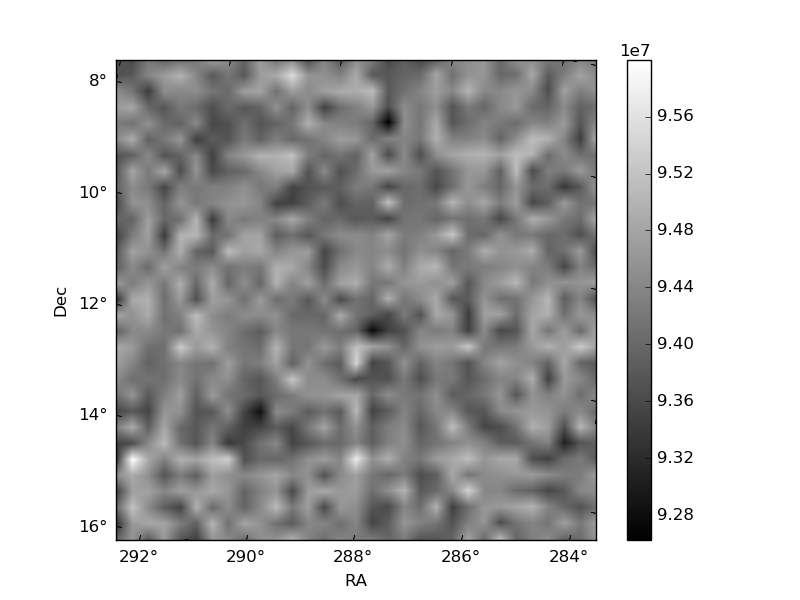
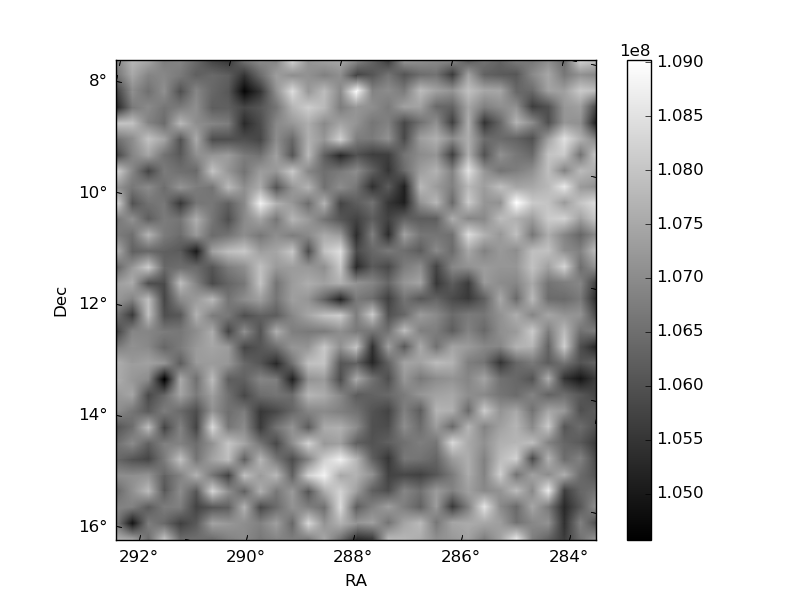
Histogram calculated using DETX and DETY for each event in the final _common_clean file
| Quadrant A | 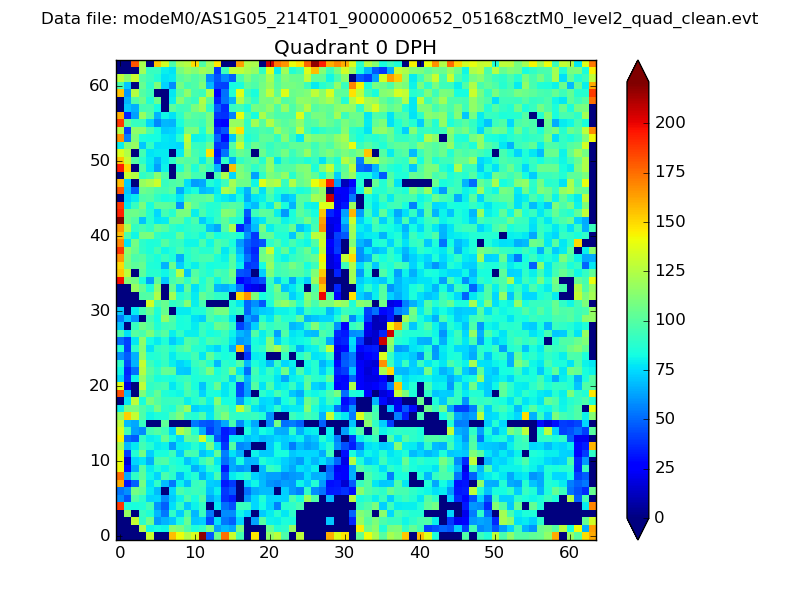 |
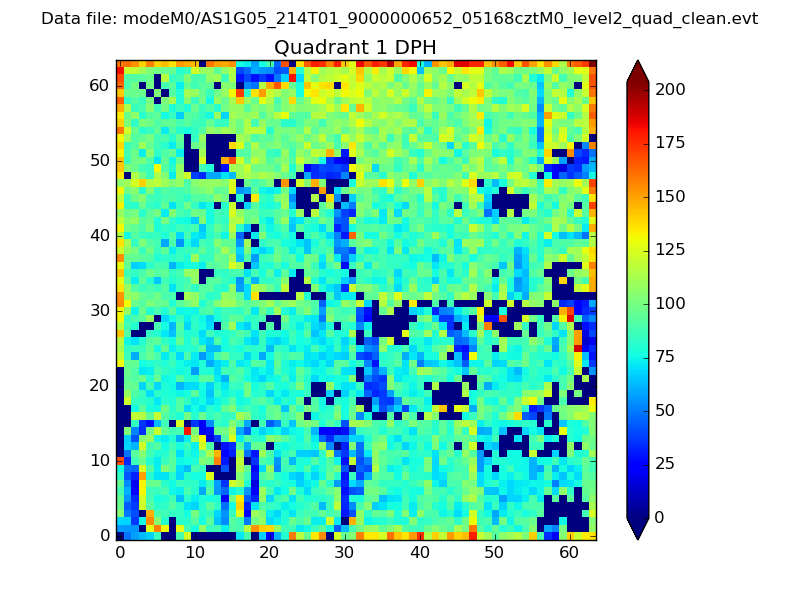 |
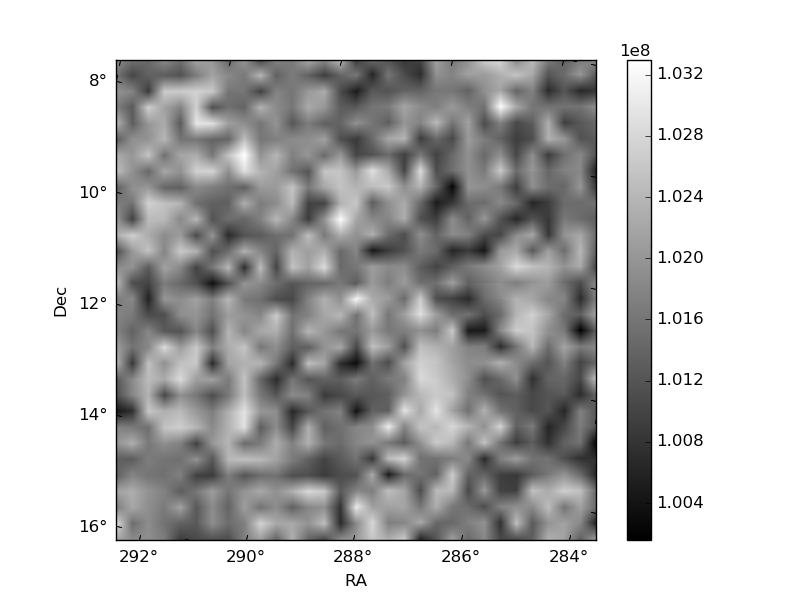
Quadrant B |
|---|---|---|---|
| Quadrant D | 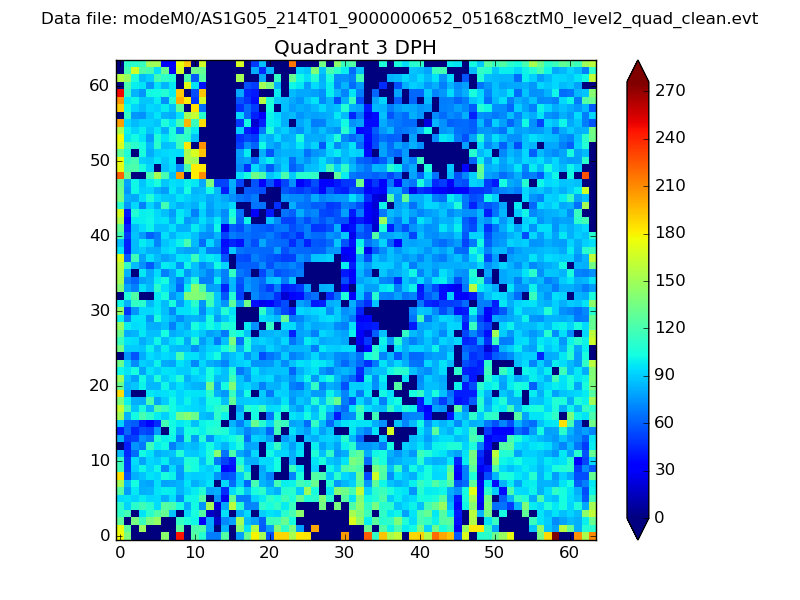 |
 |
Quadrant C |
| Plot type | Count rate plots | Images |
|---|---|---|
| Comparison with Poisson distribution Blue bars denote a histogram of data divided into 1 sec bins. Red curve is a Poisson curve with rate = median count rate of data. |
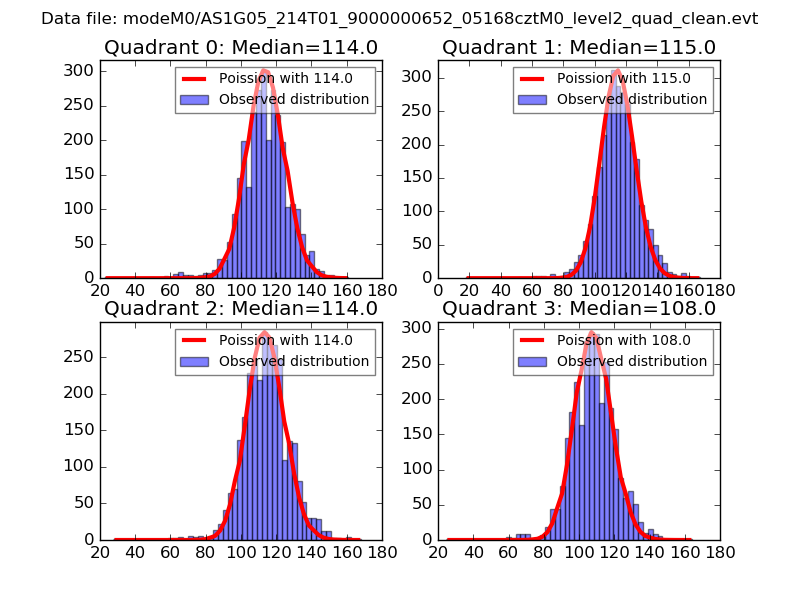 |
 |
| Quadrant-wise count rates Data is divided into 100 sec bins |
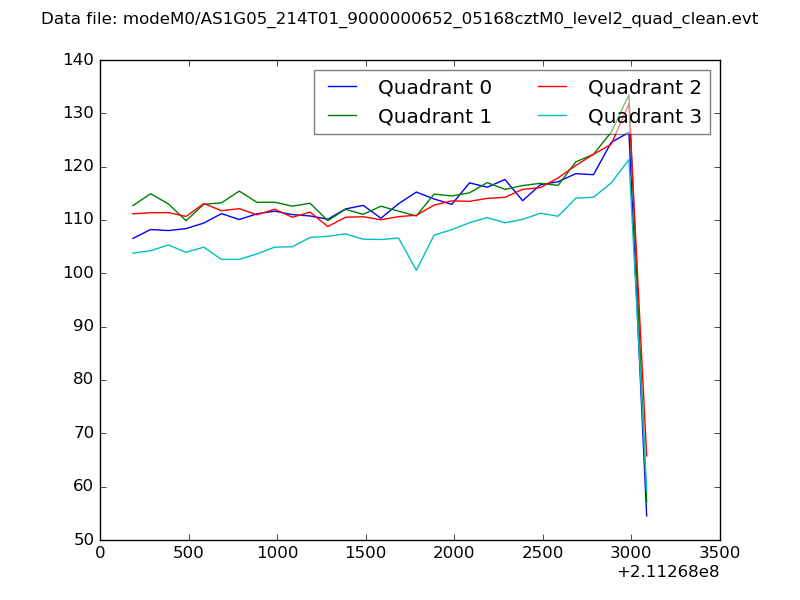 |
|
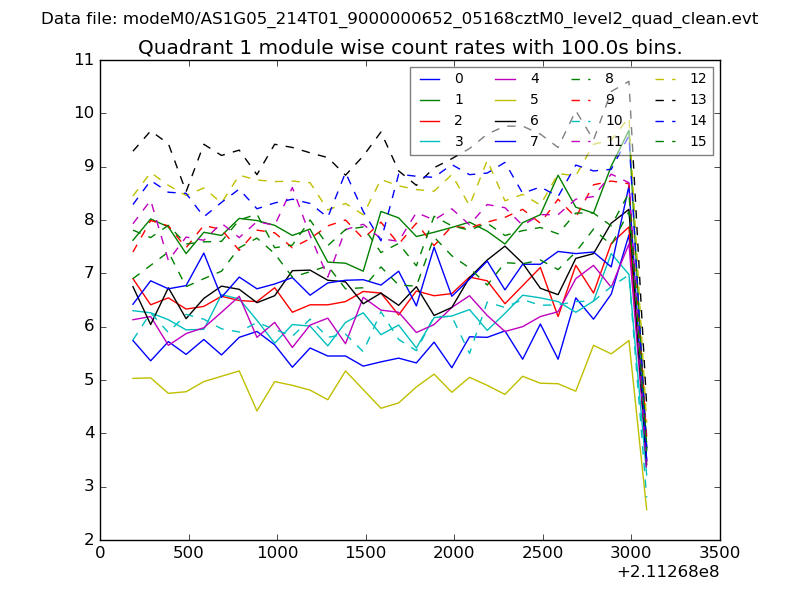
| Module-wise count rates for Quadrant A Data is divided into 100 sec bins |
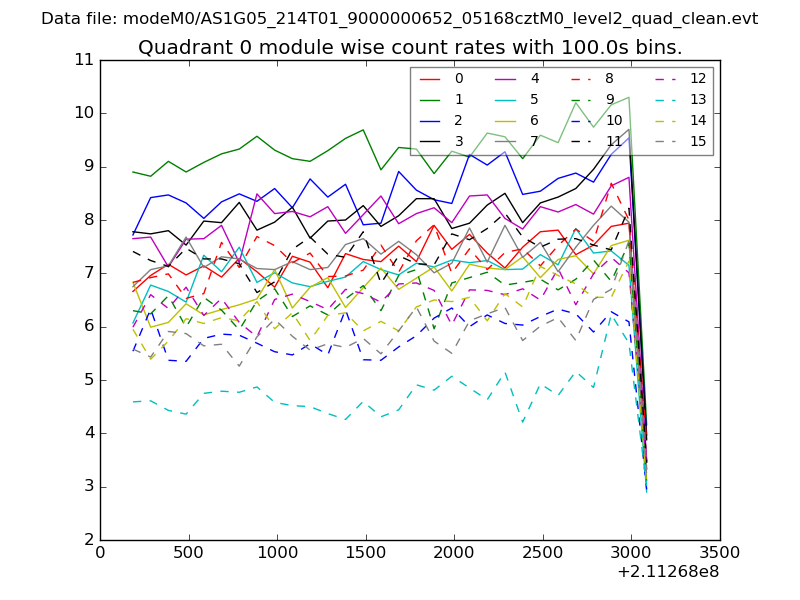 |
 |
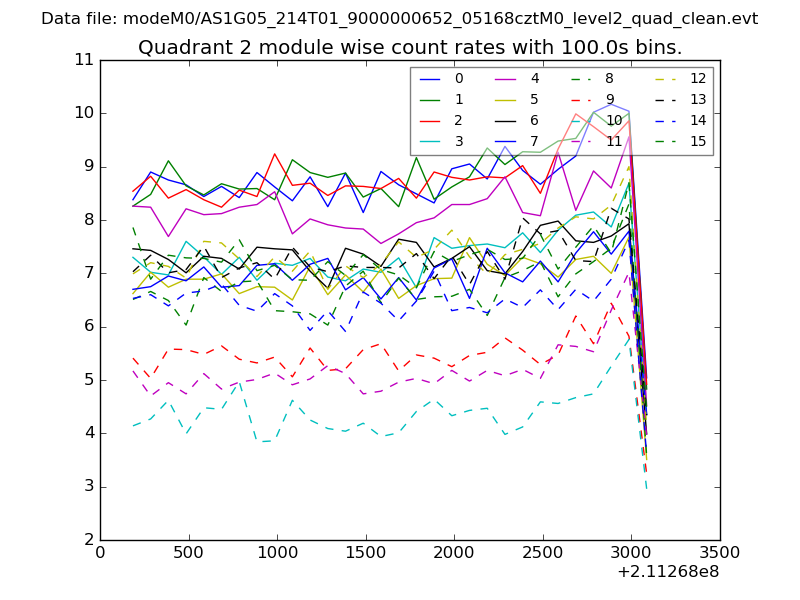
| Module-wise count rates for Quadrant B Data is divided into 100 sec bins |
 |
 |
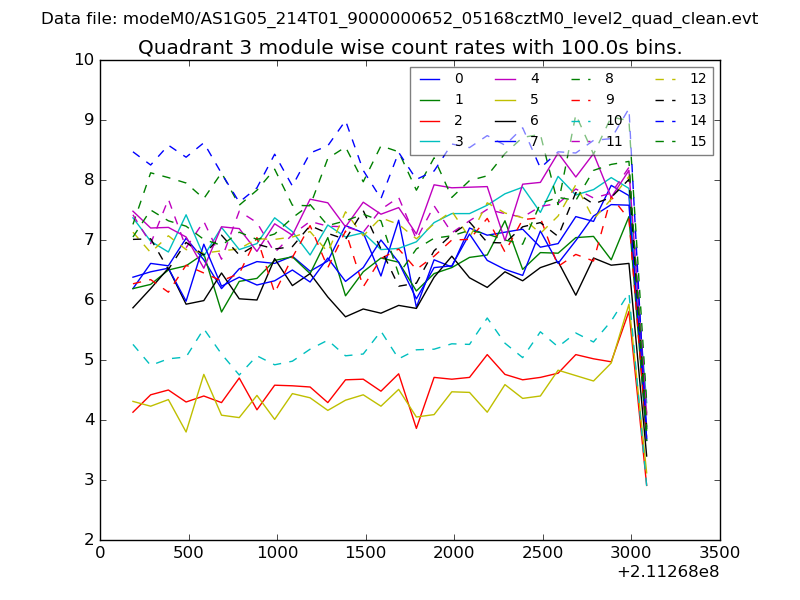
| Module-wise count rates for Quadrant C Data is divided into 100 sec bins |
 |
 |
| Module-wise count rates for Quadrant D Data is divided into 100 sec bins |
 |
 |
| Parameter | Plot |
|---|---|
| CZT HV Monitor | 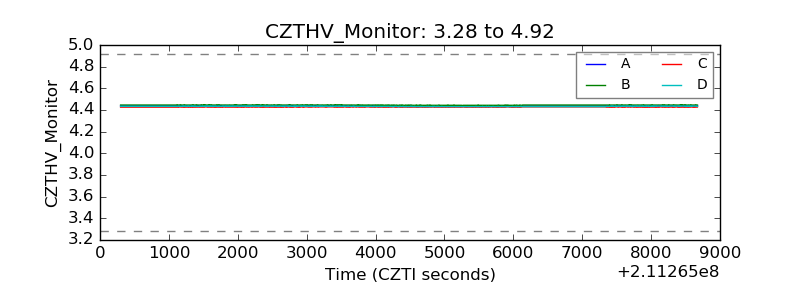 |
| D_VDD | 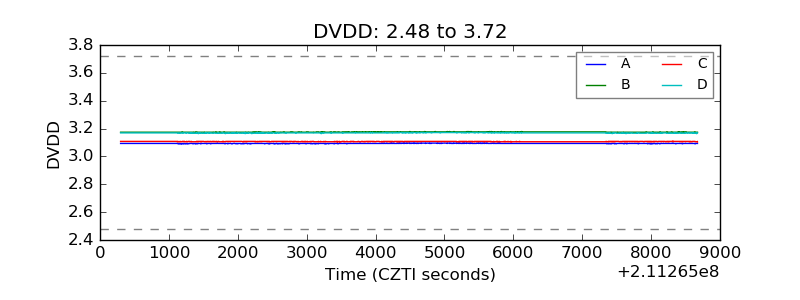 |
| Temperature 1 | 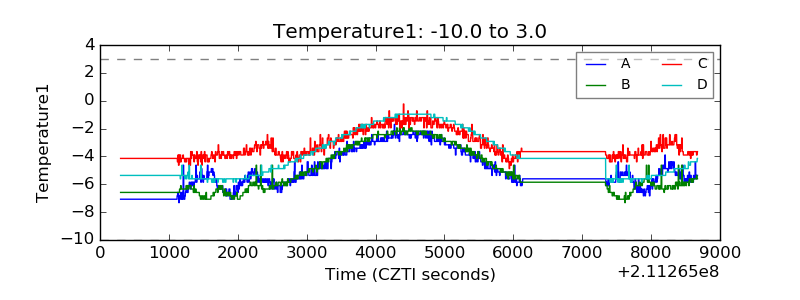 |
| Veto HV Monitor | 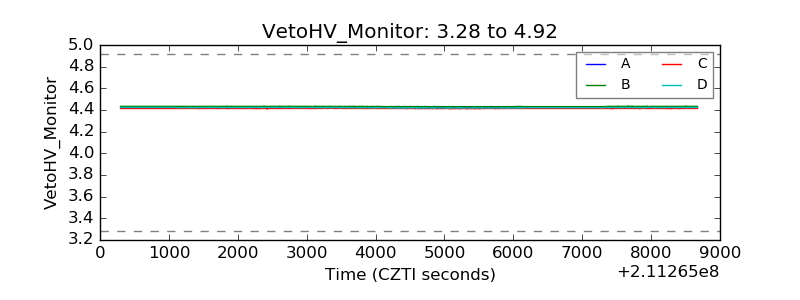 |
| Veto LLD | 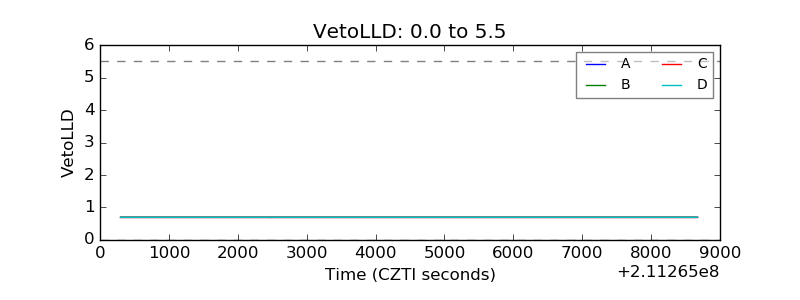 |
| Alpha Counter | 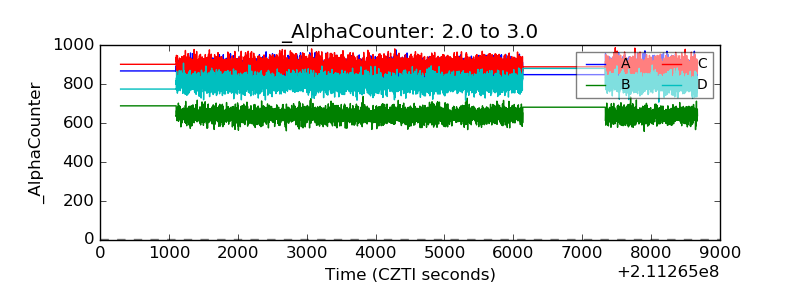 |
| _CPM_Rate | 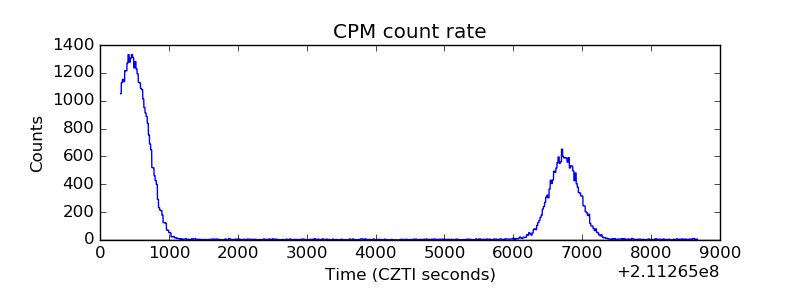 |
| CZT Counter | 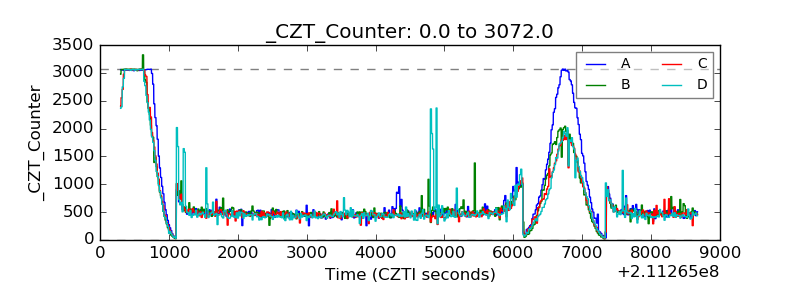 |
| +2.5 Volts monitor | 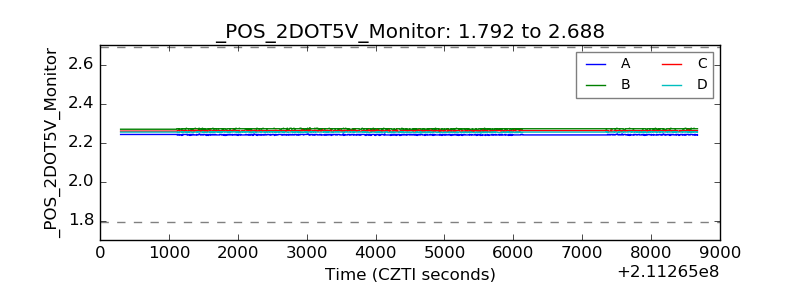 |
| +5 Volts monitor | 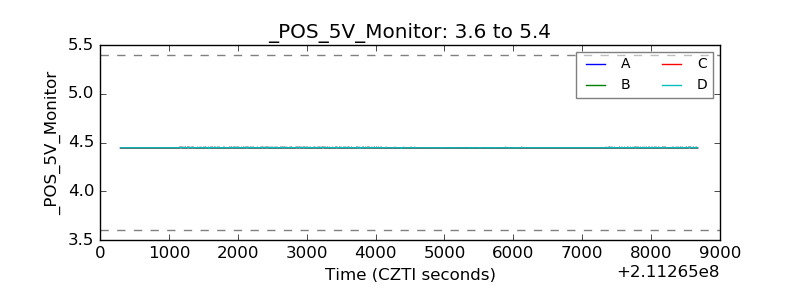 |
| _ROLL_ROT | 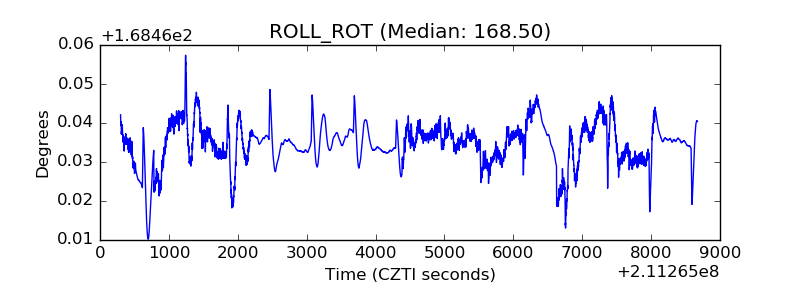 |
| _Roll_DEC | 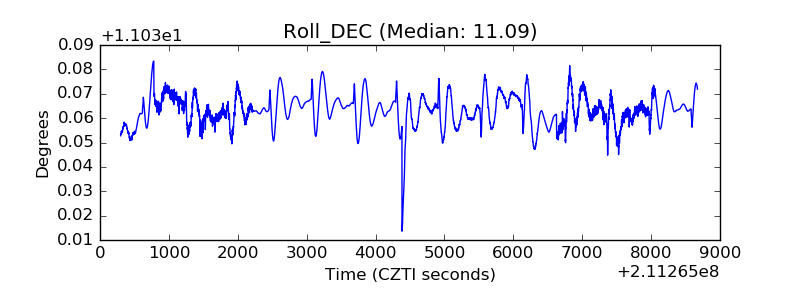 |
| _Roll_RA | 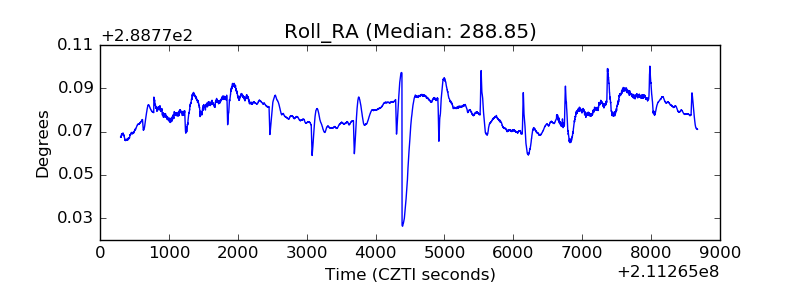 |
| Veto Counter | 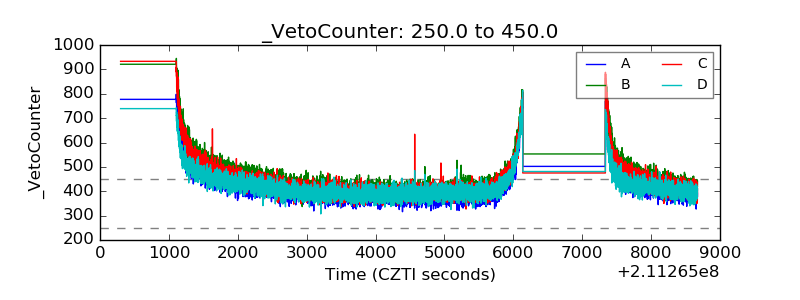 |