| Param | Original file | Final file |
|---|---|---|
| Filename | modeM0/AS1G05_214T01_9000000652_05169cztM0_level2.evt | modeM0/AS1G05_214T01_9000000652_05169cztM0_level2_quad_clean.evt |
| Size (bytes) | 499,633,920 | 78,488,640 |
| Size | 476.5 MB | 74.9 MB |
| Events in quadrant A | 3,784,126 | 469,539 |
| Events in quadrant B | 3,741,003 | 476,348 |
| Events in quadrant C | 3,546,003 | 476,351 |
| Events in quadrant D | 3,567,900 | 449,640 |
| Mode SS | |||
|---|---|---|---|
| Quadrant | BADHDUFLAG | Total packets | Discarded packets |
| A | 0 | 148 | 0 |
| B | 0 | 148 | 0 |
| C | 0 | 148 | 0 |
| D | 0 | 148 | 0 |
| Mode M9 | |||
|---|---|---|---|
| Quadrant | BADHDUFLAG | Total packets | Discarded packets |
| A | 0 | 22 | 0 |
| B | 0 | 22 | 0 |
| C | 0 | 22 | 0 |
| D | 0 | 22 | 0 |
| Mode M0 | |||
|---|---|---|---|
| Quadrant | BADHDUFLAG | Total packets | Discarded packets |
| A | 0 | 15887 | 3 |
| B | 0 | 15547 | 2 |
| C | 0 | 15316 | 2 |
| D | 0 | 15656 | 2 |
| Quadrant | Total seconds | Saturated seconds | Saturation percentage |
|---|---|---|---|
| A | 7248 | 264 | 3.642384% |
| B | 7248 | 227 | 3.131898% |
| C | 7248 | 155 | 2.138521% |
| D | 7248 | 176 | 2.428256% |
Noise dominated data is calculated using 1-second bins in cleaned event files. If a bin has >2000 counts, and if more than 50% of those come from <1% of pixels, then it is considered to be noise-dominated and hence unusable.
| Quadrant | # 1 sec bins | Bins with >0 counts | Bins with >2000 counts | High rate bins dominated by noise | Noise dominated (total time) | Noise dominated (detector-on time) | Marked lightcurve |
|---|---|---|---|---|---|---|---|
| A | 9418 | 7250 | 25 | 25 | 0.27% | 0.34% | 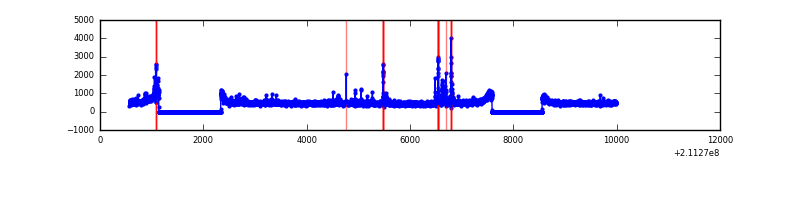 |
| B | 9418 | 7250 | 0 | 0 | 0.00% | 0.00% | 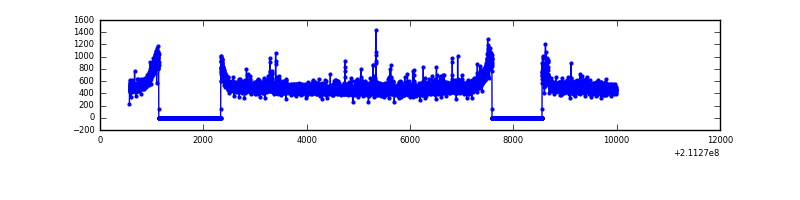 |
| C | 9418 | 7250 | 2 | 2 | 0.02% | 0.03% | 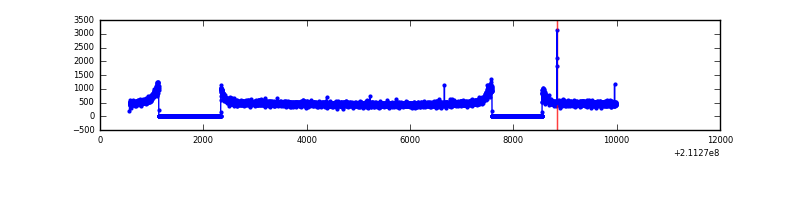 |
| D | 9418 | 7250 | 23 | 23 | 0.24% | 0.32% | 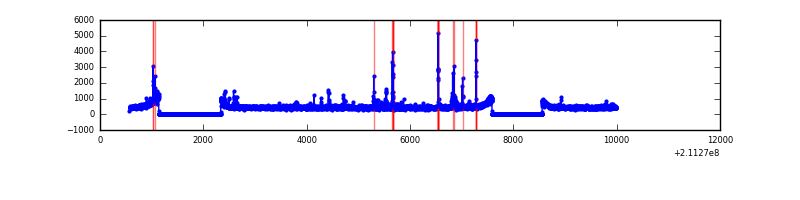 |
Top three noisy pixels from each quadrant. If the there are fewer than three noisy pixels in the level2.evt file, extra rows are filled as -1
| Pixel properties | Quadrant properties | ||||||
|---|---|---|---|---|---|---|---|
| Quadrant | DetID | PixID | Counts | Sigma | Mean | Median | Sigma |
| A | 0 | 50 | 123378 | 649.56 | 919 | 898 | 188.6 |
| A | 0 | 247 | 90280 | 474.03 | 919 | 898 | 188.6 |
| A | 4 | 2 | 23503 | 119.88 | 919 | 898 | 188.6 |
| B | 4 | 80 | 58358 | 318.31 | 931 | 908 | 180.5 |
| B | 15 | 204 | 31137 | 167.49 | 931 | 908 | 180.5 |
| B | 4 | 239 | 23281 | 123.96 | 931 | 908 | 180.5 |
| C | 1 | 16 | 44259 | 208.44 | 895 | 901 | 208.0 |
| C | 14 | 225 | 9568 | 41.66 | 895 | 901 | 208.0 |
| C | 13 | 61 | 7191 | 30.24 | 895 | 901 | 208.0 |
| D | 2 | 33 | 66403 | 297.17 | 891 | 864 | 220.5 |
| D | 2 | 136 | 50615 | 225.59 | 891 | 864 | 220.5 |
| D | 2 | 221 | 28555 | 125.56 | 891 | 864 | 220.5 |
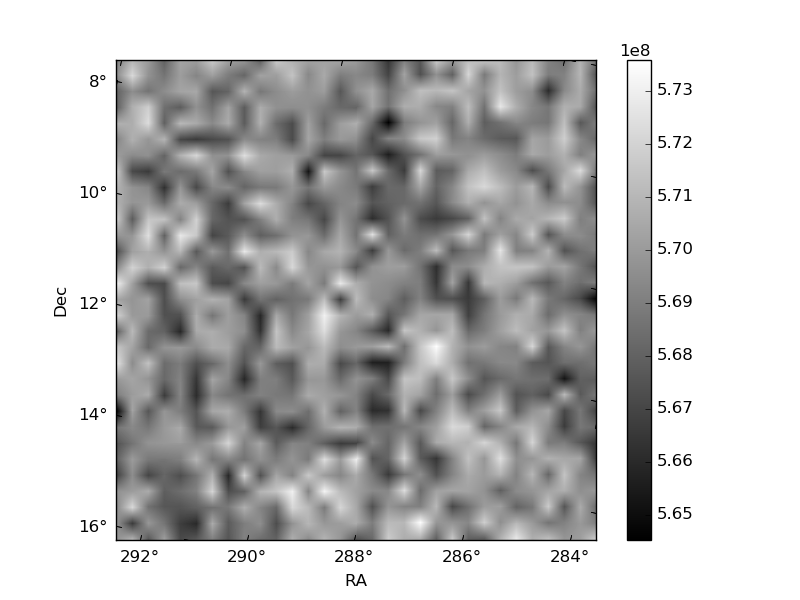
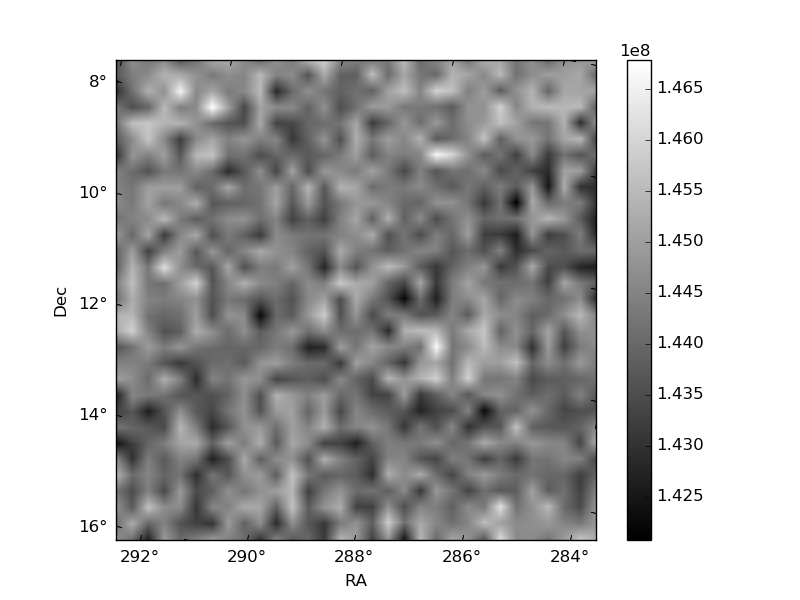
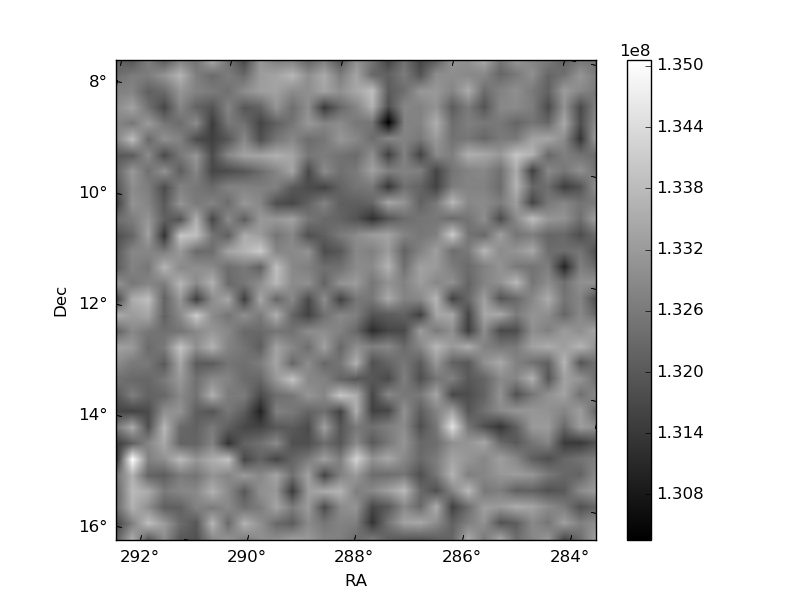
Histogram calculated using DETX and DETY for each event in the final _common_clean file
| Quadrant A | 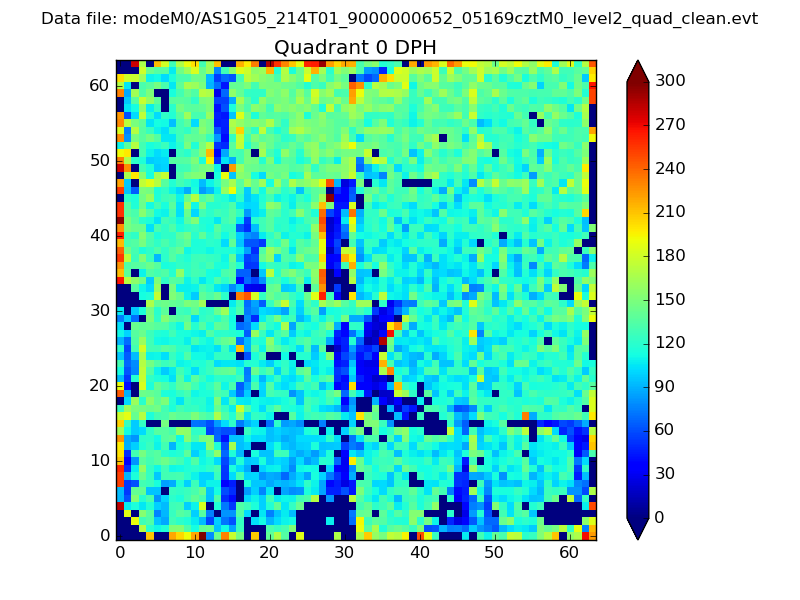 |
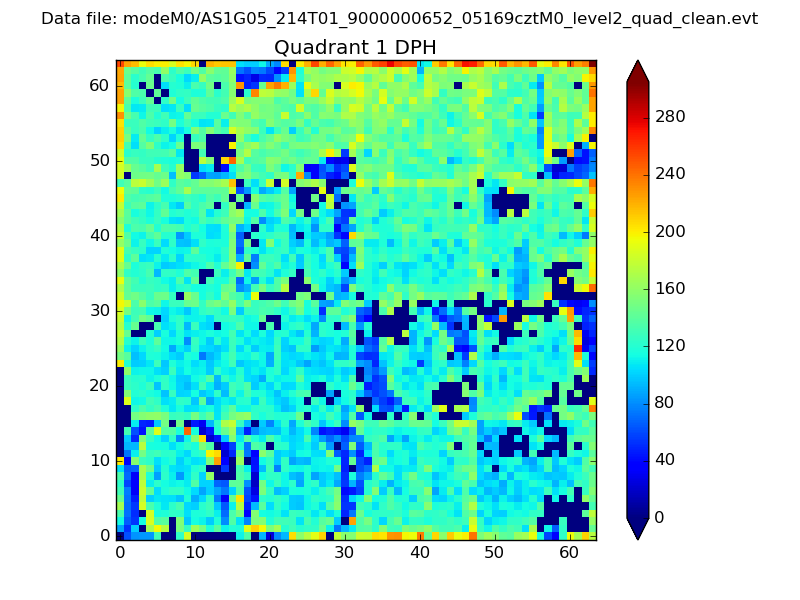 |
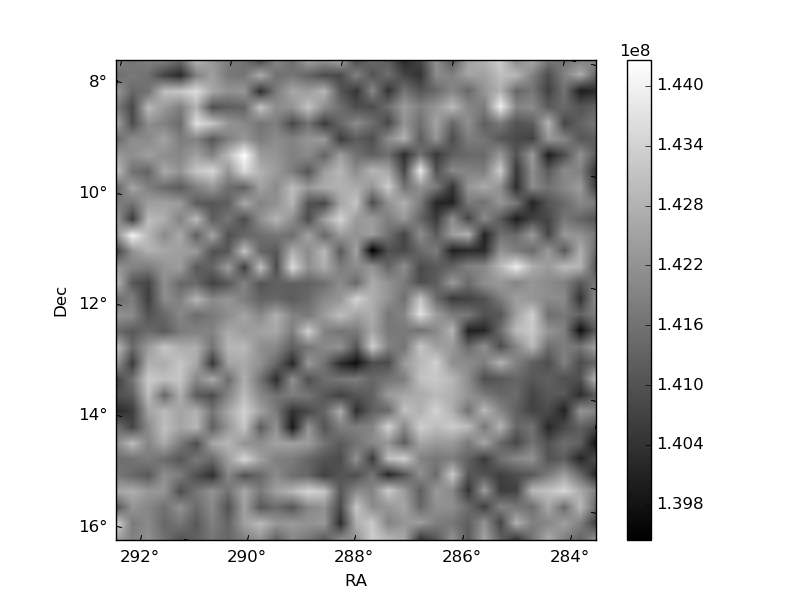
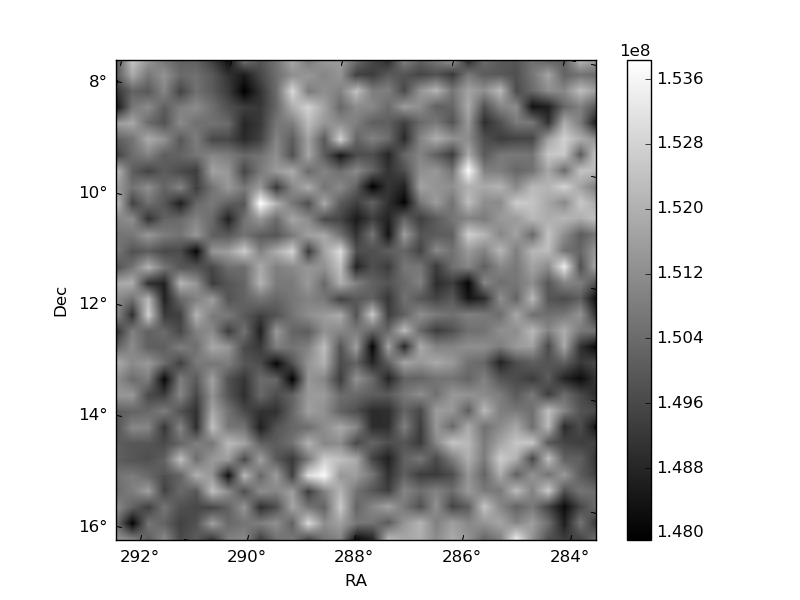
Quadrant B |
|---|---|---|---|
| Quadrant D | 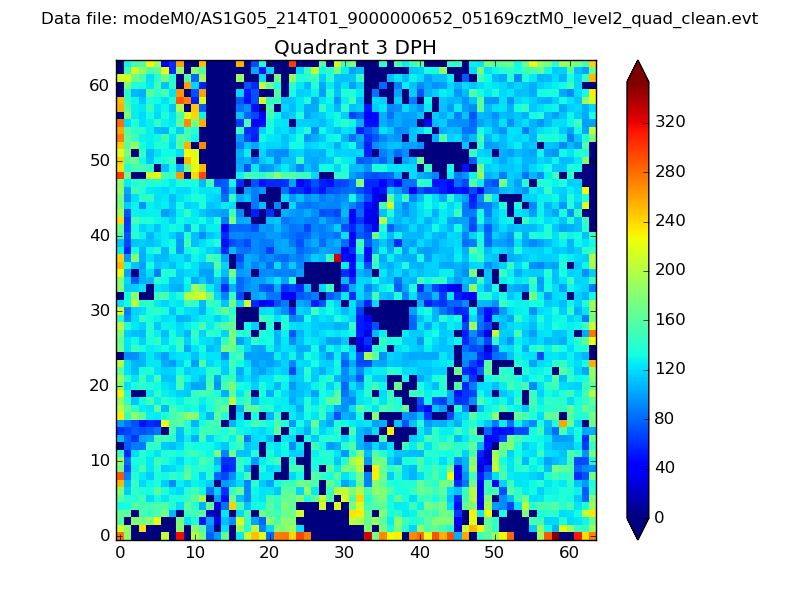 |
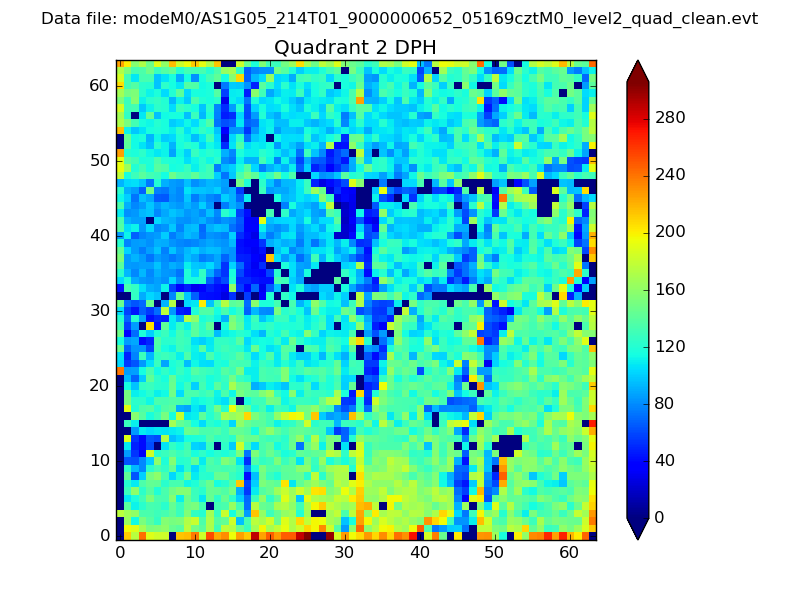 |
Quadrant C |
| Plot type | Count rate plots | Images |
|---|---|---|
| Comparison with Poisson distribution Blue bars denote a histogram of data divided into 1 sec bins. Red curve is a Poisson curve with rate = median count rate of data. |
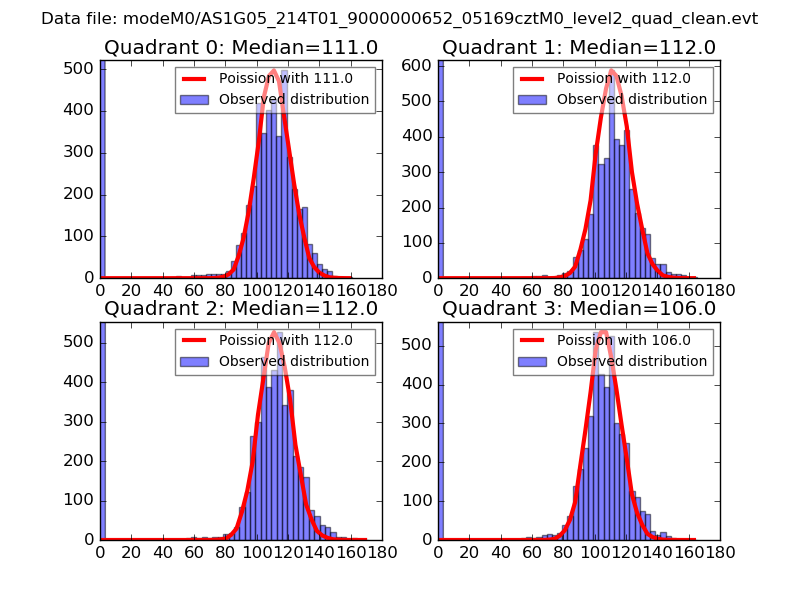 |
 |
| Quadrant-wise count rates Data is divided into 100 sec bins |
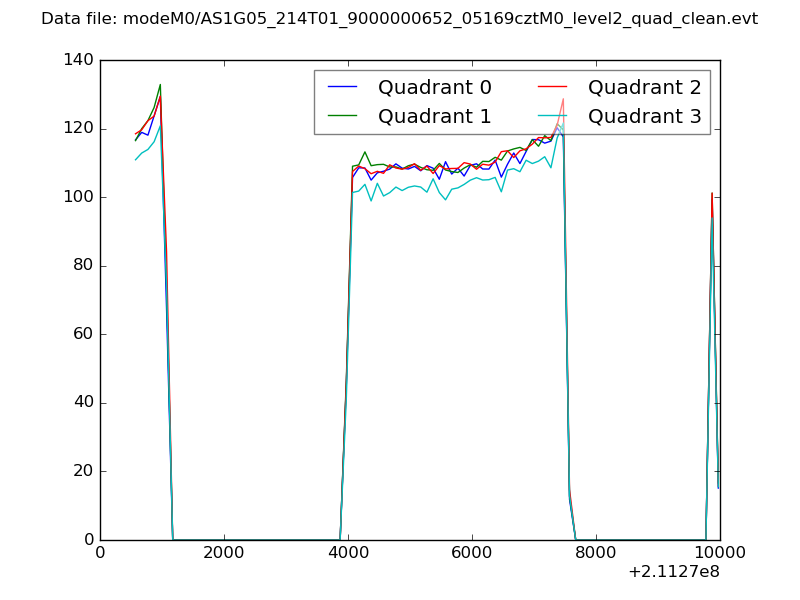 |
|
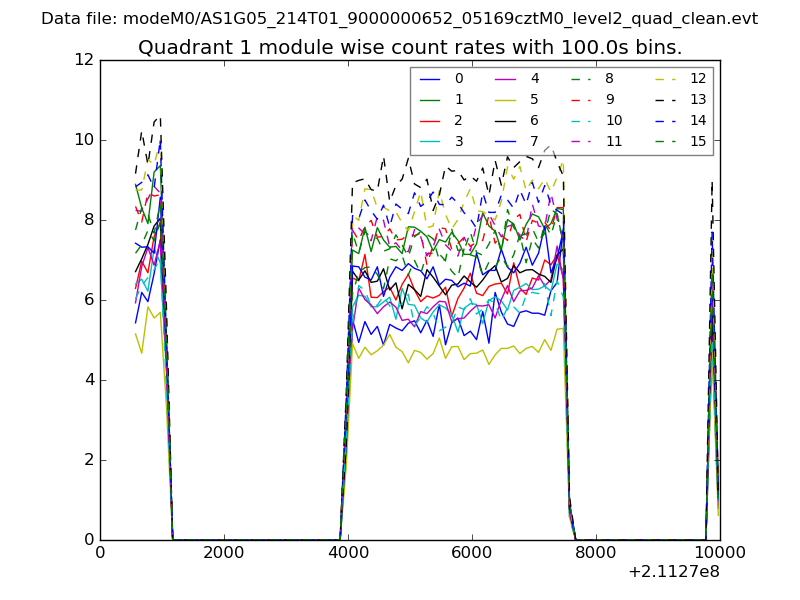
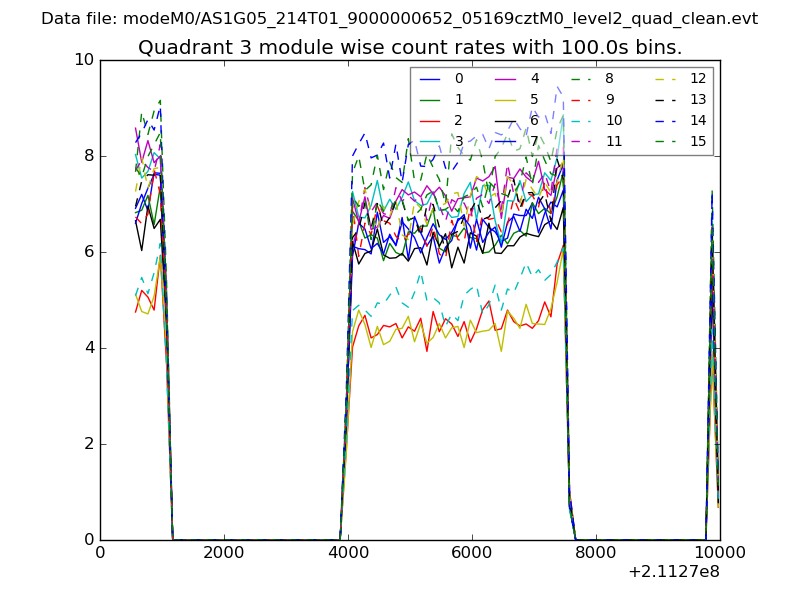
| Module-wise count rates for Quadrant A Data is divided into 100 sec bins |
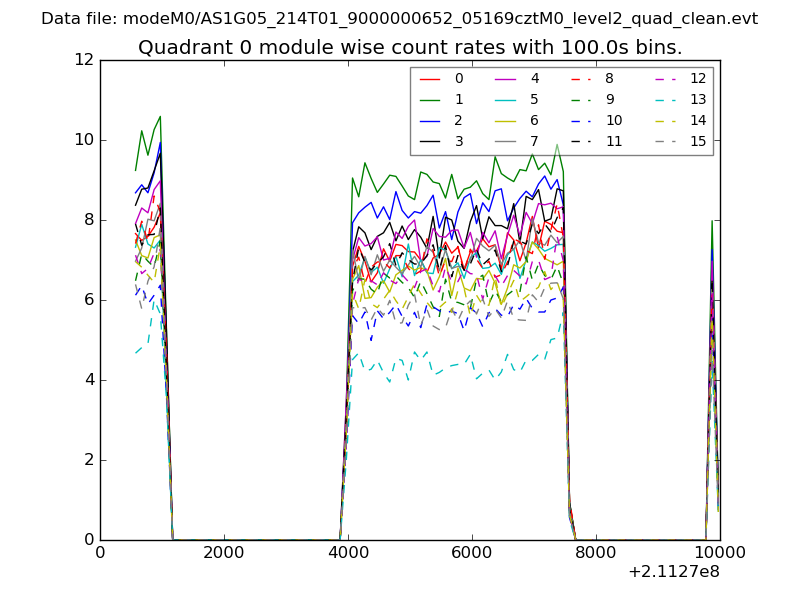 |
 |
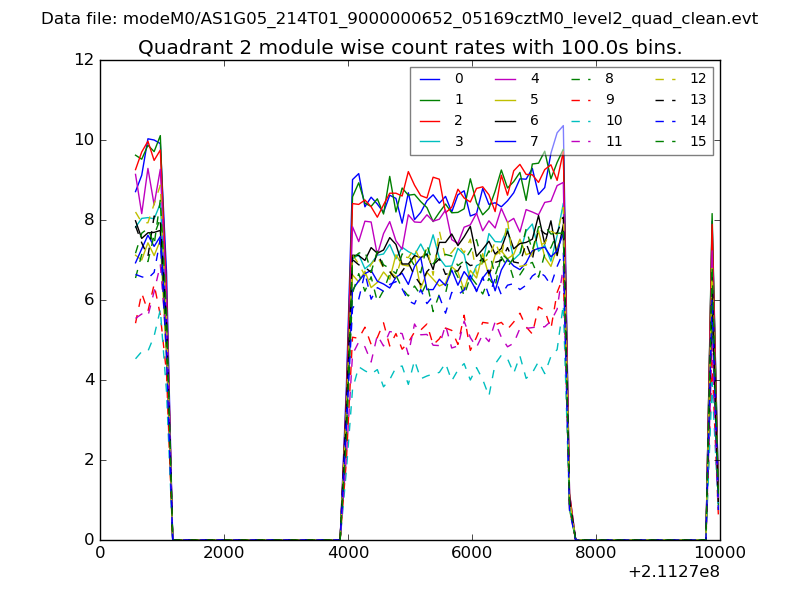
| Module-wise count rates for Quadrant B Data is divided into 100 sec bins |
 |
 |
| Module-wise count rates for Quadrant C Data is divided into 100 sec bins |
 |
 |
| Module-wise count rates for Quadrant D Data is divided into 100 sec bins |
 |
 |
| Parameter | Plot |
|---|---|
| CZT HV Monitor | 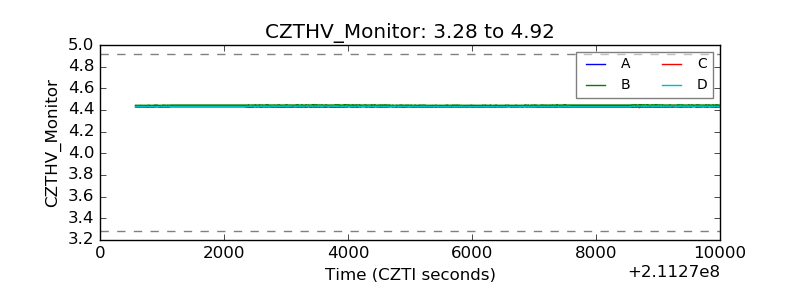 |
| D_VDD | 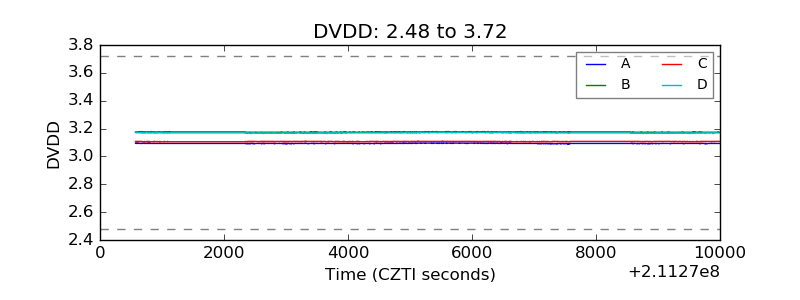 |
| Temperature 1 | 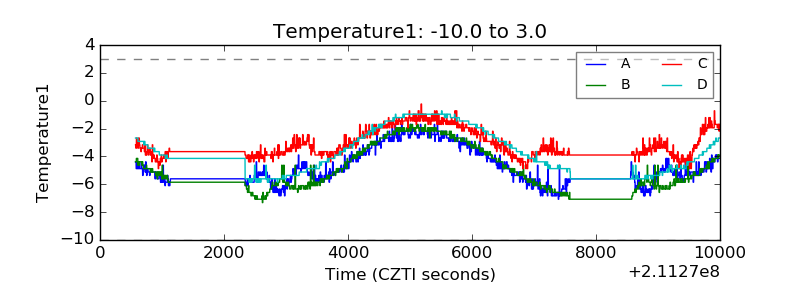 |
| Veto HV Monitor | 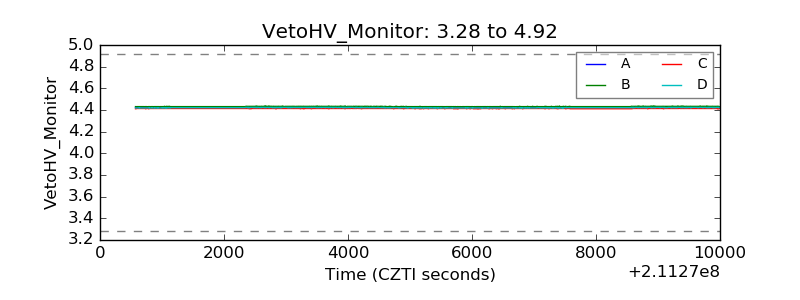 |
| Veto LLD | 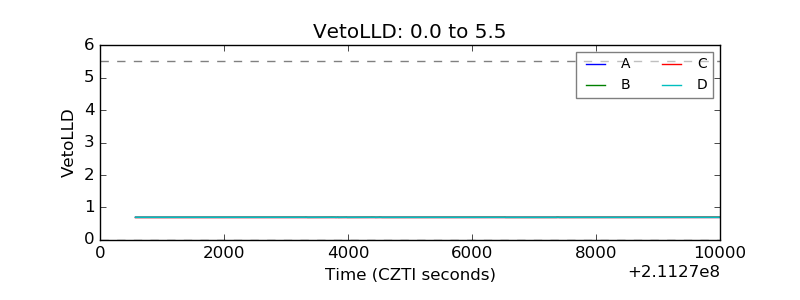 |
| Alpha Counter | 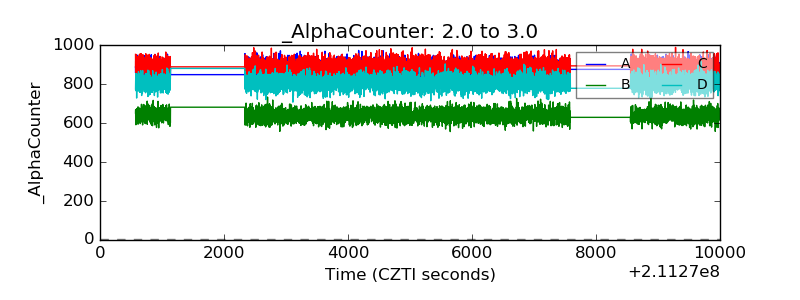 |
| _CPM_Rate | 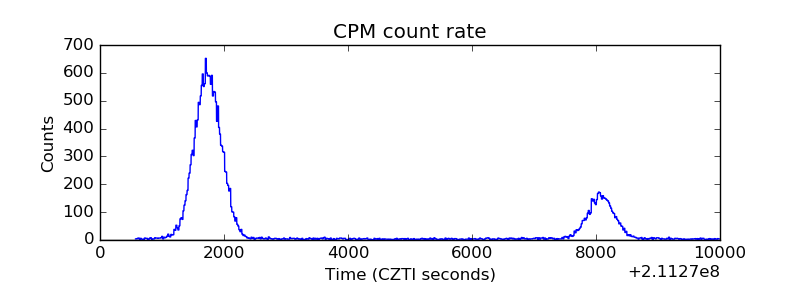 |
| CZT Counter | 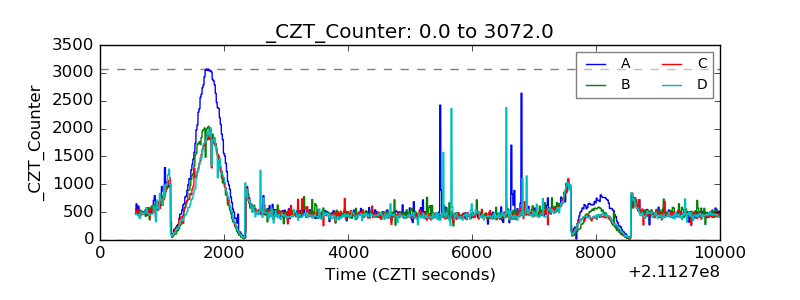 |
| +2.5 Volts monitor | 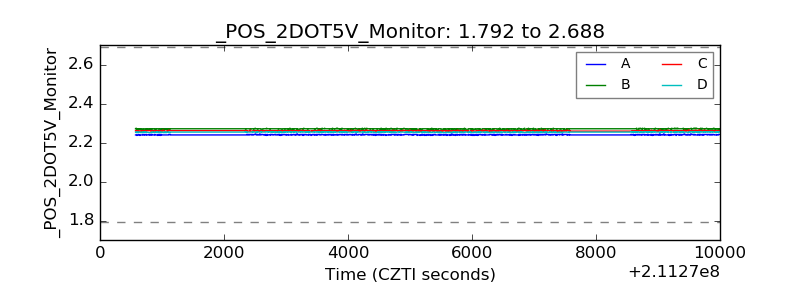 |
| +5 Volts monitor | 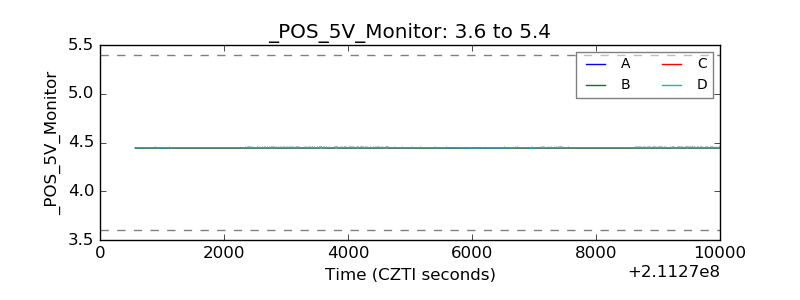 |
| _ROLL_ROT | 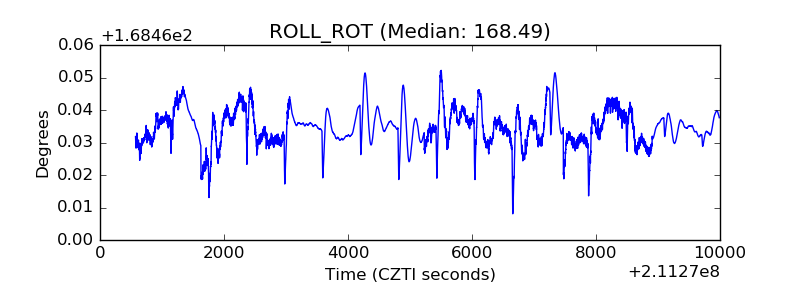 |
| _Roll_DEC | 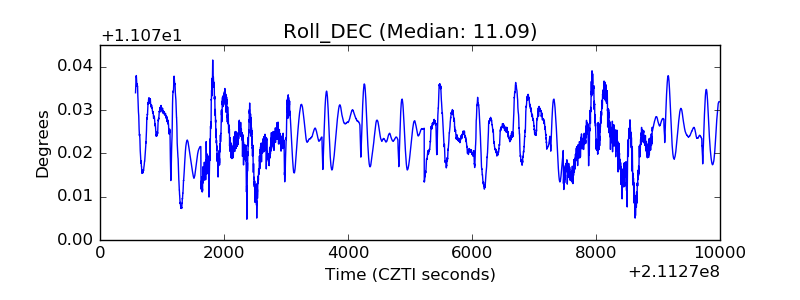 |
| _Roll_RA | 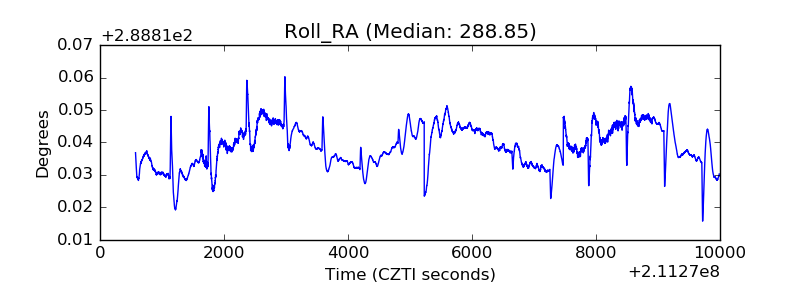 |
| Veto Counter | 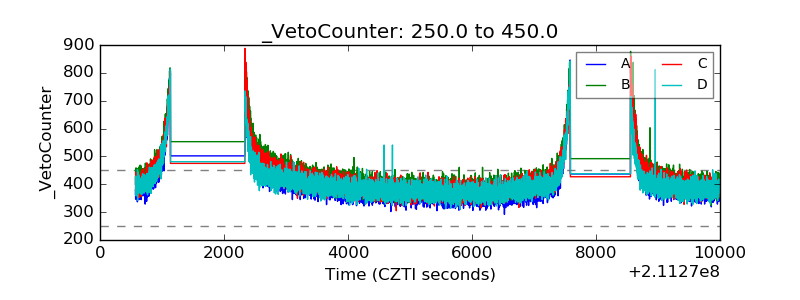 |