| Param | Original file | Final file |
|---|---|---|
| Filename | modeM0/AS1G05_214T01_9000000652_05172cztM0_level2.evt | modeM0/AS1G05_214T01_9000000652_05172cztM0_level2_quad_clean.evt |
| Size (bytes) | 507,000,960 | 79,148,160 |
| Size | 483.5 MB | 75.5 MB |
| Events in quadrant A | 4,371,029 | 475,958 |
| Events in quadrant B | 3,344,130 | 486,992 |
| Events in quadrant C | 3,216,628 | 492,620 |
| Events in quadrant D | 3,953,768 | 460,032 |
| Mode SS | |||
|---|---|---|---|
| Quadrant | BADHDUFLAG | Total packets | Discarded packets |
| A | 0 | 140 | 0 |
| B | 0 | 140 | 0 |
| C | 0 | 140 | 0 |
| D | 0 | 140 | 0 |
| Mode M9 | |||
|---|---|---|---|
| Quadrant | BADHDUFLAG | Total packets | Discarded packets |
| A | 0 | 1 | 0 |
| B | 0 | 1 | 0 |
| C | 0 | 1 | 0 |
| D | 0 | 1 | 0 |
| Mode M0 | |||
|---|---|---|---|
| Quadrant | BADHDUFLAG | Total packets | Discarded packets |
| A | 0 | 17893 | 3 |
| B | 0 | 14498 | 2 |
| C | 0 | 14355 | 4 |
| D | 0 | 16558 | 5 |
| Quadrant | Total seconds | Saturated seconds | Saturation percentage |
|---|---|---|---|
| A | 6903 | 340 | 4.925395% |
| B | 6903 | 196 | 2.839345% |
| C | 6902 | 116 | 1.680672% |
| D | 6902 | 302 | 4.375543% |
Noise dominated data is calculated using 1-second bins in cleaned event files. If a bin has >2000 counts, and if more than 50% of those come from <1% of pixels, then it is considered to be noise-dominated and hence unusable.
| Quadrant | # 1 sec bins | Bins with >0 counts | Bins with >2000 counts | High rate bins dominated by noise | Noise dominated (total time) | Noise dominated (detector-on time) | Marked lightcurve |
|---|---|---|---|---|---|---|---|
| A | 7018 | 6905 | 99 | 99 | 1.41% | 1.43% | 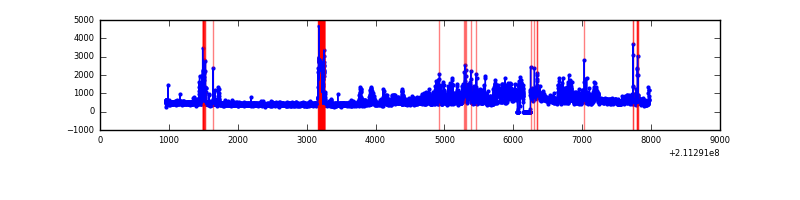 |
| B | 7018 | 6905 | 4 | 4 | 0.06% | 0.06% | 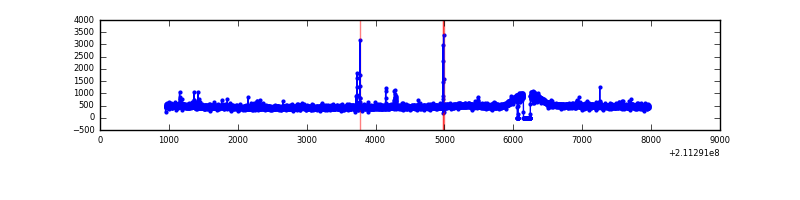 |
| C | 7018 | 6905 | 0 | 0 | 0.00% | 0.00% | 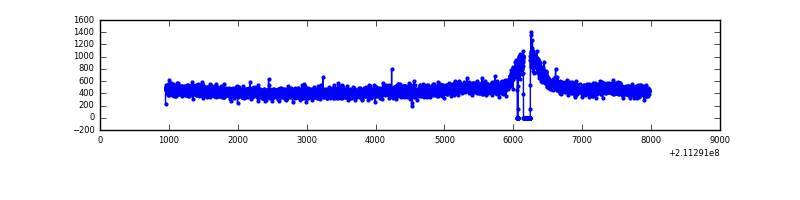 |
| D | 7018 | 6905 | 152 | 152 | 2.17% | 2.20% | 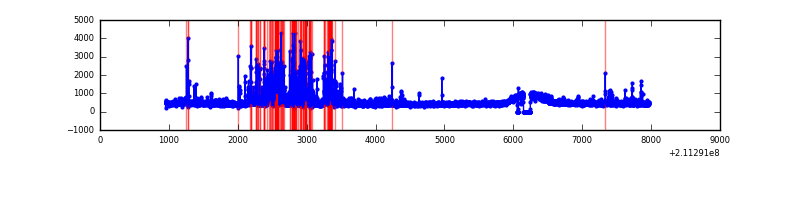 |
Top three noisy pixels from each quadrant. If the there are fewer than three noisy pixels in the level2.evt file, extra rows are filled as -1
| Pixel properties | Quadrant properties | ||||||
|---|---|---|---|---|---|---|---|
| Quadrant | DetID | PixID | Counts | Sigma | Mean | Median | Sigma |
| A | 0 | 247 | 842152 | 4923.07 | 816 | 797 | 170.9 |
| A | 0 | 50 | 206918 | 1206.09 | 816 | 797 | 170.9 |
| A | 0 | 226 | 83827 | 485.84 | 816 | 797 | 170.9 |
| B | 15 | 54 | 21266 | 126.65 | 834 | 816 | 161.5 |
| B | 0 | 219 | 19792 | 117.52 | 834 | 816 | 161.5 |
| B | 4 | 48 | 17394 | 102.67 | 834 | 816 | 161.5 |
| C | 1 | 16 | 30980 | 158.6 | 807 | 812 | 190.2 |
| C | 8 | 128 | 13839 | 68.48 | 807 | 812 | 190.2 |
| C | 12 | 4 | 9118 | 43.67 | 807 | 812 | 190.2 |
| D | 2 | 33 | 671769 | 3357.23 | 804 | 777 | 199.9 |
| D | 8 | 195 | 70495 | 348.83 | 804 | 777 | 199.9 |
| D | 2 | 221 | 43829 | 215.41 | 804 | 777 | 199.9 |
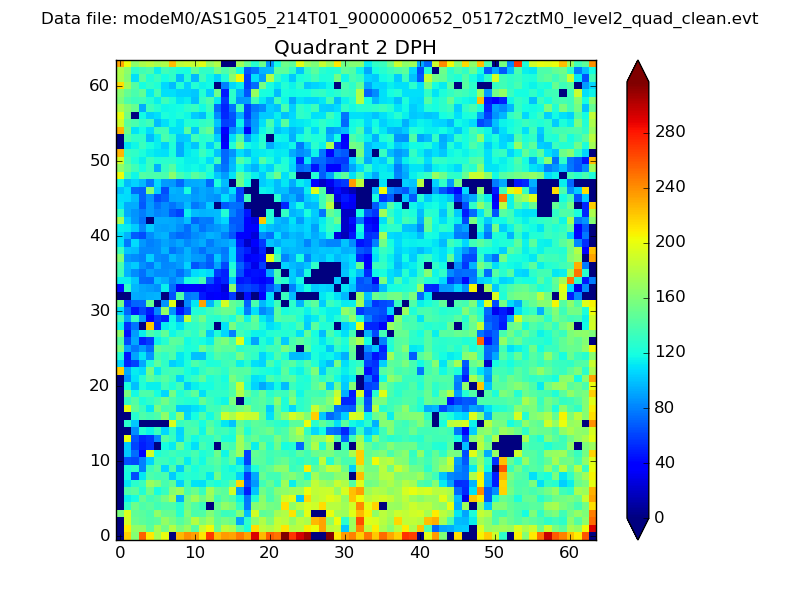
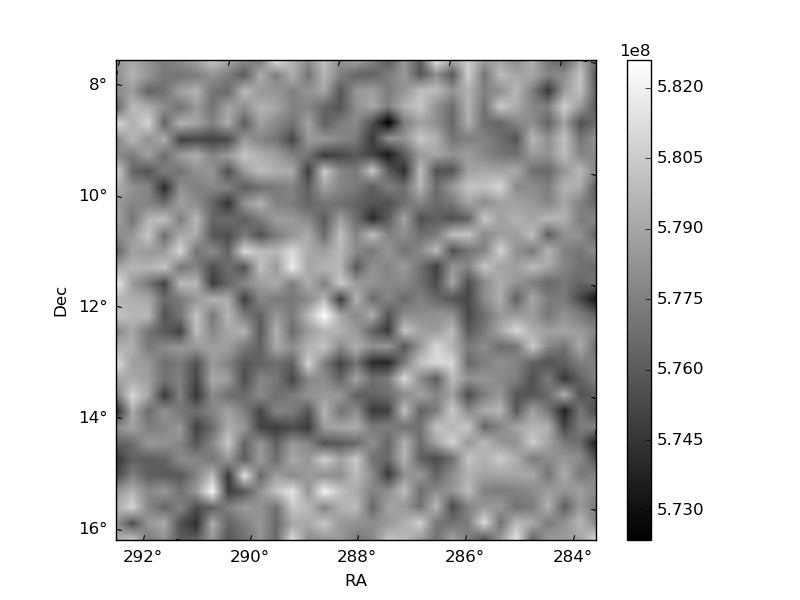
Histogram calculated using DETX and DETY for each event in the final _common_clean file
| Quadrant A | 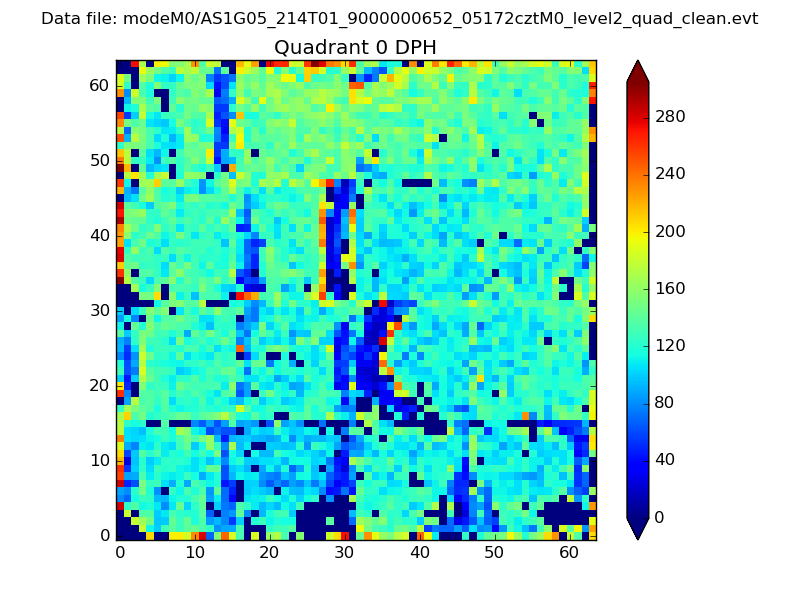 |
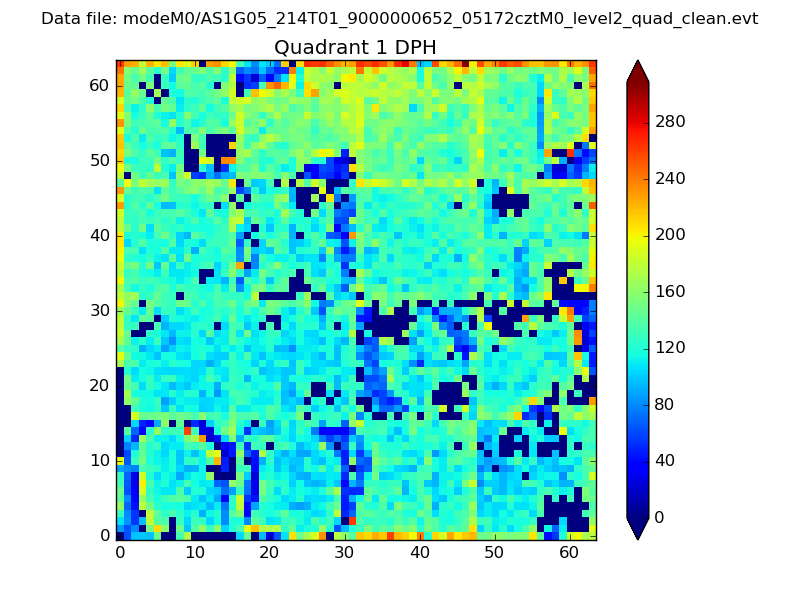 |
Quadrant B |
|---|---|---|---|
| Quadrant D | 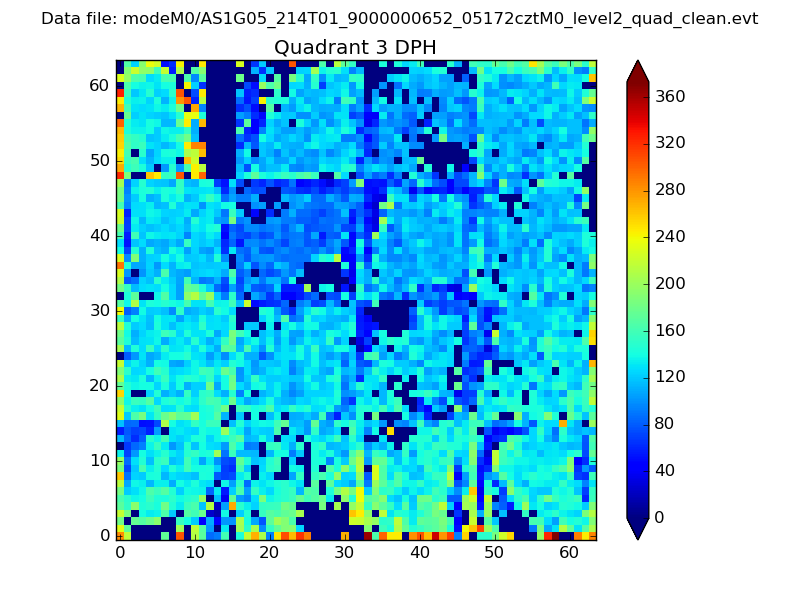 |
 |
Quadrant C |
| Plot type | Count rate plots | Images |
|---|---|---|
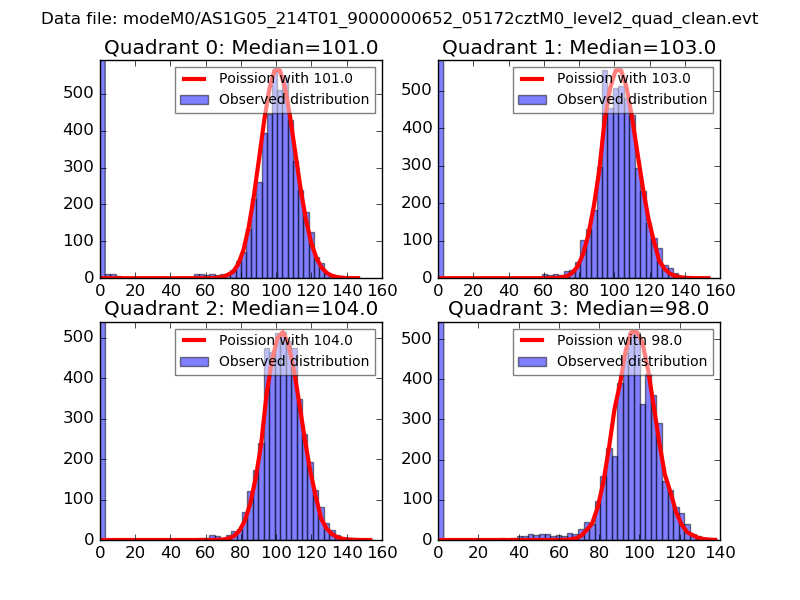
| Comparison with Poisson distribution Blue bars denote a histogram of data divided into 1 sec bins. Red curve is a Poisson curve with rate = median count rate of data. |
 |
 |
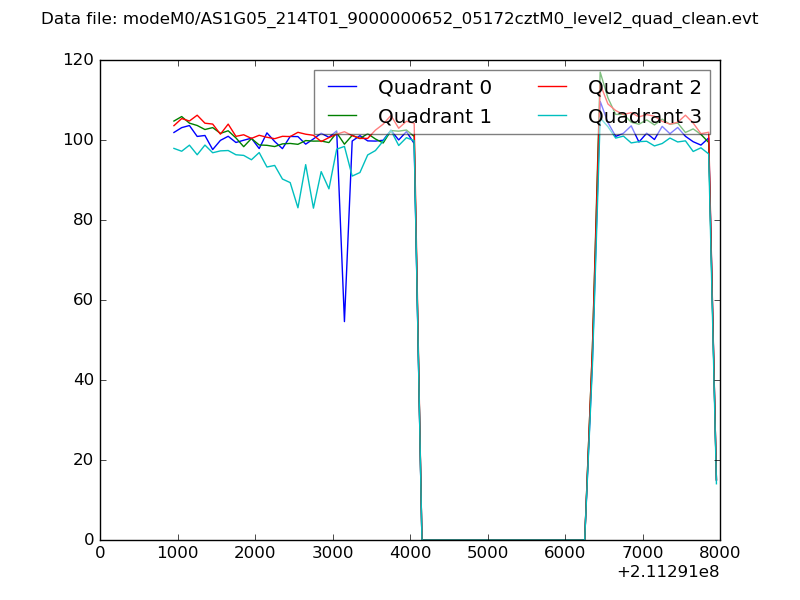
| Quadrant-wise count rates Data is divided into 100 sec bins |
 |
|
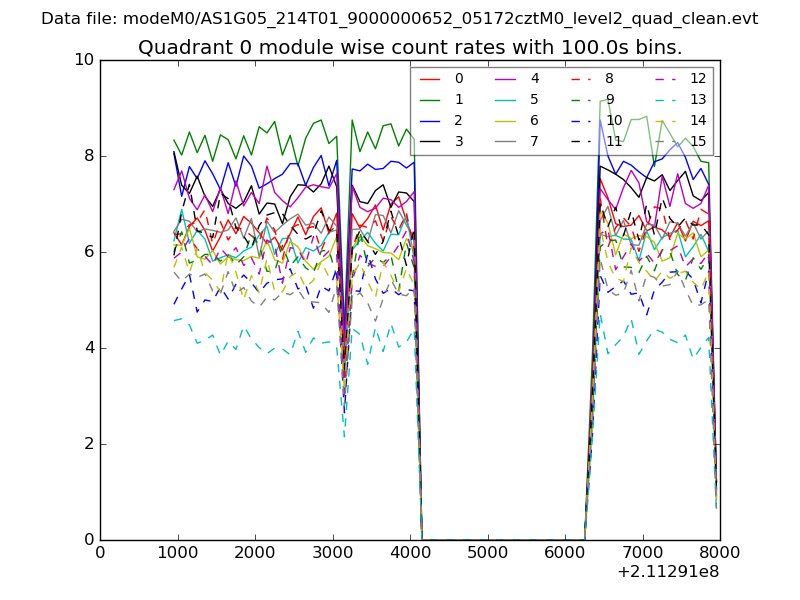
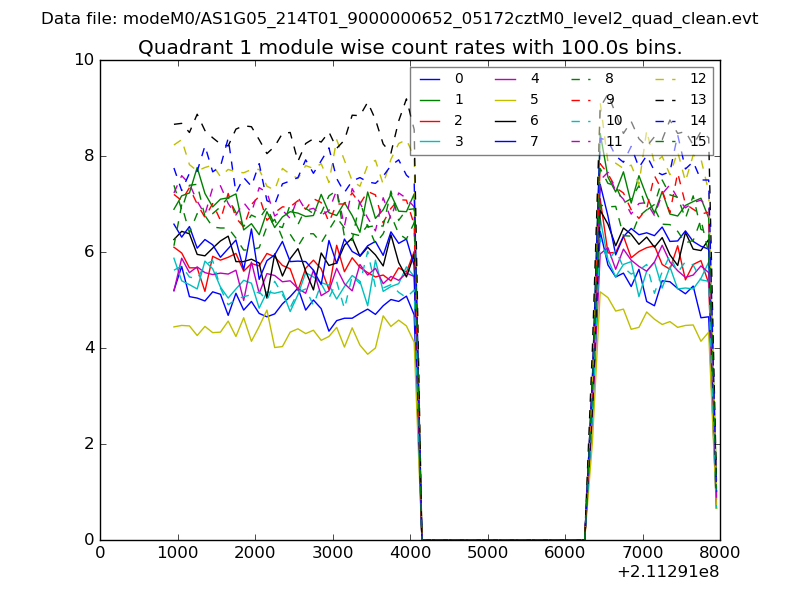
| Module-wise count rates for Quadrant A Data is divided into 100 sec bins |
 |
 |
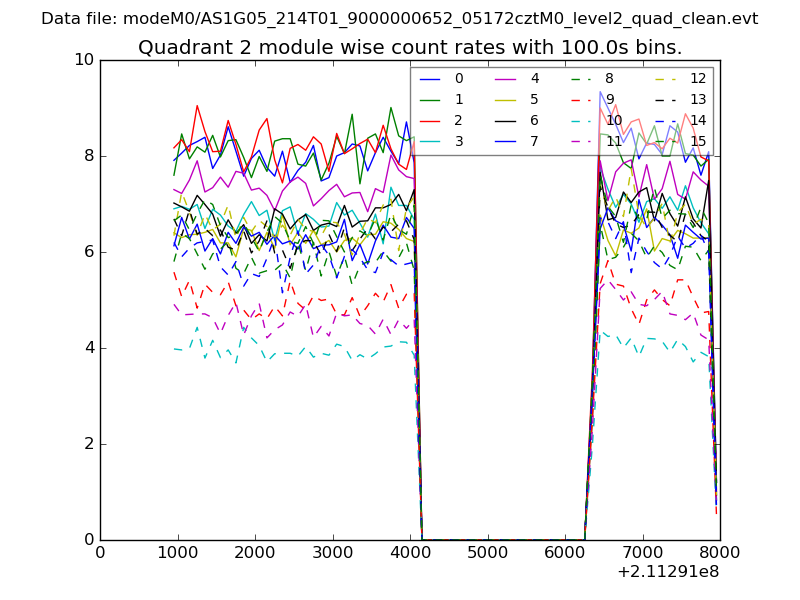
| Module-wise count rates for Quadrant B Data is divided into 100 sec bins |
 |
 |
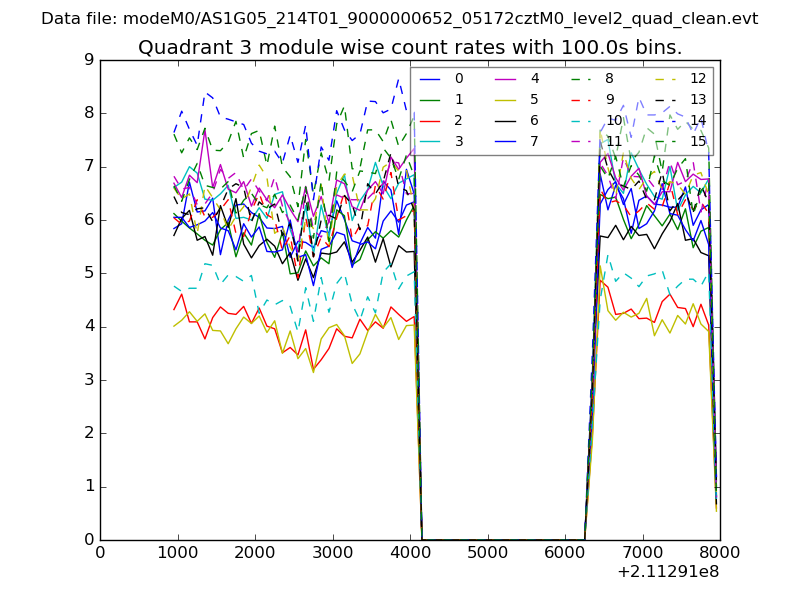
| Module-wise count rates for Quadrant C Data is divided into 100 sec bins |
 |
 |
| Module-wise count rates for Quadrant D Data is divided into 100 sec bins |
 |
 |
| Parameter | Plot |
|---|---|
| CZT HV Monitor | 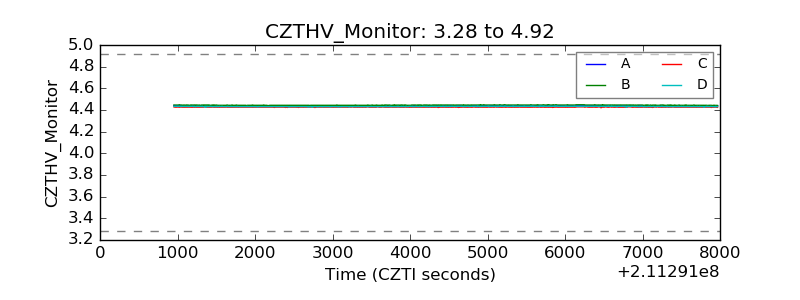 |
| D_VDD | 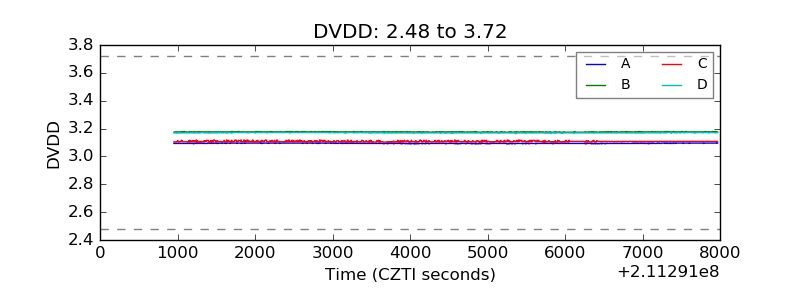 |
| Temperature 1 | 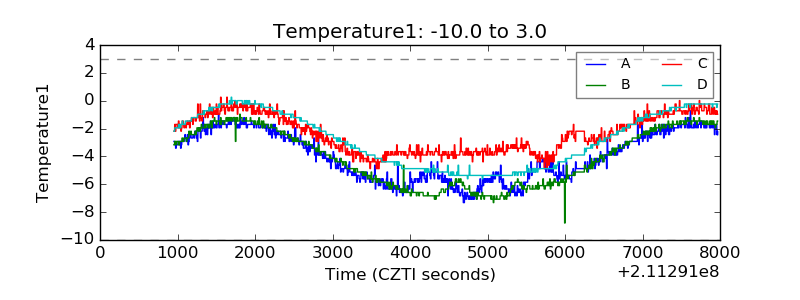 |
| Veto HV Monitor | 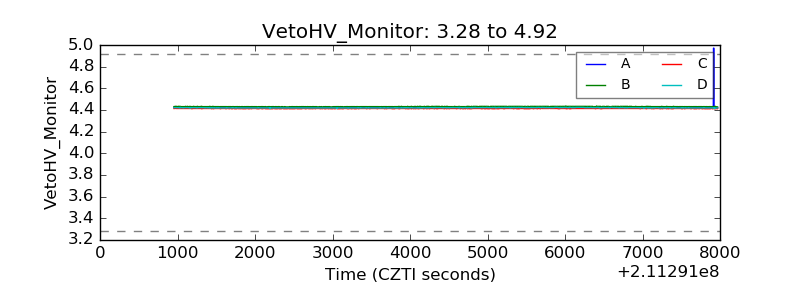 |
| Veto LLD | 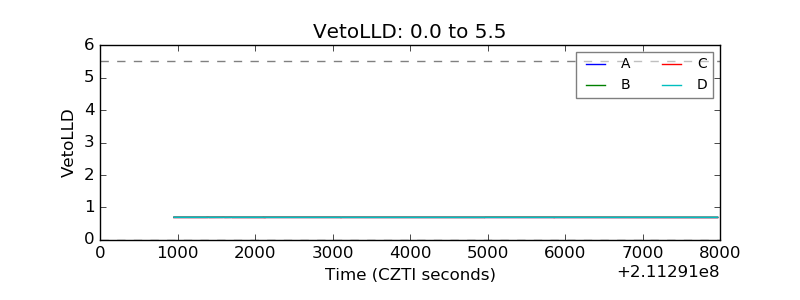 |
| Alpha Counter | 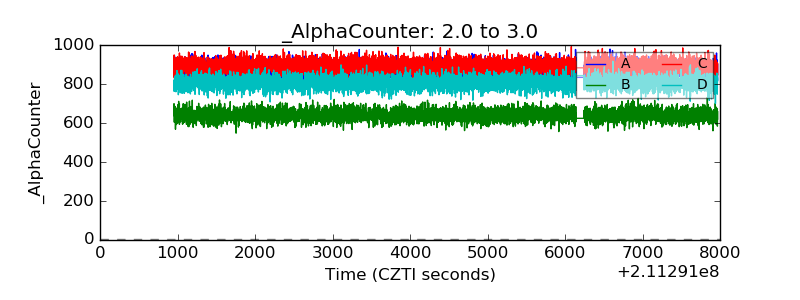 |
| _CPM_Rate | 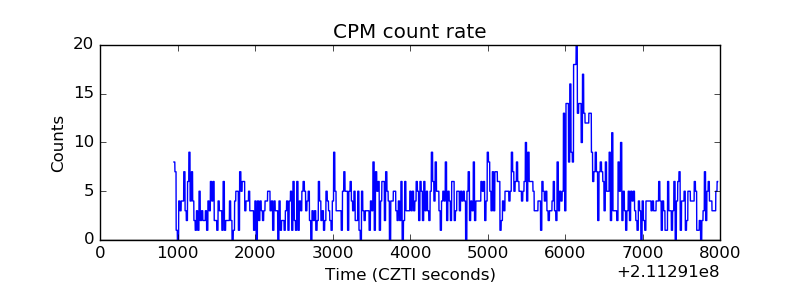 |
| CZT Counter | 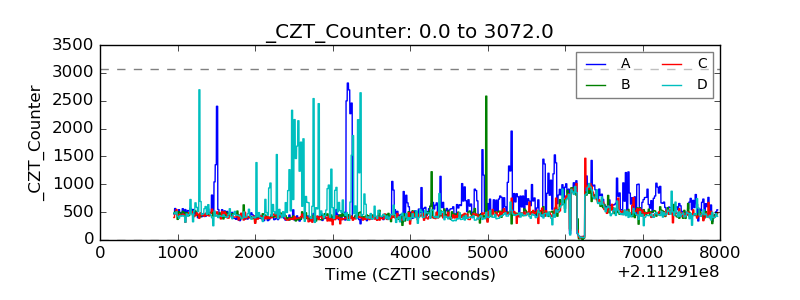 |
| +2.5 Volts monitor |  |
| +5 Volts monitor |  |
| _ROLL_ROT |  |
| _Roll_DEC | 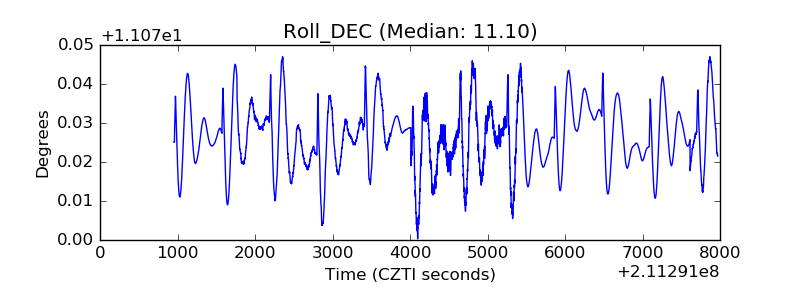 |
| _Roll_RA | 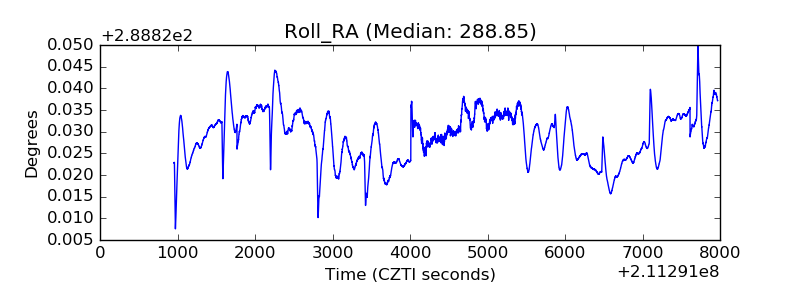 |
| Veto Counter | 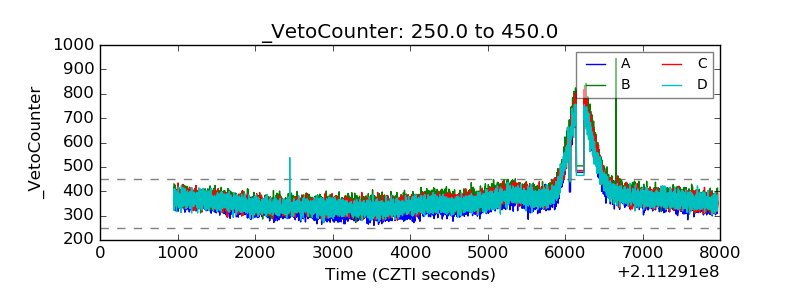 |