| Param | Original file | Final file |
|---|---|---|
| Filename | modeM0/AS1G05_214T01_9000000652_05175cztM0_level2.evt | modeM0/AS1G05_214T01_9000000652_05175cztM0_level2_quad_clean.evt |
| Size (bytes) | 1,189,031,040 | 191,563,200 |
| Size | 1.1 GB | 182.7 MB |
| Events in quadrant A | 8,796,878 | 1,140,824 |
| Events in quadrant B | 8,826,449 | 1,147,650 |
| Events in quadrant C | 8,023,488 | 1,167,878 |
| Events in quadrant D | 9,145,755 | 1,105,052 |
| Mode SS | |||
|---|---|---|---|
| Quadrant | BADHDUFLAG | Total packets | Discarded packets |
| A | 0 | 364 | 0 |
| B | 0 | 364 | 0 |
| C | 0 | 364 | 0 |
| D | 0 | 364 | 0 |
| Mode M9 | |||
|---|---|---|---|
| Quadrant | BADHDUFLAG | Total packets | Discarded packets |
| A | 0 | 17 | 0 |
| B | 0 | 17 | 0 |
| C | 0 | 17 | 0 |
| D | 0 | 17 | 0 |
| Mode M0 | |||
|---|---|---|---|
| Quadrant | BADHDUFLAG | Total packets | Discarded packets |
| A | 0 | 38597 | 7 |
| B | 0 | 38097 | 3 |
| C | 0 | 36733 | 3 |
| D | 0 | 40186 | 3 |
| Quadrant | Total seconds | Saturated seconds | Saturation percentage |
|---|---|---|---|
| A | 17996 | 201 | 1.116915% |
| B | 17997 | 198 | 1.100183% |
| C | 17997 | 90 | 0.500083% |
| D | 17997 | 273 | 1.516919% |
Noise dominated data is calculated using 1-second bins in cleaned event files. If a bin has >2000 counts, and if more than 50% of those come from <1% of pixels, then it is considered to be noise-dominated and hence unusable.
| Quadrant | # 1 sec bins | Bins with >0 counts | Bins with >2000 counts | High rate bins dominated by noise | Noise dominated (total time) | Noise dominated (detector-on time) | Marked lightcurve |
|---|---|---|---|---|---|---|---|
| A | 19662 | 18000 | 24 | 24 | 0.12% | 0.13% | 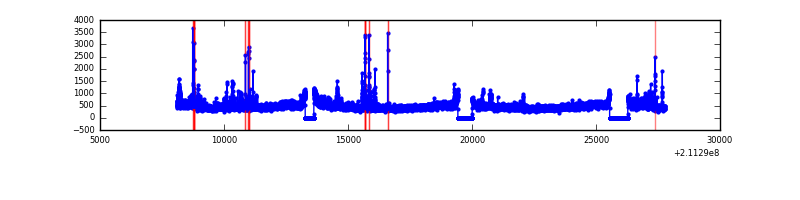 |
| B | 19662 | 18000 | 8 | 8 | 0.04% | 0.04% | 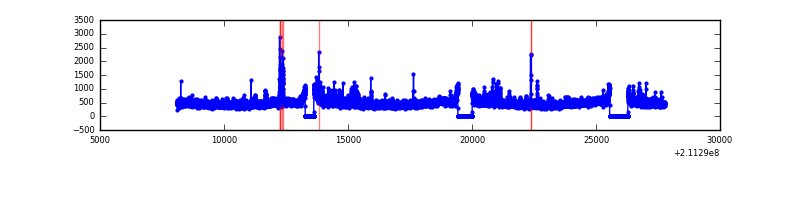 |
| C | 19662 | 18000 | 0 | 0 | 0.00% | 0.00% | 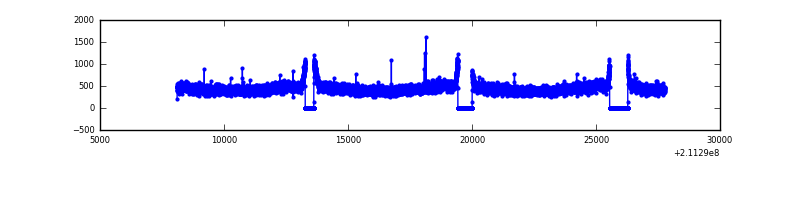 |
| D | 19662 | 18000 | 157 | 157 | 0.80% | 0.87% | 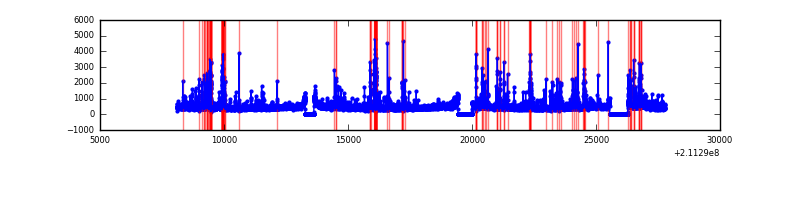 |
Top three noisy pixels from each quadrant. If the there are fewer than three noisy pixels in the level2.evt file, extra rows are filled as -1
| Pixel properties | Quadrant properties | ||||||
|---|---|---|---|---|---|---|---|
| Quadrant | DetID | PixID | Counts | Sigma | Mean | Median | Sigma |
| A | 0 | 247 | 596486 | 1384.94 | 2082 | 2035 | 429.2 |
| A | 0 | 50 | 133874 | 307.16 | 2082 | 2035 | 429.2 |
| A | 0 | 226 | 76137 | 172.64 | 2082 | 2035 | 429.2 |
| B | 15 | 204 | 405616 | 998.1 | 2108 | 2056 | 404.3 |
| B | 5 | 85 | 88843 | 214.64 | 2108 | 2056 | 404.3 |
| B | 15 | 54 | 48205 | 114.14 | 2108 | 2056 | 404.3 |
| C | 1 | 16 | 49368 | 99.86 | 2041 | 2053 | 473.8 |
| C | 13 | 61 | 16471 | 30.43 | 2041 | 2053 | 473.8 |
| C | 12 | 4 | 15628 | 28.65 | 2041 | 2053 | 473.8 |
| D | 2 | 33 | 525280 | 1053.81 | 2026 | 1963 | 496.6 |
| D | 12 | 233 | 428652 | 859.23 | 2026 | 1963 | 496.6 |
| D | 7 | 237 | 138986 | 275.93 | 2026 | 1963 | 496.6 |
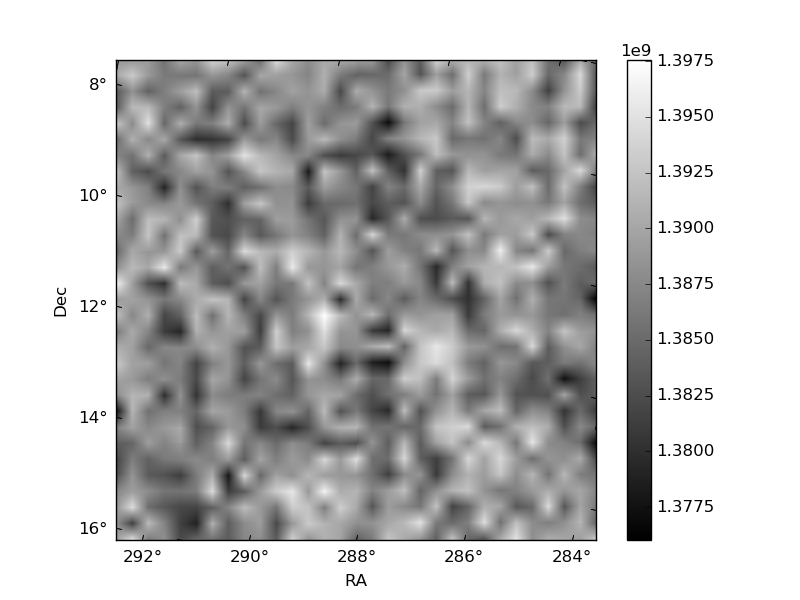
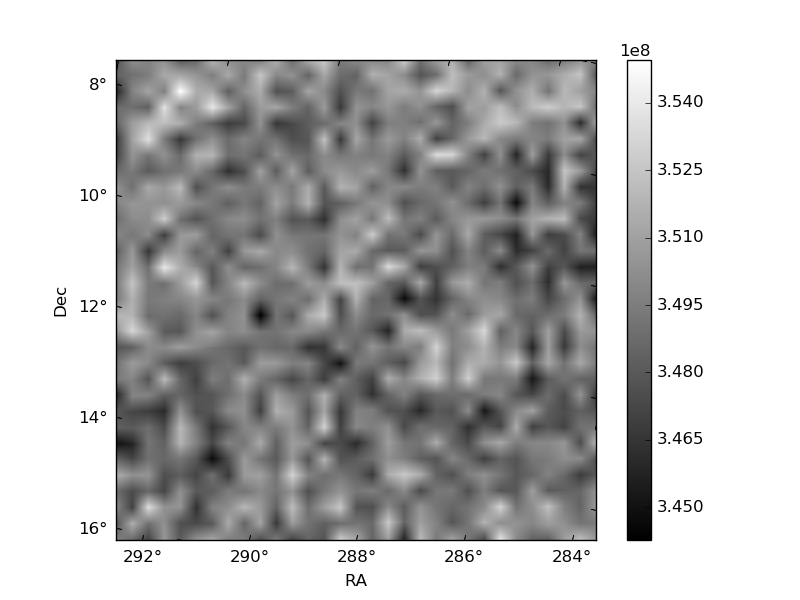
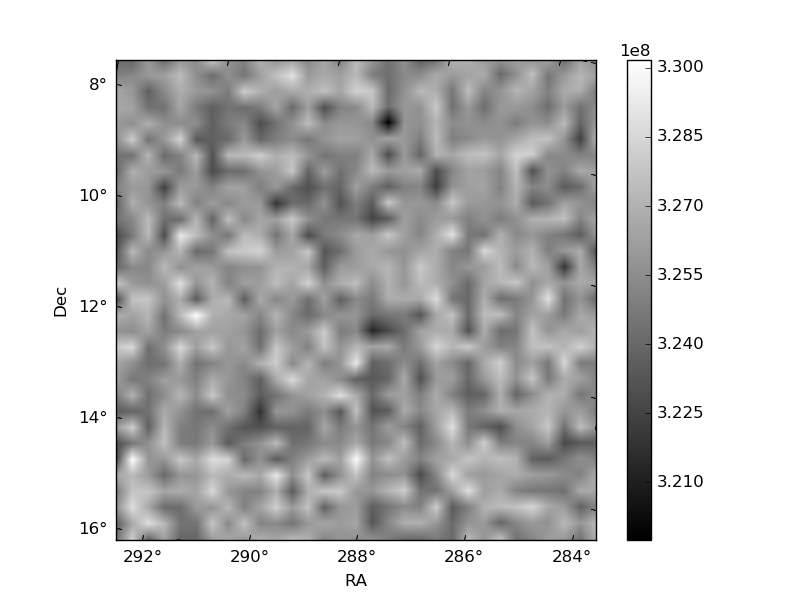
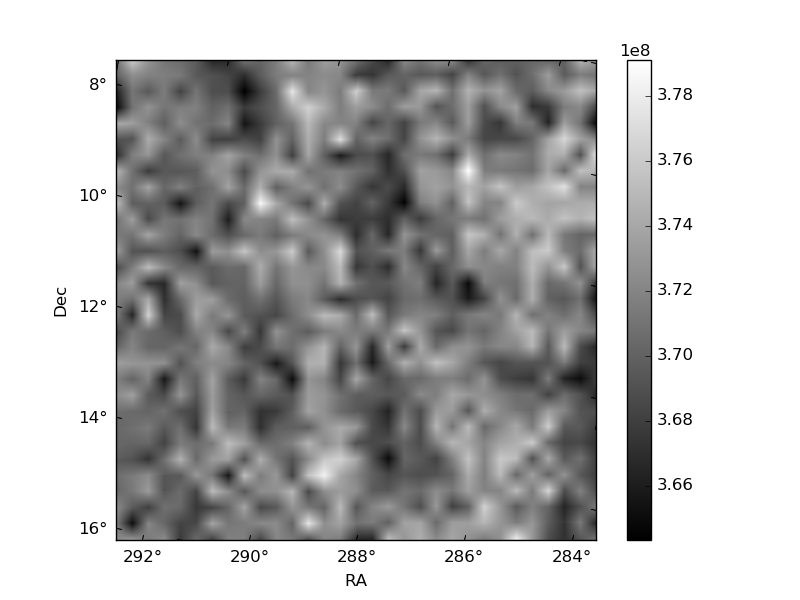
Histogram calculated using DETX and DETY for each event in the final _common_clean file
| Quadrant A | 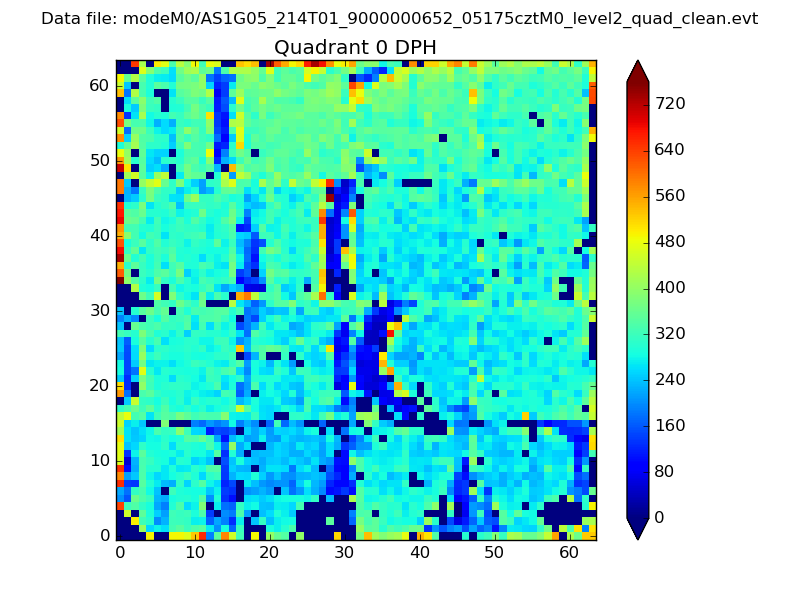 |
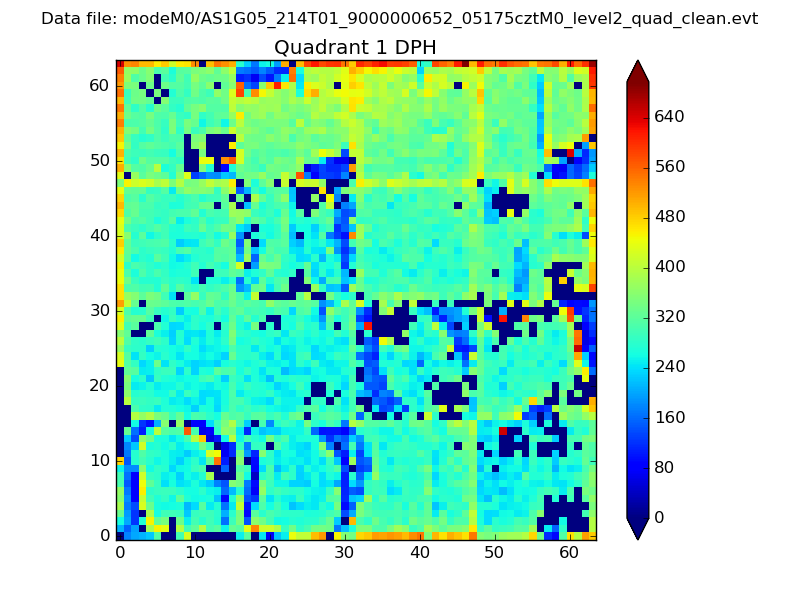 |
Quadrant B |
|---|---|---|---|
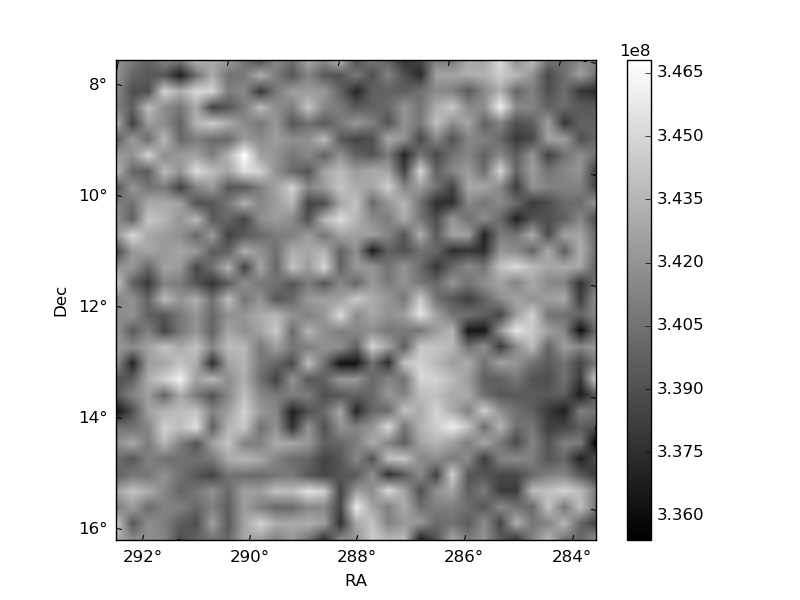
| Quadrant D | 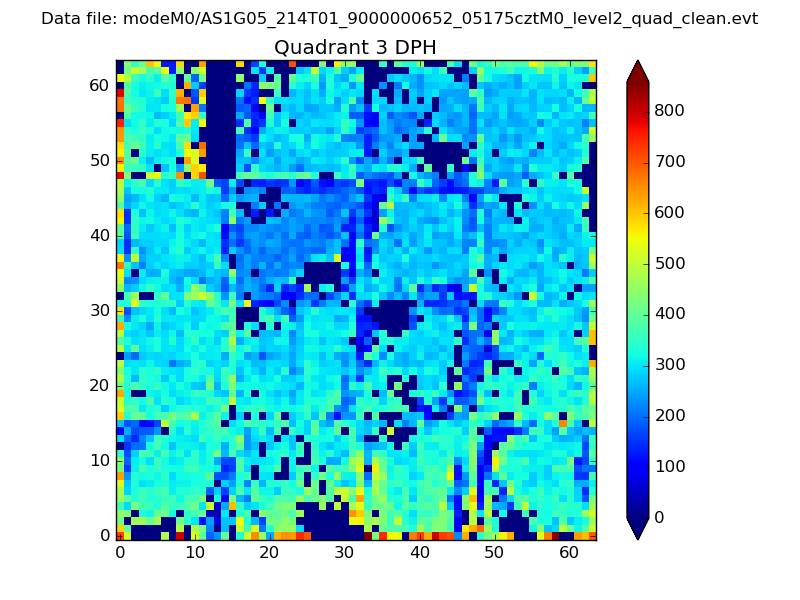 |
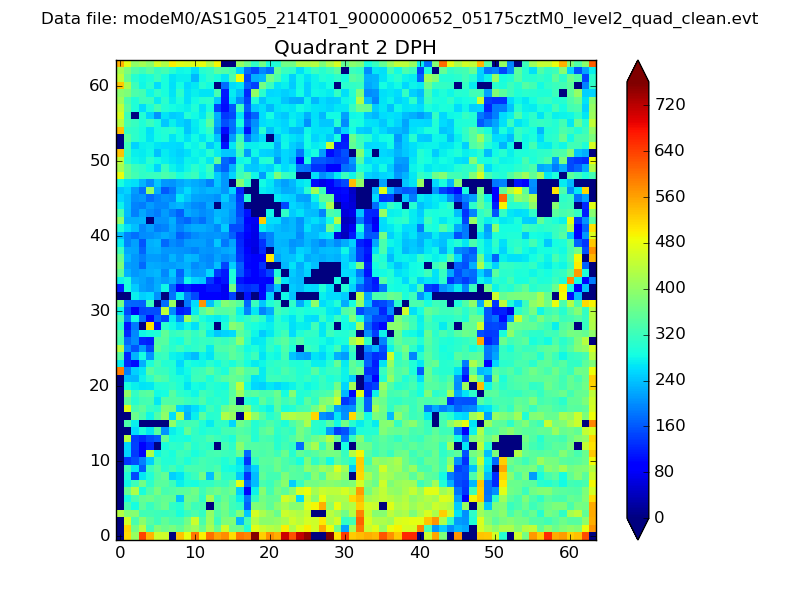 |
Quadrant C |
| Plot type | Count rate plots | Images |
|---|---|---|
| Comparison with Poisson distribution Blue bars denote a histogram of data divided into 1 sec bins. Red curve is a Poisson curve with rate = median count rate of data. |
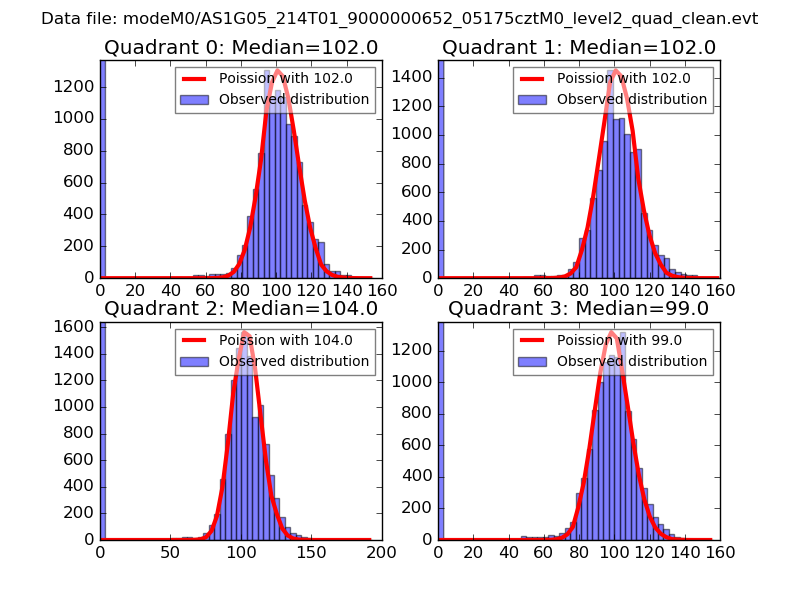 |
 |
| Quadrant-wise count rates Data is divided into 100 sec bins |
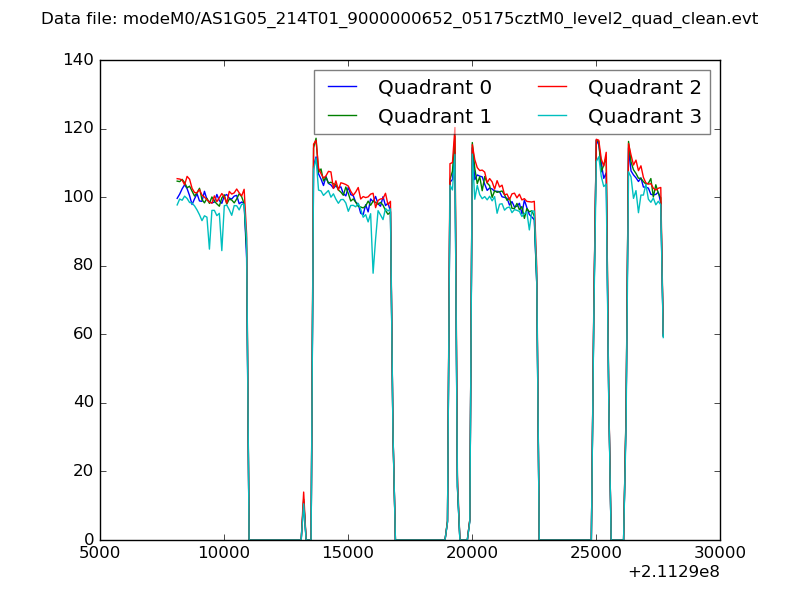 |
|
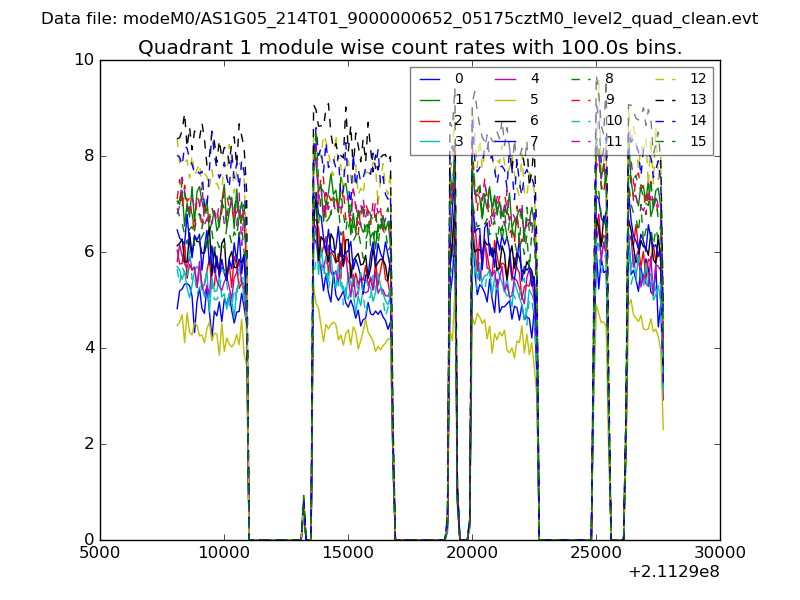
| Module-wise count rates for Quadrant A Data is divided into 100 sec bins |
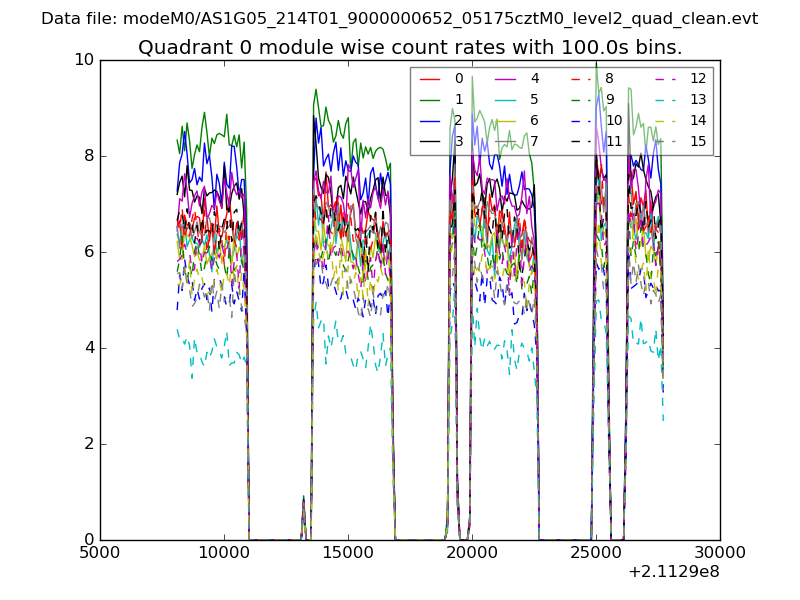 |
 |
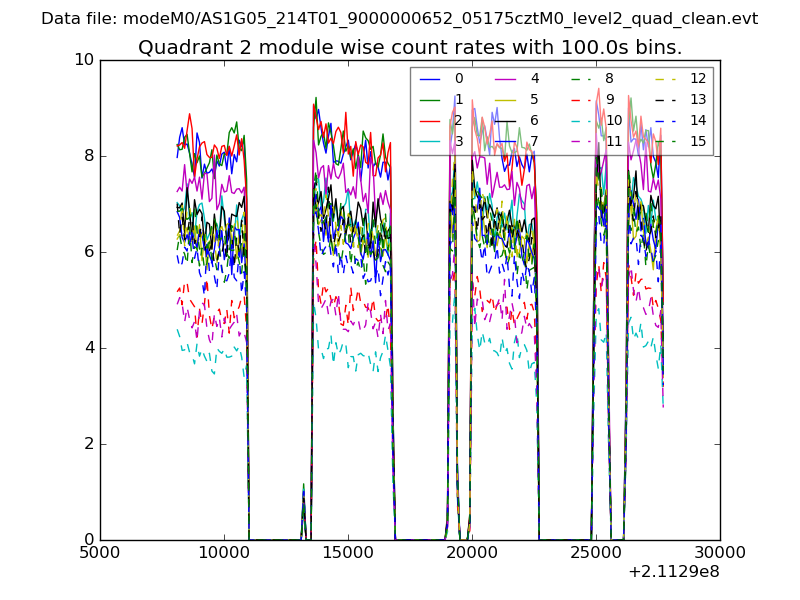
| Module-wise count rates for Quadrant B Data is divided into 100 sec bins |
 |
 |
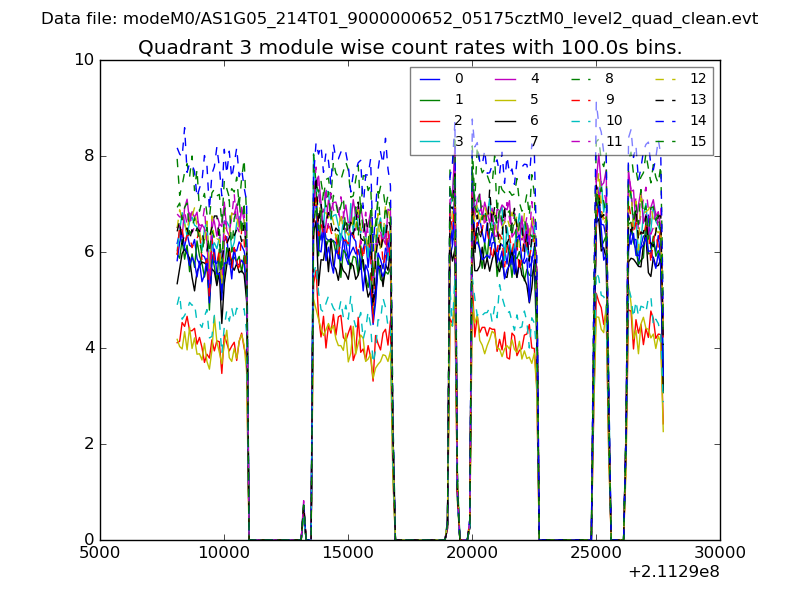
| Module-wise count rates for Quadrant C Data is divided into 100 sec bins |
 |
 |
| Module-wise count rates for Quadrant D Data is divided into 100 sec bins |
 |
 |
| Parameter | Plot |
|---|---|
| CZT HV Monitor | 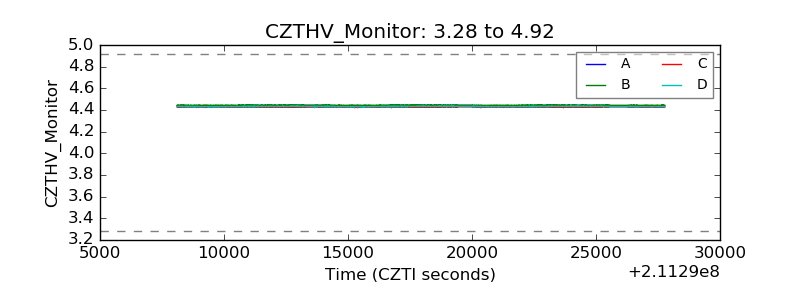 |
| D_VDD | 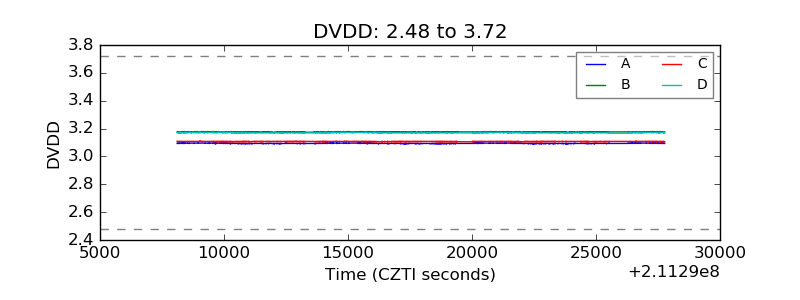 |
| Temperature 1 | 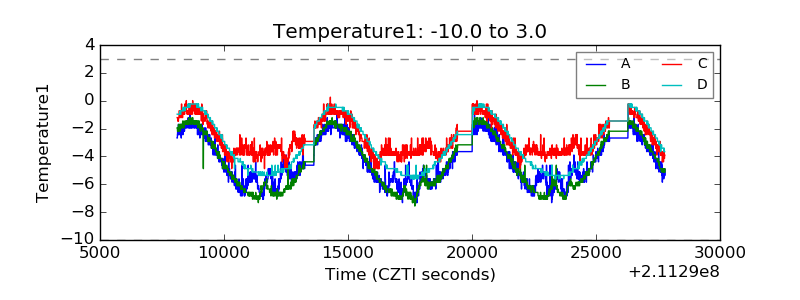 |
| Veto HV Monitor | 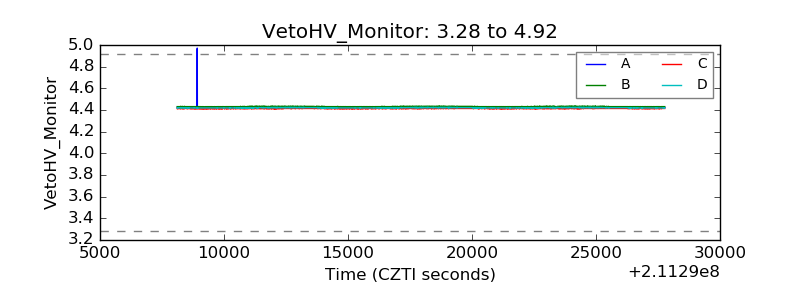 |
| Veto LLD | 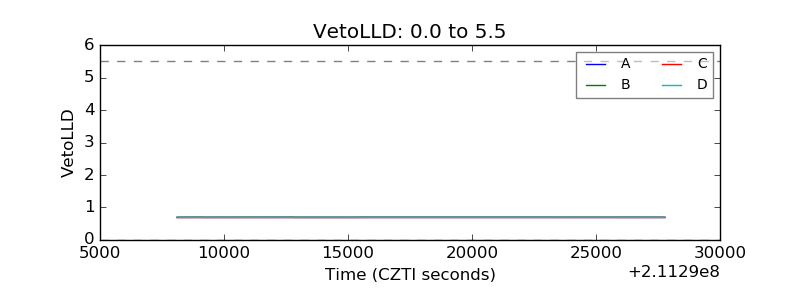 |
| Alpha Counter | 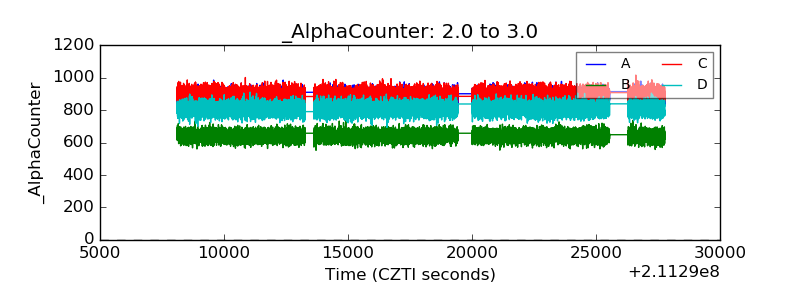 |
| _CPM_Rate | 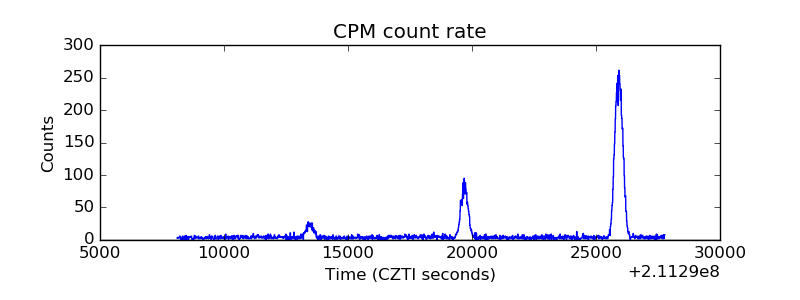 |
| CZT Counter | 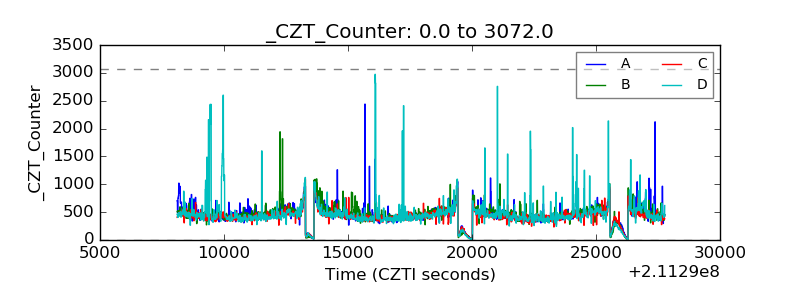 |
| +2.5 Volts monitor |  |
| +5 Volts monitor |  |
| _ROLL_ROT | 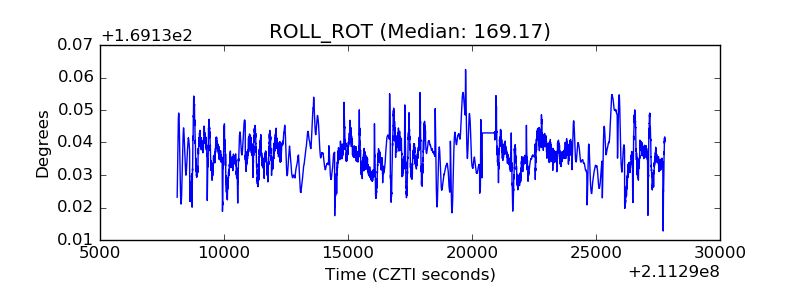 |
| _Roll_DEC | 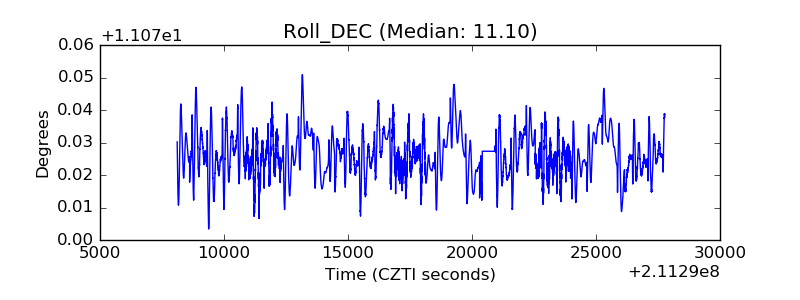 |
| _Roll_RA | 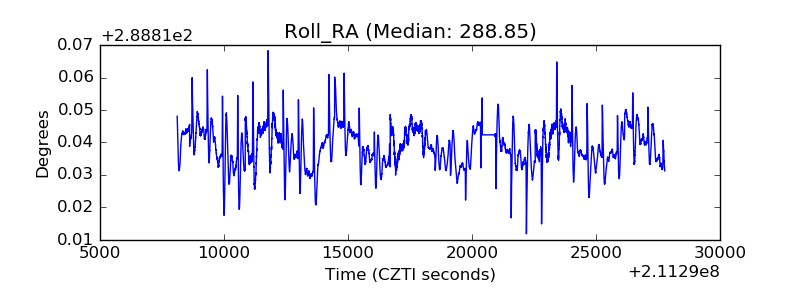 |
| Veto Counter | 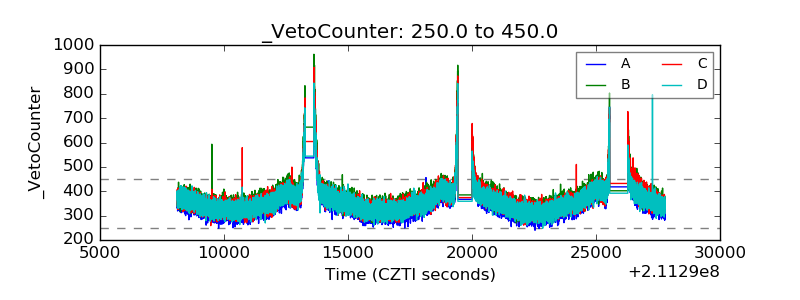 |